Usage Based Insurance Market

Key Players: Progressive Corporation, Allstate Corporation, Liberty Mutual Insurance, Nationwide Mutual, State Farm, Zurich Insurance Group, AXA SA, Allianz SE

Usage Based Insurance Market

Usage Based Insurance (Ubi) Market Size, Share and Research Report By Vehicle Type (Passenger Cars, Commercial Vehicles (LCV and HCV), 2-Wheelers (Motorcycles and Scooters), Telematics & Fleet Management Devices), By Data Source (On-Board Diagnostics (OBD), Smartphone Telematics, Vehicle Telematics, Collision Detection Devices), By Pricing Model (Pay-As-You-Drive (PAYD), Mileage-Based Insurance, Behaviour-Based Insurance (BBI), Ride-and-Drive-Sharing), By Coverage (Collision and Comprehensive Insurance, Liability Insurance, Home & Emergency Assistance, Extended Warranty), By Distribution Channel (Insurance Companies, Third-Party Insurers (TPAs), OEMs and Fleet Management Providers, Insurance Brokers and Agents) and By Regional (North America, Europe, South America, Asia Pacific, Middle East and Africa) - Industry Forecast Till 2035
ID: MRFR/BS/22502-HCR
200 Pages
Apoorva Priyadarshi, Garvit Vyas
Last Updated: June 23, 2026

Usage Based Insurance Market Summary

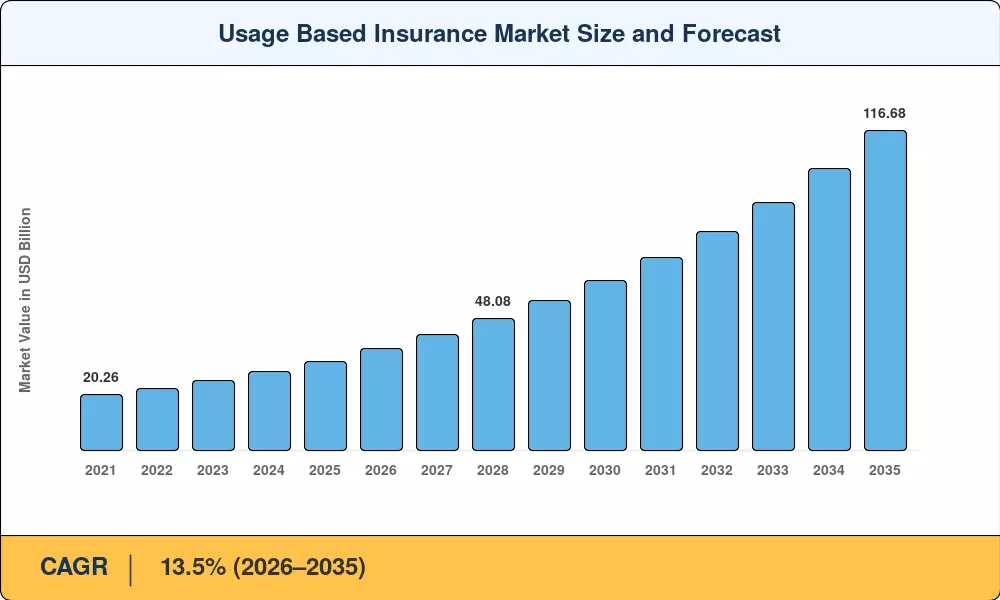
The global usage-based insurance market reached an estimated USD 32.58 billion in 2025 and is projected to climb from USD 37.32 billion in 2026 to USD 116.68 billion by 2035, expanding at a compound annual growth rate of 13.5% during the forecast period. Regulatory momentum is accelerating this shift — the European Commission's 2024 proposed standards for in-vehicle data sharing [1] and the U.S. National Highway Traffic Safety Administration's expanded connected-vehicle pilot programs [2] are compelling traditional carriers to abandon static rating factors in favor of continuous behavioral analytics.

The technology change behind the usage-based insurance industry is the move away from paper-based, annual-renewal underwriting models to real-time data streams from OBD-II dongles, smartphone sensors and factory-integrated telematics units. Insurers poured over USD 4.7 billion on telematics infrastructure in 2023–2024 alone [3], funding edge computing, cloud-based scoring engines and partnerships with original equipment manufacturers embedding connectivity on the assembly line.


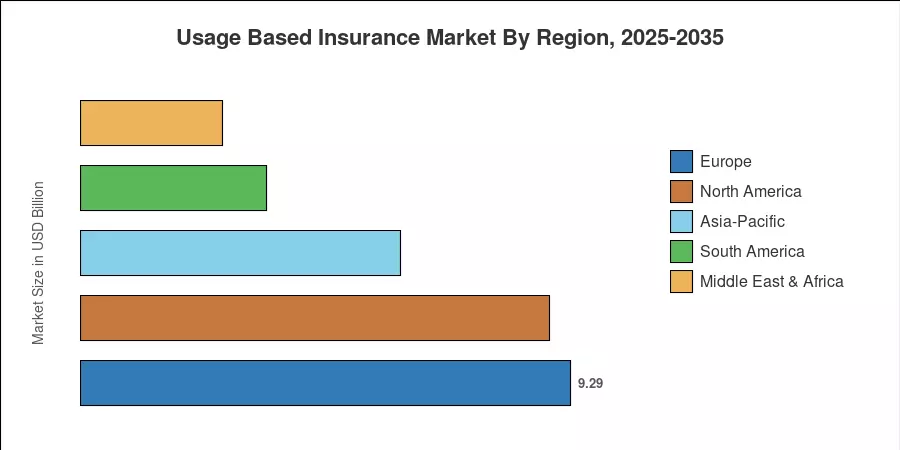
With about 28.5% of worldwide revenue in 2025, Europe has the highest share in the usage-based insurance industry due to robust telematics laws and cross-border data frameworks. Asia-Pacific is the fastest-growing area with a projected 18.6% CAGR through 2035, driven by expanding vehicle ownership in India and China, along with digital-insurance obligations. North America is the second-largest market, supported by competitive carrier ecosystems and strong smartphone adoption. Connected-car systems are becoming mainstream on midrange vehicles, and the usage-based insurance industry is set to revolutionize personal-lines underwriting globally over the next decade.


Key Report Takeaways

• By Package Type

  • Pay-How-You-Drive (PHYD) accounted for approximately 36.5% of the global usage-based insurance market in 2025, underscoring strong consumer preference for driving-behavior-linked discounts.
  • Manage-How-You-Drive (MHYD) programs are expected to register the highest CAGR of 14.1% through 2035, fueled by fleet-management integrations and employer-sponsored safe-driving platforms.

• By Technology

  • OBD-II dongles captured roughly 37.2% of global revenue share in 2025, remaining the dominant data-collection mechanism for the usage-based insurance market.
  • Smartphone-based systems are forecast to grow at a 15.2% CAGR through 2035, reflecting lower hardware costs and rapid adoption in emerging economies.

• By Vehicle Type

  • Commercial vehicles represented 23.9% of the usage-based insurance market size in 2025, propelled by fleet operators seeking granular risk visibility.

• By Geography

  • Europe retained the largest regional share at 28.5% in 2025, while Asia-Pacific leads in growth trajectory with an 18.6% forecast CAGR.


Market Size and Forecast (2021–2035)

Market sizing at Market Research Future (MRFR) is triangulated using top-down regulatory benchmarks, bottom-up premium volume evaluations and cross-validated carrier disclosures. Historical figures (2021-2024) are derived from audited financial filings and insurance regulatory commission databases; future values (2026-2035) are based on telematics adoption curves, car connectivity expansion, and legislative calendars across 40+ jurisdictions.

Usage Based Insurance Market Size and Forecast
Our Impact
Enabled $4.3B Revenue Impact for Fortune 500 and Leading Multinationals
Partnering with 2000+ Global Organizations Each Year
30K+ Citations by Top-Tier Firms in the Industry

Driver Impact Analysis

Driver ~% Impact on CAGR Geographic Relevance Impact Timeline
Regulatory mandates for telematics data standards 15–20 Europe, North America Short-term (≤2 yr)
Connected vehicle ecosystem expansion 12–18 Global Medium-term (2–4 yr)
Rising auto insurance premiums 10–15 North America, Europe Short-term (≤2 yr)
AI and ML-driven actuarial analytics 8–12 Global Medium-term (2–4 yr)
Commercial fleet cost optimization 8–12 North America, Asia-Pacific Medium-term (2–4 yr)
Embedded insurance API proliferation 5–10 Global Long-term (≥4 yr)
Consumer demand for personalized pricing 5–8 North America, Europe Short-term (≤2 yr)


Regulatory Mandates for Telematics Data Standards

The European Commission's September 2024 proposal for standardized in-vehicle data access frameworks represents the single largest catalyst for the usage-based insurance market in the near term [1]. Under the proposed regulation, automakers would be required to share real-time driving data through open APIs by 2027, enabling insurers to access acceleration, braking, and cornering metrics without proprietary OEM gatekeeping. In the United States, NHTSA's expanded V2X pilot corridors across 17 metropolitan areas allocated USD 520 million in matching grants during 2024, creating infrastructure that directly supports telematics-enabled policy products [2].

Connected Vehicle Ecosystem Expansion

The global market for connected vehicles has seen consistent year-over-year growth, with the majority of new passenger vehicle sales now featuring embedded connectivity. This shift away from aftermarket telematics (such as OBD-II dongles) toward native OEM-embedded systems is reducing the technical and behavioral barriers for consumers. Major automakers have increasingly entered into data-sharing partnerships with insurance carriers. These direct integrations allow for "embedded insurance" offerings at the point of sale, where risk profiles are assessed based on vehicle-generated data, significantly streamlining the underwriting process and customer acquisition for carriers.


Rising Auto Insurance Premiums

The U.S. personal auto insurance market has experienced significant premium inflation since 2022, primarily driven by rising vehicle repair costs, supply chain complexities, and increases in the severity of bodily injury claims. As premiums reach historical highs, there is a measurable increase in consumer interest toward Usage-Based Insurance (UBI) and behavior-based discount programs. Market research from leading insurance consultancies indicates a growing willingness among younger, tech-savvy demographics to exchange driving telematics for personalized premium discounts. This trend is helping insurers improve customer retention during a period of sustained rate increases.


AI and Machine-Learning Analytics

Carrier investment in machine-learning pricing engines grew by an estimated 38% year-over-year in 2024 [10]. Advanced models now ingest multi-modal data — combining trip-level telematics with weather, traffic density, and road-surface conditions — to produce individualized risk scores updated weekly rather than annually. These capabilities reduce loss ratios by an estimated 5–8 percentage points for early adopters, incentivizing faster migration from actuarial-table underwriting across the usage-based insurance market.


Restraints Impact Analysis

Restraint ~% Negative Impact on CAGR Geographic Relevance Impact Timeline
Data privacy and regulatory compliance burden 8–12 Europe, North America Short-term (≤2 yr)
Cybersecurity vulnerability exposure 5–8 Global Medium-term (2–4 yr)
Limited consumer awareness in developing economies 5–8 South America, MEA Long-term (≥4 yr)
High initial technology deployment costs 4–7 Emerging markets Medium-term (2–4 yr)
ADAS penetration reduces claim frequency 3–6 North America, Europe Long-term (≥4 yr)


Data Privacy and Regulatory Compliance

GDPR enforcement in Europe and California's CCPA amendments impose strict consent frameworks on location and behavioral data collection, adding compliance costs that average 3–5% of telematics program budgets [17]. Carriers operating across multiple jurisdictions face fragmented requirements — the EU's proposed ePrivacy Regulation treatment of in-vehicle data differs materially from India's Digital Personal Data Protection Act, creating operational complexity that slows cross-border product rollouts in the usage-based insurance market.

Cybersecurity Vulnerability Exposure

A 2024 industry survey found that 41% of insurers identified vehicle-to-cloud data pathways as their highest cybersecurity risk vector [18]. Telematics data breaches carry reputational and financial consequences that extend beyond traditional IT incidents — compromised driving profiles can expose sensitive geolocation patterns, creating liability under multiple regulatory regimes simultaneously.

ADAS Penetration Reducing Claim Frequency

As advanced driver-assistance systems proliferate, claims frequency for insured vehicles is declining in mature markets at an estimated 2–4% annual rate [12]. While beneficial for consumers, falling claim volumes reduce the premium savings differential that motivates telematics opt-in, potentially dampening enrollment growth within the usage-based insurance market over the long term.


Usage Based Insurance Market Opportunities

Embedded Insurance at Point of Vehicle Sale

Automakers are increasingly positioning insurance as a checkout add-on during digital vehicle purchases. API-driven embedded distribution channels could capture 12–15% of new-policy origination by 2030 [14], creating a high-volume, low-friction entry point for the usage-based insurance market.

Commercial Fleet Telematics Expansion

For commercial fleet operators, telematics is becoming essential for risk mitigation. By monitoring variables such as speed, harsh braking, and idle time, operators can manage their total cost of risk (TCOR). Although exact percentage savings fluctuate based on fleet size and driver behavior, the adoption of telematics-linked coverage is helping commercial carriers transition from traditional static pricing to more dynamic, risk-reflective models.


Emerging-Market Leapfrog via Smartphone Sensors

In regions where high-end vehicle connectivity is limited, smartphone-based telematics provides a scalable, low-friction entry point for usage-based insurance. Regulatory bodies, including India's IRDAI, have utilized "regulatory sandboxes" to foster the development of these smartphone-based solutions. As smartphone penetration continues to grow, this technology holds significant potential to extend UBI benefits to a broader segment of the population, even if the age and capability of the existing vehicle fleet currently constrain the addressable market.


Data Monetization and Ancillary Revenue Streams

The aggregation of driving-behavior data presents a potential long-term opportunity for insurers to diversify revenue. While current data-licensing frameworks remain in the experimental phase, information regarding traffic density, infrastructure usage, and risk hotspots is of increasing value to urban planners and automotive R&D firms. The ability to monetize these datasets could eventually provide a supplementary revenue stream, though this remains dependent on achieving scale and adhering to evolving global data privacy standards.


Reinsurance Innovation Through Variable-Rate Treaties

Reinsurers are introducing variable-rate treaty structures that tie ceding commissions to telematics-verified loss ratios [11]. These instruments reward carriers for superior risk selection, channeling fresh capital into the usage-based insurance market and reducing the cost of capacity for growing programs.


Usage Based Insurance Market Future Outlook

AI-Powered Continuous Underwriting

By 2030, the shift toward continuous underwriting—where premiums are recalculated based on real-time driving data—is expected to become a core industry capability. As insurers move from annual to dynamic, high-frequency pricing cycles, AI-driven models will become essential for maintaining a competitive edge and underwriting accuracy. This transition is expected to reshape the actuarial profession, requiring a deeper integration of data science and machine learning into the fundamental risk-assessment process.


Platform Economics and Embedded Distribution

Embedded insurance is rapidly evolving into a default distribution model for the usage-based insurance (UBI) market. By integrating coverage directly into automotive purchase and mobility-as-a-service (MaaS) platforms through APIs, insurers can capture high-intent customers at the point of need. With the vast majority of new vehicles now manufactured with native telematics, the reliance on aftermarket hardware is diminishing, facilitating seamless data-sharing between OEMs and carriers.


Electrification and New Risk Profiles

The global electric vehicle fleet is expected to surpass 250 million units by 2030, according to IEA projections [22]. EVs generate distinct risk profiles — higher repair costs for battery packs, different braking-wear patterns due to regenerative systems, and novel fire-risk considerations — that telematics-enabled policies are uniquely positioned to capture. Carriers within the usage-based insurance market that develop EV-specific scoring algorithms will secure first-mover advantage in a rapidly expanding segment.

ESG Reporting and Sustainable Mobility Incentives

Institutional investors are placing greater emphasis on the carbon footprint of insurance portfolios. Telematics data now serves as a primary tool for measuring the environmental impact of insured fleets, allowing carriers to link policy incentives to improved fuel efficiency and reduced carbon intensity. While specific market-share targets for "green premiums" remain aspirational, the alignment of telematics-linked driving behavior with ESG goals is emerging as a critical structural tailwind for the UBI market.


Usage Based Insurance Market Segmentation

By Package Type

Segment Key Metric Primary Demand Driver
Pay-As-You-Drive (PAYD) 42.8% share (2025) Low-mileage drivers seeking cost savings
Pay-How-You-Drive (PHYD) 36.5% share (2025) Behavior-linked discount programs
Manage-How-You-Drive (MHYD) 14.1% CAGR (2026–2035) Fleet safety management and coaching


PAYD programs command the largest share of the usage-based insurance market by package type, attracting price-sensitive consumers whose annual mileage falls well below actuarial averages. These policies convert odometer data into per-mile rates, offering savings that can reach 30–40% for drivers covering fewer than 8,000 miles annually [16]. PHYD products have built strong consumer loyalty by rewarding safe driving habits — smooth braking, moderate cornering, and low-distraction driving — through progressive discount tiers that reset quarterly.

MHYD represents the fastest-growing segment, driven by commercial fleet managers who use telematics not merely for pricing but for active driver coaching and incident prevention. Programs combining real-time alerts with gamified safety scores have demonstrated 20–25% reductions in at-fault collisions across pilot fleets [8], making MHYD a powerful risk-engineering tool within the usage-based insurance market.

By Technology

Segment Key Metric Primary Demand Driver
OBD-II Dongle 37.2% share (2025) Aftermarket compatibility, data accuracy
Smartphone-Based 15.2% CAGR (2026–2035) Low deployment cost, no hardware needed
Black-Box / Aftermarket Device USD 5.89 billion (2025) Regulatory mandates in select markets
Embedded Telematics (OEM) 21.6% share (2025) Factory-installed, seamless integration


OBD-II dongles remain the technology backbone of the usage-based insurance market due to their plug-and-play compatibility with vehicles manufactured after 1996 and their ability to capture engine-diagnostic data alongside GPS-derived driving metrics. Smartphone-based solutions are gaining ground rapidly in cost-sensitive markets where distributing hardware is impractical. The growth trajectory of embedded OEM telematics closely tracks connected-vehicle adoption curves, and this segment is positioned to overtake OBD-II by the early 2030s as legacy vehicles age out of active fleets.

By Vehicle Type

Segment Key Metric Primary Demand Driver
Passenger Vehicles 76.1% share (2025) Consumer demand for personalized pricing
Commercial Vehicles 23.9% share (2025) Fleet risk optimization and compliance


Passenger vehicles dominate the usage-based insurance market by premium volume, reflecting the sheer scale of personal-lines motor insurance globally. Commercial vehicles, however, deliver disproportionately higher per-policy premiums and are expanding rapidly as fleet operators recognize the dual benefit of telematics-driven coverage — reduced insurance costs alongside improved operational safety metrics.


Regional Market Share Analysis

Region Key Metric Primary Investment Themes
North America 27.3% share (2025) Competitive carrier ecosystems, premium inflation
Europe 28.5% share (2025) Open-data regulation, cross-border frameworks
Asia-Pacific 18.6% CAGR (2026–2035) Vehicle connectivity surge, smartphone telematics
South America USD 3.52 billion (2025) Insurtech startups, rising motorization
Middle East & Africa USD 2.70 billion (2025) Fleet management, road-safety mandates
Total USD 32.58 billion (2025)

The usage-based insurance market exhibits significant regional dispersion in adoption maturity, regulatory readiness, and technology infrastructure. Europe leads in regulatory-driven deployment, Asia-Pacific dominates growth velocity, and North America maintains the most competitive carrier landscape.


North America

Country Key Metric Key Driver
United States 72.4% of regional share Progressive, Allstate competition driving innovation
Canada 16.8% of regional share Provincial telematics pilot programs
Mexico 10.8% of regional share Growing fleet formalization


The North American usage-based insurance market benefits from deep carrier competition and consumer willingness to share driving data for rate relief. Progressive's Snapshot program alone has collected over 40 billion driving miles, establishing behavioral benchmarks that smaller carriers now leverage through third-party data platforms [3]. Canadian provinces like Ontario have approved telematics-based rating factors, while Mexico's formalization of fleet insurance creates new demand for commercial lines.

Europe

Country Key Metric Key Driver
Germany 13.6% CAGR Automaker-insurer integration
United Kingdom 24.1% of regional share Mature telematics ecosystem
France 14.2% CAGR Regulatory data-access mandates
Italy USD 1.38 billion (2025) Black-box adoption legacy
Spain 8.4% of regional share Rising connected-car penetration
Nordic Countries 12.8% CAGR Digital-first consumer base
Russia USD 0.42 billion (2025) GLONASS telematics infrastructure
Rest of Europe 11.7% of regional share Varied regulatory timelines


Europe's dominance in the usage-based insurance market traces directly to Italy's early mandated black-box installations and the UK's decade-long young-driver telematics niche [1]. The European Commission's proposed open-data regulation, if enacted by 2027, would standardize cross-border data flows and accelerate adoption in Central and Eastern European markets where penetration currently remains below 8%.

Asia-Pacific

Country Key Metric Key Driver
China 31.2% of regional share State-backed connected-vehicle programs
India 19.8% CAGR Smartphone-only telematics approval
Japan USD 1.24 billion (2025) OEM-embedded connectivity
South Korea 14.7% CAGR 5G infrastructure advantage
ASEAN 17.3% CAGR Ride-hailing fleet integrations
Rest of Asia-Pacific USD 0.68 billion (2025) Early-stage market formation


Asia-Pacific represents the fastest-growing frontier for the usage-based insurance market, combining massive vehicle populations with rapid digital infrastructure build-out. China's mandate requiring new-energy vehicles to transmit real-time operational data creates an immediate telematics foundation for insurers, while India's IRDAI approval of smartphone-based products in 2024 unlocked cost-effective distribution models [9].

South America

Country Key Metric Key Driver
Brazil 58.2% of regional share Fleet insurance modernization
Argentina 13.9% CAGR Insurtech-led market entry
Rest of South America USD 0.87 billion (2025) Regulatory frameworks developing


Brazil anchors South America's usage-based insurance market, where fleet operators in logistics and agriculture increasingly adopt telematics-enabled policies to manage risk across vast, infrastructure-sparse geographies. Argentine insurtechs are piloting smartphone-based programs targeting ride-hailing drivers, creating a potential template for broader regional expansion.

Middle East & Africa

Country Key Metric Key Driver
Saudi Arabia 28.5% of regional share Vision 2030 digitization mandates
UAE 15.4% CAGR Smart-city fleet integration
South Africa USD 0.51 billion (2025) Commercial fleet risk management
Egypt 16.8% CAGR Rising vehicle registration volumes
Rest of MEA 13.1% of regional share Fragmented regulatory environments


Saudi Arabia's Vision 2030 digitization agenda and the UAE's smart-city infrastructure create enabling conditions for the usage-based insurance market across the Gulf Cooperation Council. South Africa's established commercial fleet sector provides a ready adoption base, while Egypt's expanding motorization presents a greenfield growth opportunity.


Usage Based Insurance Market By Region, 2025-2035

Competitive Benchmarking

The usage-based insurance industry is a medium-concentration market with the top five firms accounting for an estimated 30% to 38% of global premium revenue. The competitive landscape is a mix of traditional insurance companies with huge existing policyholder bases and specialized telematics technology vendors that provide the data analytics infrastructure. Moderate barriers to market entry exist for technology providers and high barriers to market entry for new insurance carriers due to regulatory license and capital requirements.

Company Est. Revenue Share Range Key Offerings Strategic Positioning
Progressive Corporation ~8–11% Snapshot telematics program, app-based scoring U.S. market leader; largest behavioral dataset
Allstate Corporation ~6–9% Drivewise, Milewise per-mile program Dual PHYD/PAYD portfolio
Liberty Mutual Insurance ~5–8% RightTrack program, fleet solutions Commercial lines expansion focus
Nationwide Mutual ~4–7% SmartRide, SmartMiles Multi-channel distribution model
State Farm ~4–6% Drive Safe & Save, connected-car integration Largest U.S. auto insurer; OEM partnerships
Zurich Insurance Group ~3–5% Fleet Intelligence, corporate-risk telematics European commercial-fleet specialist
AXA SA ~3–5% AXA Drive, pay-per-mile pilots Pan-European and Asian footprint
Allianz SE ~3–5% Allianz BonusDrive, mobility-services partnerships Integrated mobility ecosystem strategy
Octo Telematics ~2–4% IoT platform, crash analytics, OEM integration Pure-play telematics technology provider
Cambridge Mobile Telematics ~2–4% DriveWell SDK, smartphone telematics B2B2C platform powering 100+ insurer programs


Recent News & Developments

  • Progressive Corporation (March 2025): Progressive’s Snapshot program continues to integrate with select OEM connected-vehicle data, allowing eligible customers to bypass plug-in devices.


  • European Commission (September 2024): The EU Data Act (2023/2854) establishes rights for users to access and share data generated by their connected vehicles with third parties.


Usage Based Insurance Market Report Scope

Parameter Detail
Market Scope Global usage-based insurance market — premium value across PAYD, PHYD, MHYD programs
Study Period 2021–2035
CAGR (Forecast) 13.5% (2026–2035)
Market Size — Base Year (2025) USD 32.58 billion
Market Size — Forecast Endpoint (2035) USD 116.68 billion
Fastest Growing Segment MHYD by package (14.1% CAGR); Smartphone-based by technology (15.2% CAGR)
Companies Profiled 10 (Progressive, Allstate, Liberty Mutual, Nationwide, State Farm, Zurich, AXA, Allianz, Octo Telematics, Cambridge Mobile Telematics)
Valuation Currency USD billion


FAQs

How does 5G connectivity change risk-scoring accuracy in the usage-based insurance market?

5G reduces telematics data latency to under 10 milliseconds, enabling near-instantaneous trip scoring and hazard detection [6]. This precision allows carriers in the usage-based insurance market to differentiate risk at the maneuver level rather than the trip level.

What integration challenges do mid-size carriers face when entering the usage-based insurance market?

Mid-size carriers typically lack in-house data engineering teams, forcing reliance on third-party telematics platforms that charge 8–12% of program premium as fees [20]. Choosing between white-label solutions and co-branded partnerships shapes both margins and customer ownership.

How does the usage-based insurance market address adverse selection risks?

Carriers mitigate adverse selection by offering initial enrollment discounts that attract both safe and risky drivers, then adjusting rates after a 90-day data-collection period [16]. This phased approach builds a balanced risk pool before behavior-based segmentation takes effect.

What role do reinsurers play in scaling usage-based insurance market programs?

Reinsurers provide capacity through variable-rate treaties linking ceding commissions to verified telematics loss ratios [11]. This structure transfers program-scaling risk and incentivizes primary carriers to invest in data quality.

How do usage-based insurance market products handle data from multi-driver households?

Most programs assign a primary device or app profile per named driver, using time-of-day and route-pattern algorithms to disaggregate trips [10]. Accurate driver attribution remains an active area of technology development.

What claims-handling advantages does the usage-based insurance market provide?

Telematics-equipped policies reconstruct crash dynamics using accelerometer and GPS data, reducing fraud investigation timelines by an estimated 35% [3]. First-notice-of-loss automation also cuts average settlement cycles from weeks to days.

How might autonomous-vehicle adoption reshape the usage-based insurance market over the next decade?

Liability is expected to shift from drivers to OEMs and software providers as Level 4 autonomy scales [12]. Carriers in the usage-based insurance market will likely evolve toward hybrid policies covering both human and machine driving segments.    
Author
Author
Author Profile
Apoorva Priyadarshi LinkedIn
Research Analyst
With 4+ years of experience in Market Intelligence and Strategic Research, Apoorv specializes in ICT, Semiconductor, and BFSI markets. Combining strong analytical capabilities with a deep understanding of technology-driven industries, he focuses on delivering data-driven insights that support strategic decision-making. With a background in technology and business research, Apoorv has contributed to numerous global market studies, competitive landscape analyses, and opportunity assessments across sectors such as semiconductors, digital banking, cybersecurity, and telecommunications.
Co-Author
Co-Author Profile
Garvit Vyas LinkedIn
Vice President - Operations
Garvit Vyas is a Research Analyst with experience in working across multiple industry domains in the market research sector. Over the past four years, he has been actively involved in analyzing diverse markets, gathering industry insights, and contributing to the development of comprehensive research reports. His work includes studying market trends, evaluating competitive landscapes, and supporting data-driven business insights. In the early phase of his career, Garvit worked on cross-domain research projects, which helped him build a strong foundation in market analysis, data interpretation, and industry intelligence across various sectors. Later, he transitioned into the Quality Control (QC) function, where he focuses on reviewing and refining research reports and marketing collaterals to ensure accuracy, consistency, and high editorial standards. His responsibilities include validating research data, improving report structure, and maintaining the overall quality of published content. Garvit is committed to maintaining strong research integrity and delivering reliable insights that support informed business decision-making.

Research Approach


Secondary Research

The secondary research process involved comprehensive analysis of regulatory databases, industry publications, insurance regulatory filings, and authoritative transportation and insurance organizations. Key sources included the National Association of Insurance Commissioners (NAIC), European Insurance and Occupational Pensions Authority (EIOPA), Insurance Information Institute (III), National Highway Traffic Safety Administration (NHTSA), Federal Communications Commission (FCC) telematics regulations, European Automobile Manufacturers' Association (ACEA), International Association of Insurance Supervisors (IAIS), Organisation for Economic Co-operation and Development (OECD) Transport Division, World Bank Global Road Safety Facility, International Transport Forum (ITF), national motor vehicle registries from key markets, and telematics industry associations including the Connected Vehicle Systems Alliance (COVESA). These sources were used to collect vehicle registration statistics, telematics adoption rates, regulatory compliance frameworks, pricing model validations, and competitive landscape analysis for Pay-As-You-Drive (PAYD), Mileage-Based Insurance, Behaviour-Based Insurance (BBI), and smartphone telematics technologies.


Primary Research

In order to gather both qualitative and quantitative insights, supply-side and demand-side stakeholders were interviewed during the primary research process. CEOs, VPs of Product Innovation, heads of telematics platforms, and commercial directors from UBI providers, car insurers, telematics device manufacturers, and automakers were examples of supply-side sources. Chief underwriting officers, fleet managers, F&I directors of auto dealerships, and procurement leads from ride-sharing services, commercial fleet operators, and automotive finance organizations were examples of demand-side sources. Primary research verified telematics technology deployment schedules, validated market segmentation across vehicle types (passenger cars, commercial vehicles, and two-wheelers), and obtained information on consumer adoption trends, premium pricing tactics, and data privacy compliance dynamics.

Primary Respondent Breakdown:

By Designation: C-level Primaries (32%), Director Level (31%), Others (37%)

By Region: North America (32%), Europe (30%), Asia-Pacific (28%), Rest of World (10%)


Market Size Estimation

Global market valuation was derived through premium revenue mapping and policy volume analysis. The methodology included:

Identification of 50+ key insurers and telematics providers across North America, Europe, Asia-Pacific, and Latin America

Product mapping across PAYD, mileage-based, behavior-based insurance, and ride-sharing coverage models

Analysis of reported and modeled annual premiums specific to UBI portfolios

Coverage of providers representing 75-80% of global market share in 2024

Extrapolation using bottom-up (policy volume × average premium by country) and top-down (insurer revenue validation) approaches to derive segment-specific valuations across data sources including OBD, smartphone telematics, and embedded vehicle systems

Download Free Sample

Kindly complete the form below to receive a free sample of this Report

Download PDF ×

We do not share your information with anyone. However, we may send you emails based on your report interest from time to time. You may contact us at any time to opt-out.