SEGMENTATION QUICK REFERENCE
| Dimension | Sub-Segments | Dominant Segment | Fastest Growing Segment |
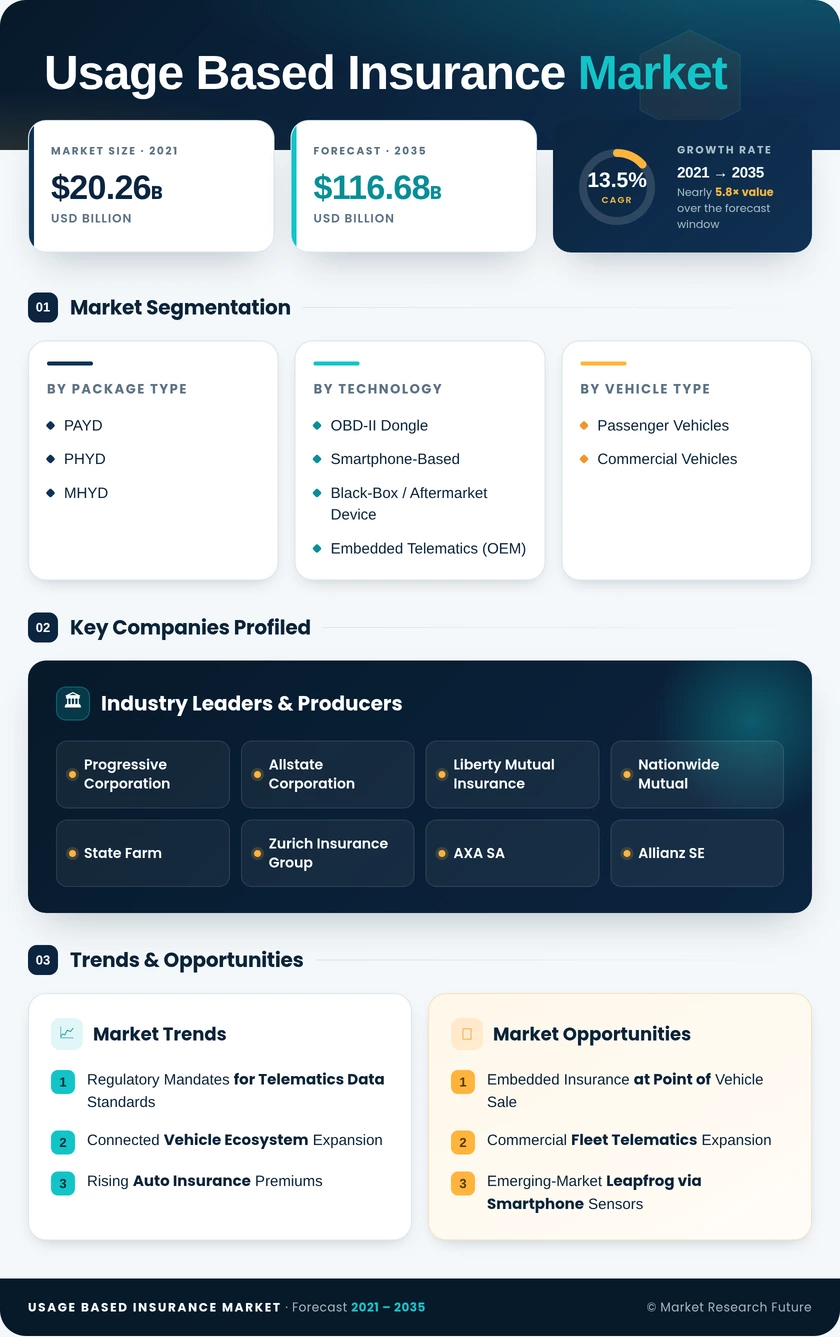
| Package Type | PAYD, PHYD, MHYD | Pay-As-You-Drive (PAYD) | Manage-How-You-Drive (MHYD) |
| Technology | OBD-II Dongle, Smartphone-Based, Black-Box / Aftermarket Device, Embedded Telematics (OEM) | OBD-II Dongle | Smartphone-Based |
| Vehicle Type | Passenger Vehicles, Commercial Vehicles | Passenger Vehicles | Commercial Vehicles |
| Geography | North America, Europe, Asia-Pacific, South America, Middle East & Africa | Europe | Asia-Pacific |
MARKET SEGMENTATION OVERVIEW
By Package Type
| Sub-Segment | Key Trend |
| Pay-As-You-Drive (PAYD) | Expanding among low-mileage drivers and urban commuters shifting to hybrid mobility |
| Pay-How-You-Drive (PHYD) | Behavior-linked discount tiers deepening consumer engagement and loyalty |
| Manage-How-You-Drive (MHYD) | Fleet-management coaching and gamification are driving the fastest adoption trajectory. |
PAYD programs dominate premium volume by converting per-mile pricing into tangible savings for infrequent drivers, while PHYD reinforces safe-driving habits through real-time feedback loops. MHYD is emerging as the fastest-growing package as fleet operators and employer-sponsored programs leverage telematics data for active risk management rather than passive pricing alone.
By Technology
| Sub-Segment | Key Trend |
| OBD-II Dongle | Remains the aftermarket standard with the broadest vehicle compatibility |
| Smartphone-Based | Rapid growth in emerging markets, where hardware distribution is impractical |
| Black-Box / Aftermarket Device | Sustained by regulatory mandates in markets like Italy |
| Embedded Telematics (OEM) | Gaining share as connected-vehicle penetration rises among new models |
OBD-II dongles retain their leadership position due to backward compatibility across two decades of vehicle production. However, their share will gradually cede ground to OEM-embedded systems as fleet turnover accelerates. Smartphone-based technology is the primary enabler of emerging-market expansion, offering insurers a zero-hardware entry pathway.
By Vehicle Type
| Sub-Segment | Key Trend |
| Passenger Vehicles | Volume leader driven by personal-lines motor insurance scale |
| Commercial Vehicles | Higher per-policy premiums and fleet-level procurement are accelerating growth. |
Passenger vehicles account for the bulk of policies, reflecting the global personal auto insurance base. Commercial vehicles command premium attention from carriers due to higher per-unit revenue and the dual value proposition of risk reduction alongside operational efficiency improvement through telematics-enabled fleet management.
By Geography
| Sub-Segment | Key Trend |
| North America | Competitive carrier landscape and premium inflation are driving consumer adoption. |
| Europe | Regulatory data-access mandates are establishing the most mature telematics environment. |
| Asia-Pacific | Massive vehicle population and digital infrastructure build-out are fueling the fastest growth. |
| South America | Insurtech-led innovation targeting fleet and ride-hailing segments |
| Middle East & Africa | Smart-city and fleet-digitization agendas are creating new adoption corridors. |
Europe holds the largest regional share supported by pioneering regulation and established telematics ecosystems. At the same time, Asia-Pacific posts the highest growth rate as smartphone-based products unlock previously uninsured vehicle populations. North America's competitive insurer landscape ensures continuous product innovation and consumer choice.