

US Food, Beverages & Nutrition Market Segmentation
Food, Beverages & Nutrition By Payload Type (USD Billion, 2025-2035)
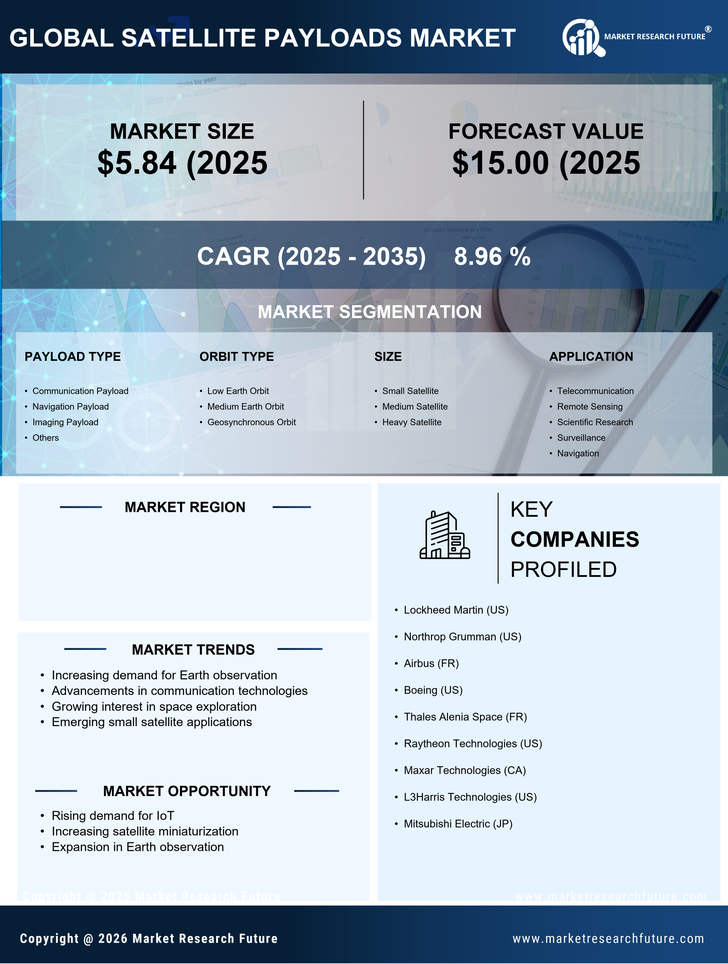
- Communication Payload
- Navigation Payload
- Imaging Payload
- Others
Food, Beverages & Nutrition By Orbit Type (USD Billion, 2025-2035)
- Low Earth Orbit
- Medium Earth Orbit
- Geosynchronous Orbit
Food, Beverages & Nutrition By Size (USD Billion, 2025-2035)
- Small Satellite
- Medium Satellite
- Heavy Satellite
Food, Beverages & Nutrition By Application (USD Billion, 2025-2035)
- Telecommunication
- Remote Sensing
- Scientific Research
- Surveillance
- Navigation


