Request Free Sample ×

Kindly complete the form below to receive a free sample of this Report

* Please use a valid business email

Leading companies partner with us for data-driven Insights

clients tt-cursor
Hero Background

US Pipeline Process Services Market

ID: MRFR/EnP/13516-HCR
100 Pages
Garvit Vyas
Last Updated: April 06, 2026

US Pipeline Process Services Market Research Report By Service Type (Pipeline Inspection Services, Pipeline Testing Services, Pipeline Maintenance Services, Pipeline Construction Services, Process Services), By End Use Industry (Oil and Gas, Chemical, Water and Wastewater, Power Generation, Food and Beverage), By Pipeline Material (Steel, Plastic, Copper, Composite, Concrete) and By Application (Transport, Storage, Distribution) - Forecast to 2035

Share:
Download PDF ×

We do not share your information with anyone. However, we may send you emails based on your report interest from time to time. You may contact us at any time to opt-out.

US Pipeline Process Services Market Infographic
Purchase Options
  1. 1 SECTION I: EXECUTIVE SUMMARY AND KEY HIGHLIGHTS
    1. 1.1 EXECUTIVE SUMMARY
      1. 1.1.1 Market Overview
      2. 1.1.2 Key Findings
      3. 1.1.3 Market Segmentation
      4. 1.1.4 Competitive Landscape
      5. 1.1.5 Challenges and Opportunities
      6. 1.1.6 Future Outlook
  2. 2 SECTION II: SCOPING, METHODOLOGY AND MARKET STRUCTURE
    1. 2.1 MARKET INTRODUCTION
      1. 2.1.1 Definition
      2. 2.1.2 Scope of the study
        1. 2.1.2.1 Research Objective
        2. 2.1.2.2 Assumption
        3. 2.1.2.3 Limitations
    2. 2.2 RESEARCH METHODOLOGY
      1. 2.2.1 Overview
      2. 2.2.2 Data Mining
      3. 2.2.3 Secondary Research
      4. 2.2.4 Primary Research
        1. 2.2.4.1 Primary Interviews and Information Gathering Process
        2. 2.2.4.2 Breakdown of Primary Respondents
      5. 2.2.5 Forecasting Model
      6. 2.2.6 Market Size Estimation
        1. 2.2.6.1 Bottom-Up Approach
        2. 2.2.6.2 Top-Down Approach
      7. 2.2.7 Data Triangulation
      8. 2.2.8 Validation
  3. 3 SECTION III: QUALITATIVE ANALYSIS
    1. 3.1 MARKET DYNAMICS
      1. 3.1.1 Overview
      2. 3.1.2 Drivers
      3. 3.1.3 Restraints
      4. 3.1.4 Opportunities
    2. 3.2 MARKET FACTOR ANALYSIS
      1. 3.2.1 Value chain Analysis
      2. 3.2.2 Porter's Five Forces Analysis
        1. 3.2.2.1 Bargaining Power of Suppliers
        2. 3.2.2.2 Bargaining Power of Buyers
        3. 3.2.2.3 Threat of New Entrants
        4. 3.2.2.4 Threat of Substitutes
        5. 3.2.2.5 Intensity of Rivalry
      3. 3.2.3 COVID-19 Impact Analysis
        1. 3.2.3.1 Market Impact Analysis
        2. 3.2.3.2 Regional Impact
        3. 3.2.3.3 Opportunity and Threat Analysis
  4. 4 SECTION IV: QUANTITATIVE ANALYSIS
    1. 4.1 Medical Device, BY Service Type (USD Million)
      1. 4.1.1 Pipeline Inspection Services
      2. 4.1.2 Pipeline Testing Services
      3. 4.1.3 Pipeline Maintenance Services
      4. 4.1.4 Pipeline Construction Services
      5. 4.1.5 Process Services
    2. 4.2 Medical Device, BY End Use Industry (USD Million)
      1. 4.2.1 Oil and Gas
      2. 4.2.2 Chemical
      3. 4.2.3 Water and Wastewater
      4. 4.2.4 Power Generation
      5. 4.2.5 Food and Beverage
    3. 4.3 Medical Device, BY Pipeline Material (USD Million)
      1. 4.3.1 Steel
      2. 4.3.2 Plastic
      3. 4.3.3 Copper
      4. 4.3.4 Composite
      5. 4.3.5 Concrete
    4. 4.4 Medical Device, BY Application (USD Million)
      1. 4.4.1 Transport
      2. 4.4.2 Storage
      3. 4.4.3 Distribution
  5. 5 SECTION V: COMPETITIVE ANALYSIS
    1. 5.1 Competitive Landscape
      1. 5.1.1 Overview
      2. 5.1.2 Competitive Analysis
      3. 5.1.3 Market share Analysis
      4. 5.1.4 Major Growth Strategy in the Medical Device
      5. 5.1.5 Competitive Benchmarking
      6. 5.1.6 Leading Players in Terms of Number of Developments in the Medical Device
      7. 5.1.7 Key developments and growth strategies
        1. 5.1.7.1 New Product Launch/Service Deployment
        2. 5.1.7.2 Merger & Acquisitions
        3. 5.1.7.3 Joint Ventures
      8. 5.1.8 Major Players Financial Matrix
        1. 5.1.8.1 Sales and Operating Income
        2. 5.1.8.2 Major Players R&D Expenditure. 2023
    2. 5.2 Company Profiles
      1. 5.2.1 Baker Hughes (US)
        1. 5.2.1.1 Financial Overview
        2. 5.2.1.2 Products Offered
        3. 5.2.1.3 Key Developments
        4. 5.2.1.4 SWOT Analysis
        5. 5.2.1.5 Key Strategies
      2. 5.2.2 Schlumberger (US)
        1. 5.2.2.1 Financial Overview
        2. 5.2.2.2 Products Offered
        3. 5.2.2.3 Key Developments
        4. 5.2.2.4 SWOT Analysis
        5. 5.2.2.5 Key Strategies
      3. 5.2.3 Halliburton (US)
        1. 5.2.3.1 Financial Overview
        2. 5.2.3.2 Products Offered
        3. 5.2.3.3 Key Developments
        4. 5.2.3.4 SWOT Analysis
        5. 5.2.3.5 Key Strategies
      4. 5.2.4 TechnipFMC (GB)
        1. 5.2.4.1 Financial Overview
        2. 5.2.4.2 Products Offered
        3. 5.2.4.3 Key Developments
        4. 5.2.4.4 SWOT Analysis
        5. 5.2.4.5 Key Strategies
      5. 5.2.5 Saipem (IT)
        1. 5.2.5.1 Financial Overview
        2. 5.2.5.2 Products Offered
        3. 5.2.5.3 Key Developments
        4. 5.2.5.4 SWOT Analysis
        5. 5.2.5.5 Key Strategies
      6. 5.2.6 KBR (US)
        1. 5.2.6.1 Financial Overview
        2. 5.2.6.2 Products Offered
        3. 5.2.6.3 Key Developments
        4. 5.2.6.4 SWOT Analysis
        5. 5.2.6.5 Key Strategies
      7. 5.2.7 Fluor Corporation (US)
        1. 5.2.7.1 Financial Overview
        2. 5.2.7.2 Products Offered
        3. 5.2.7.3 Key Developments
        4. 5.2.7.4 SWOT Analysis
        5. 5.2.7.5 Key Strategies
      8. 5.2.8 Wood Group (GB)
        1. 5.2.8.1 Financial Overview
        2. 5.2.8.2 Products Offered
        3. 5.2.8.3 Key Developments
        4. 5.2.8.4 SWOT Analysis
        5. 5.2.8.5 Key Strategies
      9. 5.2.9 McDermott International (US)
        1. 5.2.9.1 Financial Overview
        2. 5.2.9.2 Products Offered
        3. 5.2.9.3 Key Developments
        4. 5.2.9.4 SWOT Analysis
        5. 5.2.9.5 Key Strategies
    3. 5.3 Appendix
      1. 5.3.1 References
      2. 5.3.2 Related Reports
  6. 6 LIST OF FIGURES
    1. 6.1 MARKET SYNOPSIS
    2. 6.2 US MARKET ANALYSIS BY SERVICE TYPE
    3. 6.3 US MARKET ANALYSIS BY END USE INDUSTRY
    4. 6.4 US MARKET ANALYSIS BY PIPELINE MATERIAL
    5. 6.5 US MARKET ANALYSIS BY APPLICATION
    6. 6.6 KEY BUYING CRITERIA OF MEDICAL DEVICE
    7. 6.7 RESEARCH PROCESS OF MRFR
    8. 6.8 DRO ANALYSIS OF MEDICAL DEVICE
    9. 6.9 DRIVERS IMPACT ANALYSIS: MEDICAL DEVICE
    10. 6.10 RESTRAINTS IMPACT ANALYSIS: MEDICAL DEVICE
    11. 6.11 SUPPLY / VALUE CHAIN: MEDICAL DEVICE
    12. 6.12 MEDICAL DEVICE, BY SERVICE TYPE, 2024 (% SHARE)
    13. 6.13 MEDICAL DEVICE, BY SERVICE TYPE, 2024 TO 2035 (USD Million)
    14. 6.14 MEDICAL DEVICE, BY END USE INDUSTRY, 2024 (% SHARE)
    15. 6.15 MEDICAL DEVICE, BY END USE INDUSTRY, 2024 TO 2035 (USD Million)
    16. 6.16 MEDICAL DEVICE, BY PIPELINE MATERIAL, 2024 (% SHARE)
    17. 6.17 MEDICAL DEVICE, BY PIPELINE MATERIAL, 2024 TO 2035 (USD Million)
    18. 6.18 MEDICAL DEVICE, BY APPLICATION, 2024 (% SHARE)
    19. 6.19 MEDICAL DEVICE, BY APPLICATION, 2024 TO 2035 (USD Million)
    20. 6.20 BENCHMARKING OF MAJOR COMPETITORS
  7. 7 LIST OF TABLES
    1. 7.1 LIST OF ASSUMPTIONS
  8. 7.1.1
    1. 7.2 US MARKET SIZE ESTIMATES; FORECAST
      1. 7.2.1 BY SERVICE TYPE, 2025-2035 (USD Million)
      2. 7.2.2 BY END USE INDUSTRY, 2025-2035 (USD Million)
      3. 7.2.3 BY PIPELINE MATERIAL, 2025-2035 (USD Million)
      4. 7.2.4 BY APPLICATION, 2025-2035 (USD Million)
    2. 7.3 PRODUCT LAUNCH/PRODUCT DEVELOPMENT/APPROVAL
  9. 7.3.1
    1. 7.4 ACQUISITION/PARTNERSHIP
  10. 7.4.1

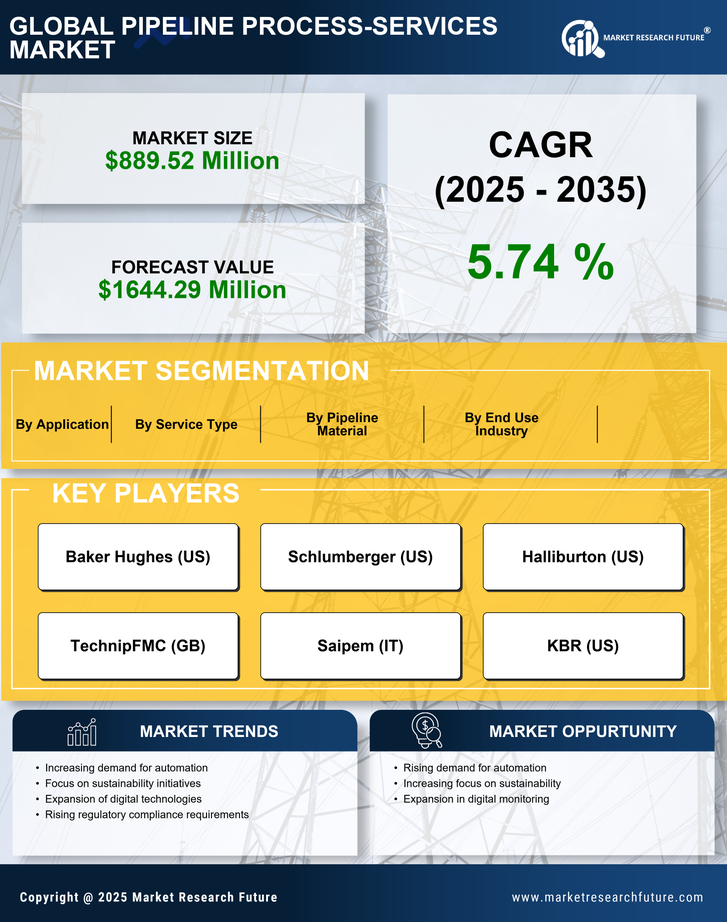
US Medical Device Market Segmentation

Medical Device By Service Type (USD Million, 2025-2035)

  • Pipeline Inspection Services
  • Pipeline Testing Services
  • Pipeline Maintenance Services
  • Pipeline Construction Services
  • Process Services

Medical Device By End Use Industry (USD Million, 2025-2035)

  • Oil and Gas
  • Chemical
  • Water and Wastewater
  • Power Generation
  • Food and Beverage

Medical Device By Pipeline Material (USD Million, 2025-2035)

  • Steel
  • Plastic
  • Copper
  • Composite
  • Concrete

Medical Device By Application (USD Million, 2025-2035)

  • Transport
  • Storage
  • Distribution

Compare Licence

×
Features License Type
Single User Multiuser License Enterprise User
Price $4,950 $5,950 $7,250
Maximum User Access Limit 1 User Upto 10 Users Unrestricted Access Throughout the Organization
Free Customization
Direct Access to Analyst
Deliverable Format
Platform Access
Discount on Next Purchase 10% 15% 15%
Printable Versions