Request Free Sample ×

Kindly complete the form below to receive a free sample of this Report

* Please use a valid business email

Leading companies partner with us for data-driven Insights

clients tt-cursor
Hero Background

US DC DC Converter Market

ID: MRFR/SEM/18227-HCR
100 Pages
Ankit Gupta
Last Updated: April 06, 2026

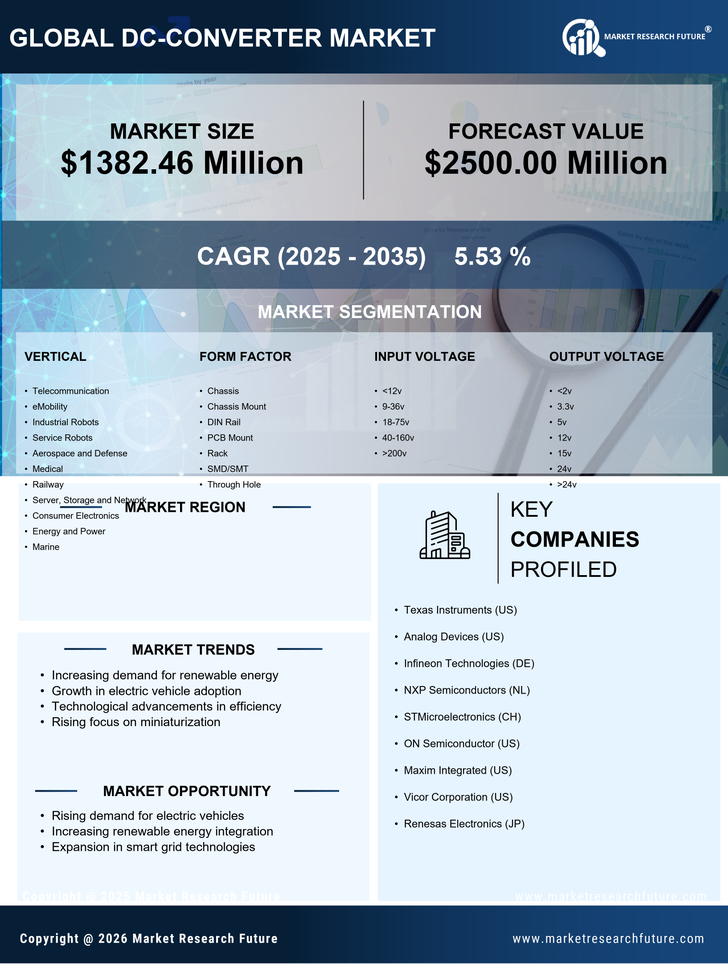
US DC-DC Converter Market Size, Share and Research Report: By Vertical (Telecommunication, eMobility, Industrial Robots, Service Robots, Aerospace and Defense, Medical, Railway, Server, Storage and Network, Consumer Electronics, Energy and Power, Marine), By Form Factor (Chassis, Chassis Mount, DIN Rail, PCB Mount, Rack, SMD/SMT, Through Hole), By Input Voltage (12v, 9-36v, 18-75v, 40-160v, >200v), By Output Voltage (2v, 3v, 5v, 12v, 15v, 24v, >24v), By Output Power (0-100W, 101-250W, 251W-500W, 500-1000W, >1000W), By Output Number (Single, Dual, Triple, Multiple), By Product Type (Isolated DC-DC Converter, Non-Isolated DC-DC Converter) and By Isolation Working Voltage (50-150V, 150-250V, 200-1000V, 1000-2500V, >2500V) - Industry Forecast Till 2035

Share:
Download PDF ×

We do not share your information with anyone. However, we may send you emails based on your report interest from time to time. You may contact us at any time to opt-out.

US DC DC Converter Market Infographic
Purchase Options
  1. 1 SECTION I: EXECUTIVE SUMMARY AND KEY HIGHLIGHTS
    1. 1.1 EXECUTIVE SUMMARY
      1. 1.1.1 Market Overview
      2. 1.1.2 Key Findings
      3. 1.1.3 Market Segmentation
      4. 1.1.4 Competitive Landscape
      5. 1.1.5 Challenges and Opportunities
      6. 1.1.6 Future Outlook
  2. 2 SECTION II: SCOPING, METHODOLOGY AND MARKET STRUCTURE
    1. 2.1 MARKET INTRODUCTION
      1. 2.1.1 Definition
      2. 2.1.2 Scope of the study
        1. 2.1.2.1 Research Objective
        2. 2.1.2.2 Assumption
        3. 2.1.2.3 Limitations
    2. 2.2 RESEARCH METHODOLOGY
      1. 2.2.1 Overview
      2. 2.2.2 Data Mining
      3. 2.2.3 Secondary Research
      4. 2.2.4 Primary Research
        1. 2.2.4.1 Primary Interviews and Information Gathering Process
        2. 2.2.4.2 Breakdown of Primary Respondents
      5. 2.2.5 Forecasting Model
      6. 2.2.6 Market Size Estimation
        1. 2.2.6.1 Bottom-Up Approach
        2. 2.2.6.2 Top-Down Approach
      7. 2.2.7 Data Triangulation
      8. 2.2.8 Validation
  3. 3 SECTION III: QUALITATIVE ANALYSIS
    1. 3.1 MARKET DYNAMICS
      1. 3.1.1 Overview
      2. 3.1.2 Drivers
      3. 3.1.3 Restraints
      4. 3.1.4 Opportunities
    2. 3.2 MARKET FACTOR ANALYSIS
      1. 3.2.1 Value chain Analysis
      2. 3.2.2 Porter's Five Forces Analysis
        1. 3.2.2.1 Bargaining Power of Suppliers
        2. 3.2.2.2 Bargaining Power of Buyers
        3. 3.2.2.3 Threat of New Entrants
        4. 3.2.2.4 Threat of Substitutes
        5. 3.2.2.5 Intensity of Rivalry
      3. 3.2.3 COVID-19 Impact Analysis
        1. 3.2.3.1 Market Impact Analysis
        2. 3.2.3.2 Regional Impact
        3. 3.2.3.3 Opportunity and Threat Analysis
  4. 4 SECTION IV: QUANTITATIVE ANALYSIS
    1. 4.1 Semiconductor & Electronics, BY Vertical (USD Million)
      1. 4.1.1 Telecommunication
      2. 4.1.2 eMobility
      3. 4.1.3 Industrial Robots
      4. 4.1.4 Service Robots
      5. 4.1.5 Aerospace and Defense
      6. 4.1.6 Medical
      7. 4.1.7 Railway
      8. 4.1.8 Server, Storage and Network
      9. 4.1.9 Consumer Electronics
      10. 4.1.10 Energy and Power
      11. 4.1.11 Marine
    2. 4.2 Semiconductor & Electronics, BY Form Factor (USD Million)
      1. 4.2.1 Chassis
      2. 4.2.2 Chassis Mount
      3. 4.2.3 DIN Rail
      4. 4.2.4 PCB Mount
      5. 4.2.5 Rack
      6. 4.2.6 SMD/SMT
      7. 4.2.7 Through Hole
    3. 4.3 Semiconductor & Electronics, BY Input Voltage (USD Million)
      1. 4.3.1 200v
    4. 4.4 Semiconductor & Electronics, BY Output Voltage (USD Million)
      1. 4.4.1 24v
    5. 4.5 Semiconductor & Electronics, BY Output Power (USD Million)
      1. 4.5.1 0-100W
      2. 4.5.2 101-250W
      3. 4.5.3 251W-500W
      4. 4.5.4 500-1000W
      5. 4.5.5 >1000W
    6. 4.6 Semiconductor & Electronics, BY Output Number (USD Million)
      1. 4.6.1 Single
      2. 4.6.2 Dual
      3. 4.6.3 Triple
      4. 4.6.4 Multiple
    7. 4.7 Semiconductor & Electronics, BY Product Type (USD Million)
      1. 4.7.1 Isolated DC-DC Converter
      2. 4.7.2 Non-Isolated DC-DC Converter
    8. 4.8 Semiconductor & Electronics, BY Isolation Working Voltage (USD Million)
      1. 4.8.1 50-150V
      2. 4.8.2 150-250V
      3. 4.8.3 200-1000V
      4. 4.8.4 1000-2500V
      5. 4.8.5 >2500V
  5. 5 SECTION V: COMPETITIVE ANALYSIS
    1. 5.1 Competitive Landscape
      1. 5.1.1 Overview
      2. 5.1.2 Competitive Analysis
      3. 5.1.3 Market share Analysis
      4. 5.1.4 Major Growth Strategy in the Semiconductor & Electronics
      5. 5.1.5 Competitive Benchmarking
      6. 5.1.6 Leading Players in Terms of Number of Developments in the Semiconductor & Electronics
      7. 5.1.7 Key developments and growth strategies
        1. 5.1.7.1 New Product Launch/Service Deployment
        2. 5.1.7.2 Merger & Acquisitions
        3. 5.1.7.3 Joint Ventures
      8. 5.1.8 Major Players Financial Matrix
        1. 5.1.8.1 Sales and Operating Income
        2. 5.1.8.2 Major Players R&D Expenditure. 2023
    2. 5.2 Company Profiles
      1. 5.2.1 Texas Instruments (US)
        1. 5.2.1.1 Financial Overview
        2. 5.2.1.2 Products Offered
        3. 5.2.1.3 Key Developments
        4. 5.2.1.4 SWOT Analysis
        5. 5.2.1.5 Key Strategies
      2. 5.2.2 Analog Devices (US)
        1. 5.2.2.1 Financial Overview
        2. 5.2.2.2 Products Offered
        3. 5.2.2.3 Key Developments
        4. 5.2.2.4 SWOT Analysis
        5. 5.2.2.5 Key Strategies
      3. 5.2.3 Infineon Technologies (DE)
        1. 5.2.3.1 Financial Overview
        2. 5.2.3.2 Products Offered
        3. 5.2.3.3 Key Developments
        4. 5.2.3.4 SWOT Analysis
        5. 5.2.3.5 Key Strategies
      4. 5.2.4 NXP Semiconductors (NL)
        1. 5.2.4.1 Financial Overview
        2. 5.2.4.2 Products Offered
        3. 5.2.4.3 Key Developments
        4. 5.2.4.4 SWOT Analysis
        5. 5.2.4.5 Key Strategies
      5. 5.2.5 STMicroelectronics (CH)
        1. 5.2.5.1 Financial Overview
        2. 5.2.5.2 Products Offered
        3. 5.2.5.3 Key Developments
        4. 5.2.5.4 SWOT Analysis
        5. 5.2.5.5 Key Strategies
      6. 5.2.6 ON Semiconductor (US)
        1. 5.2.6.1 Financial Overview
        2. 5.2.6.2 Products Offered
        3. 5.2.6.3 Key Developments
        4. 5.2.6.4 SWOT Analysis
        5. 5.2.6.5 Key Strategies
      7. 5.2.7 Maxim Integrated (US)
        1. 5.2.7.1 Financial Overview
        2. 5.2.7.2 Products Offered
        3. 5.2.7.3 Key Developments
        4. 5.2.7.4 SWOT Analysis
        5. 5.2.7.5 Key Strategies
      8. 5.2.8 Vicor Corporation (US)
        1. 5.2.8.1 Financial Overview
        2. 5.2.8.2 Products Offered
        3. 5.2.8.3 Key Developments
        4. 5.2.8.4 SWOT Analysis
        5. 5.2.8.5 Key Strategies
      9. 5.2.9 Renesas Electronics (JP)
        1. 5.2.9.1 Financial Overview
        2. 5.2.9.2 Products Offered
        3. 5.2.9.3 Key Developments
        4. 5.2.9.4 SWOT Analysis
        5. 5.2.9.5 Key Strategies
    3. 5.3 Appendix
      1. 5.3.1 References
      2. 5.3.2 Related Reports
  6. 6 LIST OF FIGURES
    1. 6.1 MARKET SYNOPSIS
    2. 6.2 US MARKET ANALYSIS BY VERTICAL
    3. 6.3 US MARKET ANALYSIS BY FORM FACTOR
    4. 6.4 US MARKET ANALYSIS BY INPUT VOLTAGE
    5. 6.5 US MARKET ANALYSIS BY OUTPUT VOLTAGE
    6. 6.6 US MARKET ANALYSIS BY OUTPUT POWER
    7. 6.7 US MARKET ANALYSIS BY OUTPUT NUMBER
    8. 6.8 US MARKET ANALYSIS BY PRODUCT TYPE
    9. 6.9 US MARKET ANALYSIS BY ISOLATION WORKING VOLTAGE
    10. 6.10 KEY BUYING CRITERIA OF SEMICONDUCTOR & ELECTRONICS
    11. 6.11 RESEARCH PROCESS OF MRFR
    12. 6.12 DRO ANALYSIS OF SEMICONDUCTOR & ELECTRONICS
    13. 6.13 DRIVERS IMPACT ANALYSIS: SEMICONDUCTOR & ELECTRONICS
    14. 6.14 RESTRAINTS IMPACT ANALYSIS: SEMICONDUCTOR & ELECTRONICS
    15. 6.15 SUPPLY / VALUE CHAIN: SEMICONDUCTOR & ELECTRONICS
    16. 6.16 SEMICONDUCTOR & ELECTRONICS, BY VERTICAL, 2024 (% SHARE)
    17. 6.17 SEMICONDUCTOR & ELECTRONICS, BY VERTICAL, 2024 TO 2035 (USD Million)
    18. 6.18 SEMICONDUCTOR & ELECTRONICS, BY FORM FACTOR, 2024 (% SHARE)
    19. 6.19 SEMICONDUCTOR & ELECTRONICS, BY FORM FACTOR, 2024 TO 2035 (USD Million)
    20. 6.20 SEMICONDUCTOR & ELECTRONICS, BY INPUT VOLTAGE, 2024 (% SHARE)
    21. 6.21 SEMICONDUCTOR & ELECTRONICS, BY INPUT VOLTAGE, 2024 TO 2035 (USD Million)
    22. 6.22 SEMICONDUCTOR & ELECTRONICS, BY OUTPUT VOLTAGE, 2024 (% SHARE)
    23. 6.23 SEMICONDUCTOR & ELECTRONICS, BY OUTPUT VOLTAGE, 2024 TO 2035 (USD Million)
    24. 6.24 SEMICONDUCTOR & ELECTRONICS, BY OUTPUT POWER, 2024 (% SHARE)
    25. 6.25 SEMICONDUCTOR & ELECTRONICS, BY OUTPUT POWER, 2024 TO 2035 (USD Million)
    26. 6.26 SEMICONDUCTOR & ELECTRONICS, BY OUTPUT NUMBER, 2024 (% SHARE)
    27. 6.27 SEMICONDUCTOR & ELECTRONICS, BY OUTPUT NUMBER, 2024 TO 2035 (USD Million)
    28. 6.28 SEMICONDUCTOR & ELECTRONICS, BY PRODUCT TYPE, 2024 (% SHARE)
    29. 6.29 SEMICONDUCTOR & ELECTRONICS, BY PRODUCT TYPE, 2024 TO 2035 (USD Million)
    30. 6.30 SEMICONDUCTOR & ELECTRONICS, BY ISOLATION WORKING VOLTAGE, 2024 (% SHARE)
    31. 6.31 SEMICONDUCTOR & ELECTRONICS, BY ISOLATION WORKING VOLTAGE, 2024 TO 2035 (USD Million)
    32. 6.32 BENCHMARKING OF MAJOR COMPETITORS
  7. 7 LIST OF TABLES
    1. 7.1 LIST OF ASSUMPTIONS
  8. 7.1.1
    1. 7.2 US MARKET SIZE ESTIMATES; FORECAST
      1. 7.2.1 BY VERTICAL, 2025-2035 (USD Million)
      2. 7.2.2 BY FORM FACTOR, 2025-2035 (USD Million)
      3. 7.2.3 BY INPUT VOLTAGE, 2025-2035 (USD Million)
      4. 7.2.4 BY OUTPUT VOLTAGE, 2025-2035 (USD Million)
      5. 7.2.5 BY OUTPUT POWER, 2025-2035 (USD Million)
      6. 7.2.6 BY OUTPUT NUMBER, 2025-2035 (USD Million)
      7. 7.2.7 BY PRODUCT TYPE, 2025-2035 (USD Million)
      8. 7.2.8 BY ISOLATION WORKING VOLTAGE, 2025-2035 (USD Million)
    2. 7.3 PRODUCT LAUNCH/PRODUCT DEVELOPMENT/APPROVAL
  9. 7.3.1
    1. 7.4 ACQUISITION/PARTNERSHIP
  10. 7.4.1

US Semiconductor & Electronics Market Segmentation

Semiconductor & Electronics By Vertical (USD Million, 2025-2035)

  • Telecommunication
  • eMobility
  • Industrial Robots
  • Service Robots
  • Aerospace and Defense
  • Medical
  • Railway
  • Server, Storage and Network
  • Consumer Electronics
  • Energy and Power
  • Marine

Semiconductor & Electronics By Form Factor (USD Million, 2025-2035)

  • Chassis
  • Chassis Mount
  • DIN Rail
  • PCB Mount
  • Rack
  • SMD/SMT
  • Through Hole

Semiconductor & Electronics By Input Voltage (USD Million, 2025-2035)

  • <12v
  • 9-36v
  • 18-75v
  • 40-160v
  • >200v

Semiconductor & Electronics By Output Voltage (USD Million, 2025-2035)

  • <2v
  • 3.3v
  • 5v
  • 12v
  • 15v
  • 24v
  • >24v

Semiconductor & Electronics By Output Power (USD Million, 2025-2035)

  • 0-100W
  • 101-250W
  • 251W-500W
  • 500-1000W
  • >1000W

Semiconductor & Electronics By Output Number (USD Million, 2025-2035)

  • Single
  • Dual
  • Triple
  • Multiple

Semiconductor & Electronics By Product Type (USD Million, 2025-2035)

  • Isolated DC-DC Converter
  • Non-Isolated DC-DC Converter

Semiconductor & Electronics By Isolation Working Voltage (USD Million, 2025-2035)

  • 50-150V
  • 150-250V
  • 200-1000V
  • 1000-2500V
  • >2500V

Compare Licence

×
Features License Type
Single User Multiuser License Enterprise User
Price $4,950 $5,950 $7,250
Maximum User Access Limit 1 User Upto 10 Users Unrestricted Access Throughout the Organization
Free Customization
Direct Access to Analyst
Deliverable Format
Platform Access
Discount on Next Purchase 10% 15% 15%
Printable Versions