Request Free Sample ×

Kindly complete the form below to receive a free sample of this Report

* Please use a valid business email

Leading companies partner with us for data-driven Insights

clients tt-cursor
Hero Background

US Anesthesia Drugs Market

ID: MRFR/Pharma/15119-HCR
100 Pages
Satyendra Maurya
Last Updated: April 24, 2026

US Anesthesia Drugs Market Research Report: Size, Share, Trend Analysis By Drug Type (General Anesthesia, Local Anesthesia, Sedative Agents, Regional Anesthesia), By Route of Administration (Injectable, Inhalation, Topical), By End Use (Hospitals, Ambulatory Surgical Centers, Diagnostic Centers) and By Formulation (Liquid, Gas, Solid) - Growth Outlook & Industry Forecast 2025 To 2035

Share:
Download PDF ×

We do not share your information with anyone. However, we may send you emails based on your report interest from time to time. You may contact us at any time to opt-out.

  1. 1 SECTION I: EXECUTIVE SUMMARY AND KEY HIGHLIGHTS
    1. 1.1 EXECUTIVE SUMMARY
      1. 1.1.1 Market Overview
      2. 1.1.2 Key Findings
      3. 1.1.3 Market Segmentation
      4. 1.1.4 Competitive Landscape
      5. 1.1.5 Challenges and Opportunities
      6. 1.1.6 Future Outlook
  2. 2 SECTION II: SCOPING, METHODOLOGY AND MARKET STRUCTURE
    1. 2.1 MARKET INTRODUCTION
      1. 2.1.1 Definition
      2. 2.1.2 Scope of the study
        1. 2.1.2.1 Research Objective
        2. 2.1.2.2 Assumption
        3. 2.1.2.3 Limitations
    2. 2.2 RESEARCH METHODOLOGY
      1. 2.2.1 Overview
      2. 2.2.2 Data Mining
      3. 2.2.3 Secondary Research
      4. 2.2.4 Primary Research
        1. 2.2.4.1 Primary Interviews and Information Gathering Process
        2. 2.2.4.2 Breakdown of Primary Respondents
      5. 2.2.5 Forecasting Model
      6. 2.2.6 Market Size Estimation
        1. 2.2.6.1 Bottom-Up Approach
        2. 2.2.6.2 Top-Down Approach
      7. 2.2.7 Data Triangulation
      8. 2.2.8 Validation
  3. 3 SECTION III: QUALITATIVE ANALYSIS
    1. 3.1 MARKET DYNAMICS
      1. 3.1.1 Overview
      2. 3.1.2 Drivers
      3. 3.1.3 Restraints
      4. 3.1.4 Opportunities
    2. 3.2 MARKET FACTOR ANALYSIS
      1. 3.2.1 Value chain Analysis
      2. 3.2.2 Porter's Five Forces Analysis
        1. 3.2.2.1 Bargaining Power of Suppliers
        2. 3.2.2.2 Bargaining Power of Buyers
        3. 3.2.2.3 Threat of New Entrants
        4. 3.2.2.4 Threat of Substitutes
        5. 3.2.2.5 Intensity of Rivalry
      3. 3.2.3 COVID-19 Impact Analysis
        1. 3.2.3.1 Market Impact Analysis
        2. 3.2.3.2 Regional Impact
        3. 3.2.3.3 Opportunity and Threat Analysis
  4. 4 SECTION IV: QUANTITATIVE ANALYSIS
    1. 4.1 Chemicals and Materials, BY Type (USD Million)
      1. 4.1.1 General Anesthesia
      2. 4.1.2 Local Anesthesia
      3. 4.1.3 Sedative Agents
      4. 4.1.4 Regional Anesthesia
    2. 4.2 Chemicals and Materials, BY Route of Administration (USD Million)
      1. 4.2.1 Injectable
      2. 4.2.2 Inhalation
      3. 4.2.3 Topical
    3. 4.3 Chemicals and Materials, BY End-Use (USD Million)
      1. 4.3.1 Hospitals
      2. 4.3.2 Ambulatory Surgical Centers
      3. 4.3.3 Diagnostic Centers
    4. 4.4 Chemicals and Materials, BY Formulation (USD Million)
      1. 4.4.1 Liquid
      2. 4.4.2 Gas
      3. 4.4.3 Solid
  5. 5 SECTION V: COMPETITIVE ANALYSIS
    1. 5.1 Competitive Landscape
      1. 5.1.1 Overview
      2. 5.1.2 Competitive Analysis
      3. 5.1.3 Market share Analysis
      4. 5.1.4 Major Growth Strategy in the Chemicals and Materials
      5. 5.1.5 Competitive Benchmarking
      6. 5.1.6 Leading Players in Terms of Number of Developments in the Chemicals and Materials
      7. 5.1.7 Key developments and growth strategies
        1. 5.1.7.1 New Product Launch/Service Deployment
        2. 5.1.7.2 Merger & Acquisitions
        3. 5.1.7.3 Joint Ventures
      8. 5.1.8 Major Players Financial Matrix
        1. 5.1.8.1 Sales and Operating Income
        2. 5.1.8.2 Major Players R&D Expenditure. 2023
    2. 5.2 Company Profiles
      1. 5.2.1 Fresenius Kabi (DE)
        1. 5.2.1.1 Financial Overview
        2. 5.2.1.2 Products Offered
        3. 5.2.1.3 Key Developments
        4. 5.2.1.4 SWOT Analysis
        5. 5.2.1.5 Key Strategies
      2. 5.2.2 Baxter International (US)
        1. 5.2.2.1 Financial Overview
        2. 5.2.2.2 Products Offered
        3. 5.2.2.3 Key Developments
        4. 5.2.2.4 SWOT Analysis
        5. 5.2.2.5 Key Strategies
      3. 5.2.3 AbbVie (US)
        1. 5.2.3.1 Financial Overview
        2. 5.2.3.2 Products Offered
        3. 5.2.3.3 Key Developments
        4. 5.2.3.4 SWOT Analysis
        5. 5.2.3.5 Key Strategies
      4. 5.2.4 Hikma Pharmaceuticals (GB)
        1. 5.2.4.1 Financial Overview
        2. 5.2.4.2 Products Offered
        3. 5.2.4.3 Key Developments
        4. 5.2.4.4 SWOT Analysis
        5. 5.2.4.5 Key Strategies
      5. 5.2.5 Mylan (US)
        1. 5.2.5.1 Financial Overview
        2. 5.2.5.2 Products Offered
        3. 5.2.5.3 Key Developments
        4. 5.2.5.4 SWOT Analysis
        5. 5.2.5.5 Key Strategies
      6. 5.2.6 AstraZeneca (GB)
        1. 5.2.6.1 Financial Overview
        2. 5.2.6.2 Products Offered
        3. 5.2.6.3 Key Developments
        4. 5.2.6.4 SWOT Analysis
        5. 5.2.6.5 Key Strategies
      7. 5.2.7 B. Braun Melsungen (DE)
        1. 5.2.7.1 Financial Overview
        2. 5.2.7.2 Products Offered
        3. 5.2.7.3 Key Developments
        4. 5.2.7.4 SWOT Analysis
        5. 5.2.7.5 Key Strategies
      8. 5.2.8 Medtronic (US)
        1. 5.2.8.1 Financial Overview
        2. 5.2.8.2 Products Offered
        3. 5.2.8.3 Key Developments
        4. 5.2.8.4 SWOT Analysis
        5. 5.2.8.5 Key Strategies
      9. 5.2.9 Johnson & Johnson (US)
        1. 5.2.9.1 Financial Overview
        2. 5.2.9.2 Products Offered
        3. 5.2.9.3 Key Developments
        4. 5.2.9.4 SWOT Analysis
        5. 5.2.9.5 Key Strategies
      10. 5.2.10 Elekta (SE)
        1. 5.2.10.1 Financial Overview
        2. 5.2.10.2 Products Offered
        3. 5.2.10.3 Key Developments
        4. 5.2.10.4 SWOT Analysis
        5. 5.2.10.5 Key Strategies
    3. 5.3 Appendix
      1. 5.3.1 References
      2. 5.3.2 Related Reports
  6. 6 LIST OF FIGURES
    1. 6.1 MARKET SYNOPSIS
    2. 6.2 US MARKET ANALYSIS BY TYPE
    3. 6.3 US MARKET ANALYSIS BY ROUTE OF ADMINISTRATION
    4. 6.4 US MARKET ANALYSIS BY END-USE
    5. 6.5 US MARKET ANALYSIS BY FORMULATION
    6. 6.6 KEY BUYING CRITERIA OF CHEMICALS AND MATERIALS
    7. 6.7 RESEARCH PROCESS OF MRFR
    8. 6.8 DRO ANALYSIS OF CHEMICALS AND MATERIALS
    9. 6.9 DRIVERS IMPACT ANALYSIS: CHEMICALS AND MATERIALS
    10. 6.10 RESTRAINTS IMPACT ANALYSIS: CHEMICALS AND MATERIALS
    11. 6.11 SUPPLY / VALUE CHAIN: CHEMICALS AND MATERIALS
    12. 6.12 CHEMICALS AND MATERIALS, BY TYPE, 2024 (% SHARE)
    13. 6.13 CHEMICALS AND MATERIALS, BY TYPE, 2024 TO 2035 (USD Million)
    14. 6.14 CHEMICALS AND MATERIALS, BY ROUTE OF ADMINISTRATION, 2024 (% SHARE)
    15. 6.15 CHEMICALS AND MATERIALS, BY ROUTE OF ADMINISTRATION, 2024 TO 2035 (USD Million)
    16. 6.16 CHEMICALS AND MATERIALS, BY END-USE, 2024 (% SHARE)
    17. 6.17 CHEMICALS AND MATERIALS, BY END-USE, 2024 TO 2035 (USD Million)
    18. 6.18 CHEMICALS AND MATERIALS, BY FORMULATION, 2024 (% SHARE)
    19. 6.19 CHEMICALS AND MATERIALS, BY FORMULATION, 2024 TO 2035 (USD Million)
    20. 6.20 BENCHMARKING OF MAJOR COMPETITORS
  7. 7 LIST OF TABLES
    1. 7.1 LIST OF ASSUMPTIONS
  8. 7.1.1
    1. 7.2 US MARKET SIZE ESTIMATES; FORECAST
      1. 7.2.1 BY TYPE, 2025-2035 (USD Million)
      2. 7.2.2 BY ROUTE OF ADMINISTRATION, 2025-2035 (USD Million)
      3. 7.2.3 BY END-USE, 2025-2035 (USD Million)
      4. 7.2.4 BY FORMULATION, 2025-2035 (USD Million)
    2. 7.3 PRODUCT LAUNCH/PRODUCT DEVELOPMENT/APPROVAL
  9. 7.3.1
    1. 7.4 ACQUISITION/PARTNERSHIP
  10. 7.4.1

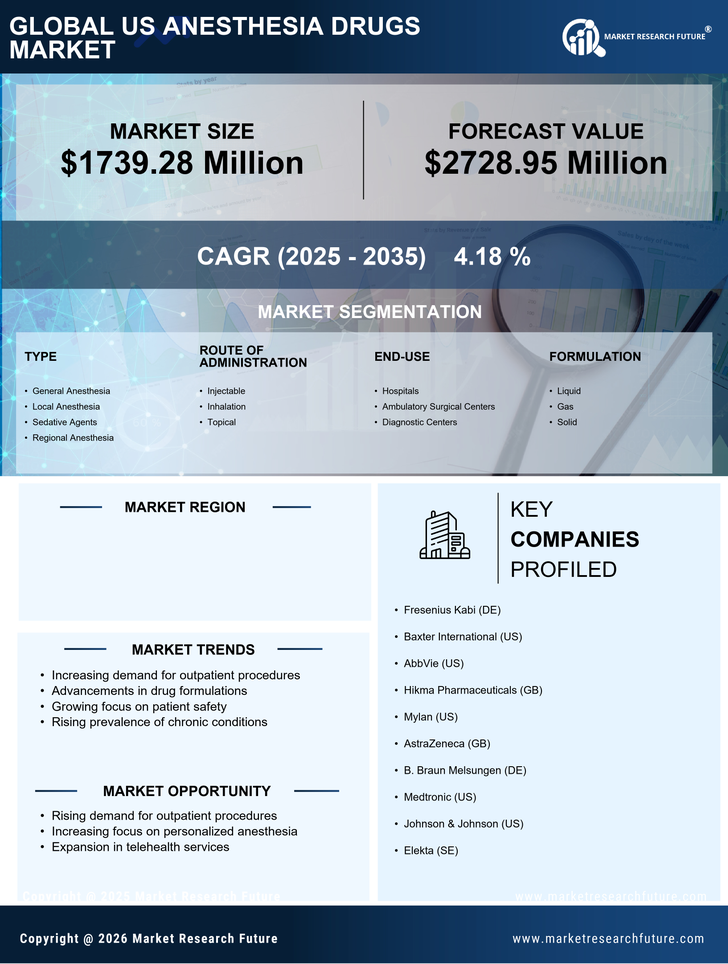
US Chemicals and Materials Market Segmentation

Chemicals and Materials By Type (USD Million, 2025-2035)

  • General Anesthesia
  • Local Anesthesia
  • Sedative Agents
  • Regional Anesthesia

Chemicals and Materials By Route of Administration (USD Million, 2025-2035)

  • Injectable
  • Inhalation
  • Topical

Chemicals and Materials By End-Use (USD Million, 2025-2035)

  • Hospitals
  • Ambulatory Surgical Centers
  • Diagnostic Centers

Chemicals and Materials By Formulation (USD Million, 2025-2035)

  • Liquid
  • Gas
  • Solid

Compare Licence

×
Features License Type
Single User Multiuser License Enterprise User
Price $4,950 $5,950 $7,250
Maximum User Access Limit 1 User Upto 10 Users Unrestricted Access Throughout the Organization
Free Customization
Direct Access to Analyst
Deliverable Format
Platform Access
Discount on Next Purchase 10% 15% 15%
Printable Versions