Request Free Sample ×

Kindly complete the form below to receive a free sample of this Report

* Please use a valid business email

Leading companies partner with us for data-driven Insights

clients tt-cursor
Hero Background

US AMOLED Display Market

ID: MRFR/SEM/12531-HCR
100 Pages
Apoorva Priyadarshi
Last Updated: April 24, 2026

US AMOLED Display Market Size, Share and Research Report By Resolution (HD, Full HD, Quad HD, Ultra HD, 8K), by Application (Smartphones, Televisions, Wearable Devices, Tablets, Laptops), by Display Type (Rigid AMOLED, Flexible AMOLED, Transparent AMOLED, Foldable AMOLED), and by Region- Industry Forecast Till 2035

Share:
Download PDF ×

We do not share your information with anyone. However, we may send you emails based on your report interest from time to time. You may contact us at any time to opt-out.

  1. 1 SECTION I: EXECUTIVE SUMMARY AND KEY HIGHLIGHTS
    1. 1.1 EXECUTIVE SUMMARY
      1. 1.1.1 Market Overview
      2. 1.1.2 Key Findings
      3. 1.1.3 Market Segmentation
      4. 1.1.4 Competitive Landscape
      5. 1.1.5 Challenges and Opportunities
      6. 1.1.6 Future Outlook
  2. 2 SECTION II: SCOPING, METHODOLOGY AND MARKET STRUCTURE
    1. 2.1 MARKET INTRODUCTION
      1. 2.1.1 Definition
      2. 2.1.2 Scope of the study
        1. 2.1.2.1 Research Objective
        2. 2.1.2.2 Assumption
        3. 2.1.2.3 Limitations
    2. 2.2 RESEARCH METHODOLOGY
      1. 2.2.1 Overview
      2. 2.2.2 Data Mining
      3. 2.2.3 Secondary Research
      4. 2.2.4 Primary Research
        1. 2.2.4.1 Primary Interviews and Information Gathering Process
        2. 2.2.4.2 Breakdown of Primary Respondents
      5. 2.2.5 Forecasting Model
      6. 2.2.6 Market Size Estimation
        1. 2.2.6.1 Bottom-Up Approach
        2. 2.2.6.2 Top-Down Approach
      7. 2.2.7 Data Triangulation
      8. 2.2.8 Validation
  3. 3 SECTION III: QUALITATIVE ANALYSIS
    1. 3.1 MARKET DYNAMICS
      1. 3.1.1 Overview
      2. 3.1.2 Drivers
      3. 3.1.3 Restraints
      4. 3.1.4 Opportunities
    2. 3.2 MARKET FACTOR ANALYSIS
      1. 3.2.1 Value chain Analysis
      2. 3.2.2 Porter's Five Forces Analysis
        1. 3.2.2.1 Bargaining Power of Suppliers
        2. 3.2.2.2 Bargaining Power of Buyers
        3. 3.2.2.3 Threat of New Entrants
        4. 3.2.2.4 Threat of Substitutes
        5. 3.2.2.5 Intensity of Rivalry
      3. 3.2.3 COVID-19 Impact Analysis
        1. 3.2.3.1 Market Impact Analysis
        2. 3.2.3.2 Regional Impact
        3. 3.2.3.3 Opportunity and Threat Analysis
  4. 4 SECTION IV: QUANTITATIVE ANALYSIS
    1. 4.1 Semiconductor & Electronics, BY Application (USD Billion)
      1. 4.1.1 Smartphones
      2. 4.1.2 Televisions
      3. 4.1.3 Wearable Devices
      4. 4.1.4 Tablets
      5. 4.1.5 Laptops
    2. 4.2 Semiconductor & Electronics, BY Display Type (USD Billion)
      1. 4.2.1 Rigid AMOLED
      2. 4.2.2 Flexible AMOLED
      3. 4.2.3 Transparent AMOLED
      4. 4.2.4 Foldable AMOLED
    3. 4.3 Semiconductor & Electronics, BY Resolution (USD Billion)
      1. 4.3.1 HD
      2. 4.3.2 Full HD
      3. 4.3.3 Quad HD
      4. 4.3.4 Ultra HD
      5. 4.3.5 8K
    4. 4.4 Semiconductor & Electronics, BY End Use (USD Billion)
      1. 4.4.1 Consumer Electronics
      2. 4.4.2 Automotive
      3. 4.4.3 Healthcare
      4. 4.4.4 Aerospace
      5. 4.4.5 Advertising
  5. 5 SECTION V: COMPETITIVE ANALYSIS
    1. 5.1 Competitive Landscape
      1. 5.1.1 Overview
      2. 5.1.2 Competitive Analysis
      3. 5.1.3 Market share Analysis
      4. 5.1.4 Major Growth Strategy in the Semiconductor & Electronics
      5. 5.1.5 Competitive Benchmarking
      6. 5.1.6 Leading Players in Terms of Number of Developments in the Semiconductor & Electronics
      7. 5.1.7 Key developments and growth strategies
        1. 5.1.7.1 New Product Launch/Service Deployment
        2. 5.1.7.2 Merger & Acquisitions
        3. 5.1.7.3 Joint Ventures
      8. 5.1.8 Major Players Financial Matrix
        1. 5.1.8.1 Sales and Operating Income
        2. 5.1.8.2 Major Players R&D Expenditure. 2023
    2. 5.2 Company Profiles
      1. 5.2.1 Samsung Electronics (KR)
        1. 5.2.1.1 Financial Overview
        2. 5.2.1.2 Products Offered
        3. 5.2.1.3 Key Developments
        4. 5.2.1.4 SWOT Analysis
        5. 5.2.1.5 Key Strategies
      2. 5.2.2 LG Display (KR)
        1. 5.2.2.1 Financial Overview
        2. 5.2.2.2 Products Offered
        3. 5.2.2.3 Key Developments
        4. 5.2.2.4 SWOT Analysis
        5. 5.2.2.5 Key Strategies
      3. 5.2.3 BOE Technology Group (CN)
        1. 5.2.3.1 Financial Overview
        2. 5.2.3.2 Products Offered
        3. 5.2.3.3 Key Developments
        4. 5.2.3.4 SWOT Analysis
        5. 5.2.3.5 Key Strategies
      4. 5.2.4 Sony Corporation (JP)
        1. 5.2.4.1 Financial Overview
        2. 5.2.4.2 Products Offered
        3. 5.2.4.3 Key Developments
        4. 5.2.4.4 SWOT Analysis
        5. 5.2.4.5 Key Strategies
      5. 5.2.5 TCL Technology (CN)
        1. 5.2.5.1 Financial Overview
        2. 5.2.5.2 Products Offered
        3. 5.2.5.3 Key Developments
        4. 5.2.5.4 SWOT Analysis
        5. 5.2.5.5 Key Strategies
      6. 5.2.6 Sharp Corporation (JP)
        1. 5.2.6.1 Financial Overview
        2. 5.2.6.2 Products Offered
        3. 5.2.6.3 Key Developments
        4. 5.2.6.4 SWOT Analysis
        5. 5.2.6.5 Key Strategies
      7. 5.2.7 Visionox Technology (CN)
        1. 5.2.7.1 Financial Overview
        2. 5.2.7.2 Products Offered
        3. 5.2.7.3 Key Developments
        4. 5.2.7.4 SWOT Analysis
        5. 5.2.7.5 Key Strategies
      8. 5.2.8 Everdisplay Optronics (CN)
        1. 5.2.8.1 Financial Overview
        2. 5.2.8.2 Products Offered
        3. 5.2.8.3 Key Developments
        4. 5.2.8.4 SWOT Analysis
        5. 5.2.8.5 Key Strategies
    3. 5.3 Appendix
      1. 5.3.1 References
      2. 5.3.2 Related Reports
  6. 6 LIST OF FIGURES
    1. 6.1 MARKET SYNOPSIS
    2. 6.2 US MARKET ANALYSIS BY APPLICATION
    3. 6.3 US MARKET ANALYSIS BY DISPLAY TYPE
    4. 6.4 US MARKET ANALYSIS BY RESOLUTION
    5. 6.5 US MARKET ANALYSIS BY END USE
    6. 6.6 KEY BUYING CRITERIA OF SEMICONDUCTOR & ELECTRONICS
    7. 6.7 RESEARCH PROCESS OF MRFR
    8. 6.8 DRO ANALYSIS OF SEMICONDUCTOR & ELECTRONICS
    9. 6.9 DRIVERS IMPACT ANALYSIS: SEMICONDUCTOR & ELECTRONICS
    10. 6.10 RESTRAINTS IMPACT ANALYSIS: SEMICONDUCTOR & ELECTRONICS
    11. 6.11 SUPPLY / VALUE CHAIN: SEMICONDUCTOR & ELECTRONICS
    12. 6.12 SEMICONDUCTOR & ELECTRONICS, BY APPLICATION, 2024 (% SHARE)
    13. 6.13 SEMICONDUCTOR & ELECTRONICS, BY APPLICATION, 2024 TO 2035 (USD Billion)
    14. 6.14 SEMICONDUCTOR & ELECTRONICS, BY DISPLAY TYPE, 2024 (% SHARE)
    15. 6.15 SEMICONDUCTOR & ELECTRONICS, BY DISPLAY TYPE, 2024 TO 2035 (USD Billion)
    16. 6.16 SEMICONDUCTOR & ELECTRONICS, BY RESOLUTION, 2024 (% SHARE)
    17. 6.17 SEMICONDUCTOR & ELECTRONICS, BY RESOLUTION, 2024 TO 2035 (USD Billion)
    18. 6.18 SEMICONDUCTOR & ELECTRONICS, BY END USE, 2024 (% SHARE)
    19. 6.19 SEMICONDUCTOR & ELECTRONICS, BY END USE, 2024 TO 2035 (USD Billion)
    20. 6.20 BENCHMARKING OF MAJOR COMPETITORS
  7. 7 LIST OF TABLES
    1. 7.1 LIST OF ASSUMPTIONS
  8. 7.1.1
    1. 7.2 US MARKET SIZE ESTIMATES; FORECAST
      1. 7.2.1 BY APPLICATION, 2025-2035 (USD Billion)
      2. 7.2.2 BY DISPLAY TYPE, 2025-2035 (USD Billion)
      3. 7.2.3 BY RESOLUTION, 2025-2035 (USD Billion)
      4. 7.2.4 BY END USE, 2025-2035 (USD Billion)
    2. 7.3 PRODUCT LAUNCH/PRODUCT DEVELOPMENT/APPROVAL
  9. 7.3.1
    1. 7.4 ACQUISITION/PARTNERSHIP
  10. 7.4.1

US Semiconductor & Electronics Market Segmentation

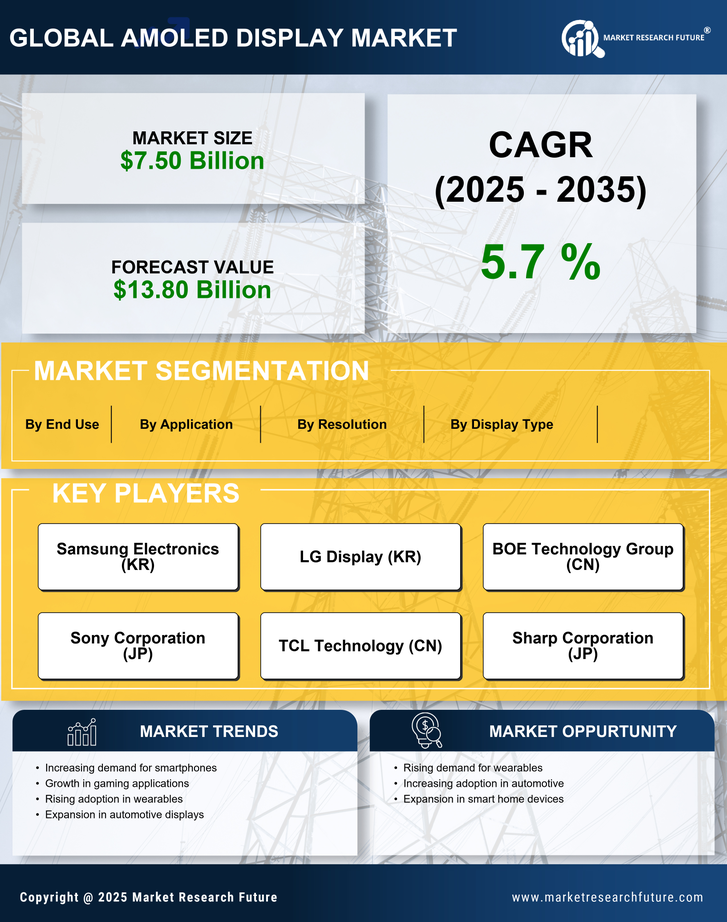
Semiconductor & Electronics By Application (USD Billion, 2025-2035)

  • Smartphones
  • Televisions
  • Wearable Devices
  • Tablets
  • Laptops

Semiconductor & Electronics By Display Type (USD Billion, 2025-2035)

  • Rigid AMOLED
  • Flexible AMOLED
  • Transparent AMOLED
  • Foldable AMOLED

Semiconductor & Electronics By Resolution (USD Billion, 2025-2035)

  • HD
  • Full HD
  • Quad HD
  • Ultra HD
  • 8K

Semiconductor & Electronics By End Use (USD Billion, 2025-2035)

  • Consumer Electronics
  • Automotive
  • Healthcare
  • Aerospace
  • Advertising

Compare Licence

×
Features License Type
Single User Multiuser License Enterprise User
Price $4,950 $5,950 $7,250
Maximum User Access Limit 1 User Upto 10 Users Unrestricted Access Throughout the Organization
Free Customization
Direct Access to Analyst
Deliverable Format
Platform Access
Discount on Next Purchase 10% 15% 15%
Printable Versions