ID: MRFR/SEM/0673-HCR | February 2021 | Region: Global | 110 pages
Market Synopsis
A display is a computer projecting mechanism and output surface that shows graphic images, and text to user using cathode ray oscilloscope (CRT), LCD, LED or other projection technologies. Most of the computer displays work on analog signals. Displays can be characterized according to sharpness & viewability, color capacity, size of the screen, and projection technology.
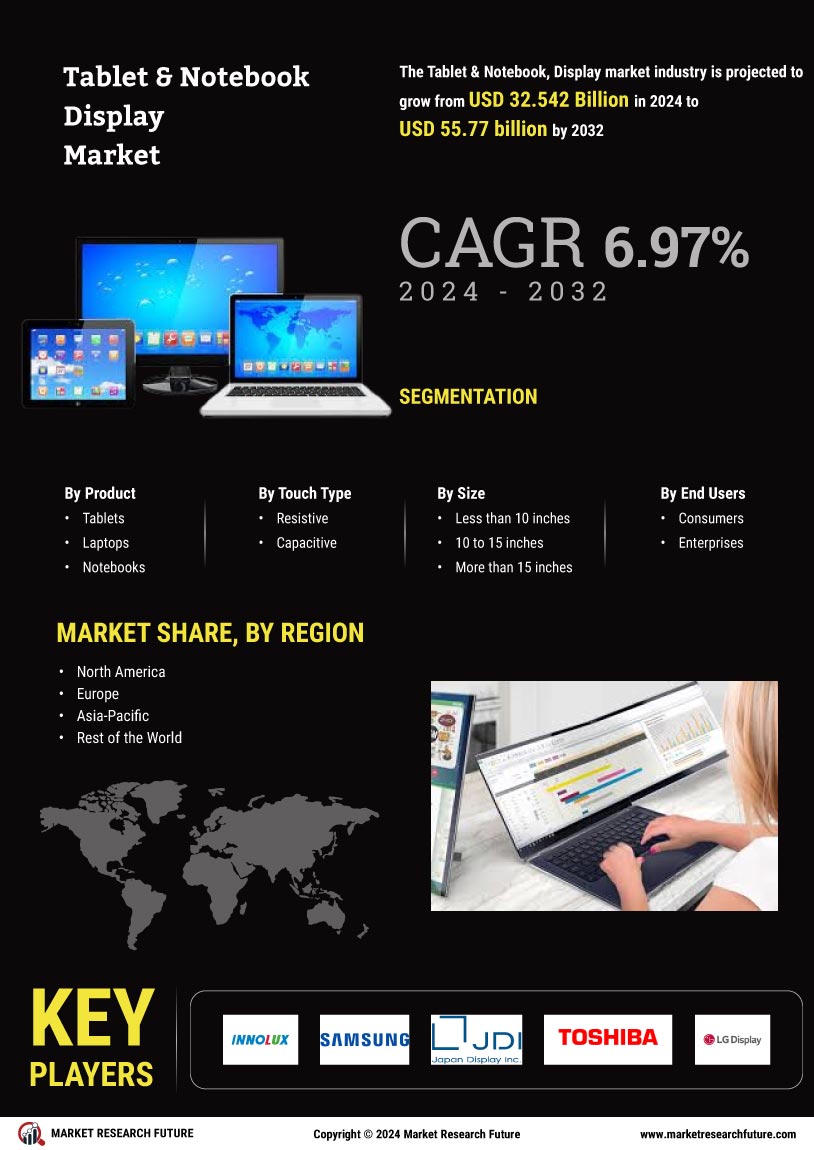
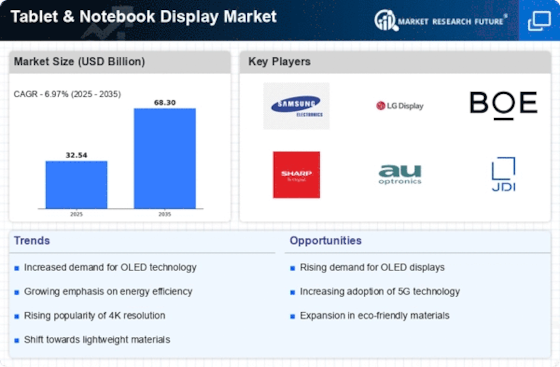
Globally, the tablets & notebook display market is expected to grow from USD 18.47 billion in 2017 to USD 28.46 billion by 2023, at a CAGR of 8% during the forecast period. Increasing adoption of touch-based and energy efficient devices is set to drive the tablets & notebook display market during the forecast period. However, high manufacturing cost of displays is the main challenge limiting their adoption in the market. With the increasing demand for tablets and notebooks, the concentration of display manufacturers is also increasing. In the future, the adoption of the AR/VR devices is expected to create opportunities for key players operating in the tablet & notebook display market.
By technology, the market is segmented into LCD (TFT, IPS), LED, OLED, and AMOLED. LCD is made with passive matrix and active matrix methods. OLED technology offers flat light emitting displays made with organic thin films placed in series between two conductors. OLED is a type emissive display technology that does not require backlight and hence is thin and more efficient than LCD technology. AMOLED is a projection technology involves the use of small red, blue, and green organic-based light emitting diodes (LED). AMOLED is used in flexible, transparent, and practically unbreakable displays. OLED technology is expected to dominate the technology market during the forecast period due to increase demand of OLED television products in the global market.
By touch type, the market is segmented into capacitive and resistive touch. Capacitive touch market segment is expected to dominate the market during forecast period due to its efficiency, superior sensitivity, and faster response time.
Global Tablet & Notebook Display Market
Source: MRFR Analysis
Segmentation
Global tablets & notebook display market can be segmented as follows:
By product, the market is segmented into tablets and notebook/laptop.
By technology, the market is segmented into LCD, LED, OLED, and AMOLED. LCD is further segmented into TFT and IPS.
By touch type, the market is segmented into capacitive and resistive.
By display size, the market is segmented into less than 10 inches, 10 to 15 inches, and more than 15 inches.
By end-user, the market is segmented into consumer and enterprises.
By region, the market is segmented into North America, Europe, Asia-Pacific, and the rest of the world.
Regional Analysis
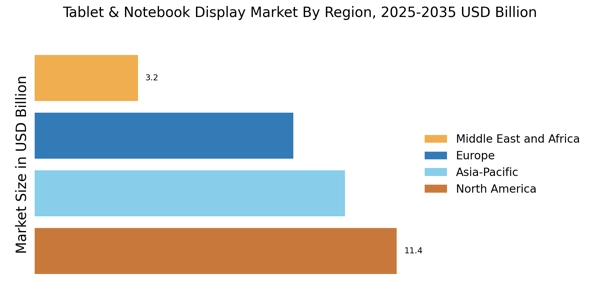
The global market for tablet & notebook displays is estimated to grow at a significant rate during the forecast period. The geographical analysis of tablet & notebook display market is done for North America, Europe, Asia-Pacific, and the rest of the world.
Asia-Pacific is expected to dominate the market for tablet & notebook displays in the forecast period. China, Japan, and India dominate the tablet & notebook display market in the region. Increasing popularity and susbsequent adoption of smartphones with advance display technology, increasing adoption of touch devices, and continuous technical advances in display technologies are a few factors driving the tablet & notebook display market in Asia-Pacific. SAMSUNG Electronics Corporation Ltd, LG Electronics Inc., and Toshiba Corporation are the major players in the Asia-Pacific region.
The tablet & notebook display market in North America is also expected to grow at rapid rate during the forecast period. High spending on consumer electronics and early adoption of new technologies drives the tablet & notebook display market in the North American region. Countries such as the US, Canada, and Mexico are expected to dominate the tablet & notebook display market during the forecast period. Hewlett Packard Enterprise and Dell Corporation are the major manufacturers of tablets & notebooks in North America.
Key Players
The prominent players in the market of tablet & notebook display are AU Optronics (Taiwan), Innolux Corporation (Taiwan), SAMSUNG (South Korea), Japan Display (Japan), Toshiba (Japan), LG (South Korea), Sharp Corporation (Japan), Chi Mei Corporation (Taiwan), and Apple Inc. (US), Tianma Microelectronics (China) among others.
Intended Audience
Frequently Asked Questions (FAQ) :
The worldwide tablets & notebook display market can thrive at 8% CAGR and value USD 28.46 billion by 2023.
Sharp Corporation (Japan), Apple Inc. (US), and Chi Mei Corporation (Taiwan) are some major companies of the tablet ¬ebook display market.
OLED is the booming display technology, followed by LCD and LED.
Inclination of people towards precise reading can catalyze the growth of tablet ¬ebook display market.
In 2017, the tablet ¬ebook display market valued at USD 18.47 billion.
TABLE OF CONTENTS
1. Executive Summary
2. Scope of the Report
2.1. Market Definition
2.2. Scope of the Study
2.2.1. Research Objectives
2.2.2. Assumptions & Limitations
2.3. Markets Structure
3. Market Research Methodology
3.1. Research Process
3.2. Secondary Research
3.3. Primary Research
3.4. Forecast Model
4. Market Landscape
4.1. Porter’s Five Forces Analysis
4.1.1. Threat of New Entrants
4.1.2. Bargaining power of buyers
4.1.3. Threat of substitutes
4.1.4. Rivalry
4.1.5. Bargaining Power of Suppliers
4.2. Value Chain/Supply Chain of Tablet & Notebook Display Market
5. Market Overview of Tablet & Notebook Display Market
5.1. Introduction
5.2. Growth Drivers
5.3. Impact Analysis
5.4. Market Challenges
6. Market Trends
6.1. Introduction
6.2. Growth Trends
6.3. Impact Analysis
7. Tablet & Notebook Display Market, by Product
7.1. Introduction
7.2. Tablet
7.2.1. Market Estimates & Forecast, 2018–2023
7.2.2. Market Estimates & Forecast, by Region, 2018–2023
7.3. Notebook/laptop
7.3.1. Market Estimates & Forecast, 2018–2023
7.3.2. Market Estimates & Forecast, by Region, 2018–2023
8. Tablet & Notebook Display Market, by Touch Type
8.1. Introduction
8.2. Capacitive
8.2.1.1. Market Estimates & Forecast, 2018–2023
8.2.1.2. Market Estimates & Forecast, by Region, 2018–2023
8.3. Resistive
8.3.1.1. Market Estimates & Forecast, 2018–2023
8.3.1.2. Market Estimates & Forecast, by Region, 2018–2023
9. Tablet & Notebook Display Market, by End-User
9.1. Introduction
9.2. Consumers
9.2.1.1. Market Estimates & Forecast, 2018–2023
9.2.1.2. Market Estimates & Forecast, by Region, 2018–2023
9.3. Enterprises
9.3.1.1. Market Estimates & Forecast, 2018–2023
9.3.1.2. Market Estimates & Forecast, by Region, 2018–2023
10. Tablet & Notebook Display Market, by Technology
10.1. Introduction
10.2. LCD
10.2.1. TFT
10.2.1.1. Market Estimates & Forecast, 2018–2023
10.2.1.2. Market Estimates & Forecast, by Region, 2018–2023
10.2.2. IPS
10.2.2.1. Market Estimates & Forecast, 2018–2023
10.2.2.2. Market Estimates & Forecast, by Region, 2018–2023
10.3. LED
10.3.1.1. Market Estimates & Forecast, 2018–2023
10.3.1.2. Market Estimates & Forecast, by Region, 2018–2023
10.4. OLED
10.4.1.1. Market Estimates & Forecast, 2018–2023
10.4.1.2. Market Estimates & Forecast, by Region, 2018–2023
10.5. AMOLED
10.5.1.1. Market Estimates & Forecast, 2018–2023
10.5.1.2. Market Estimates & Forecast, by Region, 2018–2023
11. Tablet & Notebook Display Market, by Display Size
11.1. Introduction
11.2. Less than 10 inches
11.2.1.1. Market Estimates & Forecast, 2018–2023
11.2.1.2. Market Estimates & Forecast, by Region, 2018–2023
11.3. 10 to 15 inches
11.3.1.1. Market Estimates & Forecast, 2018–2023
11.3.1.2. Market Estimates & Forecast, by Region, 2018–2023
11.4. More than 15 inches
11.4.1.1. Market Estimates & Forecast, 2018–2023
11.4.1.2. Market Estimates & Forecast, by Region, 2018–2023
12. Tablet & Notebook Display Market, by Region
12.1. Introduction
12.2. North America
12.2.1. Market Estimates & Forecast, by Country 2018–2023
12.2.2. Market Estimates & Forecast, by Product, 2018–2023
12.2.3. Market Estimates & Forecast, by Touch Types, 2018–2023
12.2.4. Market Estimates & Forecast, by End-User, 2018–2023
12.2.5. Market Estimates & Forecast, by Technology, 2018–2023
12.2.6. Market Estimates & Forecast, by Display Size, 2018–2023
12.2.7. US
12.2.7.1. Market Estimates & Forecast, by Product, 2018–2023
12.2.7.2. Market Estimates & Forecast, by Touch Types, 2018–2023
12.2.7.3. Market Estimates & Forecast, by End-User, 2018–2023
12.2.7.4. Market Estimates & Forecast, by Technology, 2018–2023
12.2.7.5. Market Estimates & Forecast, by Display Size, 2018–2023
12.2.8. Mexico
12.2.8.1. Market Estimates & Forecast, by Product, 2018–2023
12.2.8.2. Market Estimates & Forecast, by Touch Types, 2018–2023
12.2.8.3. Market Estimates & Forecast, by End-User, 2018–2023
12.2.8.4. Market Estimates & Forecast, by Technology, 2018–2023
12.2.8.5. Market Estimates & Forecast, by Display Size, 2018–2023
12.2.9. Canada
12.2.9.1. Market Estimates & Forecast, by Product, 2018–2023
12.2.9.2. Market Estimates & Forecast, by Touch Types, 2018–2023
12.2.9.3. Market Estimates & Forecast, by End-User, 2018–2023
12.2.9.4. Market Estimates & Forecast, by Technology, 2018–2023
12.2.9.5. Market Estimates & Forecast, by Display Size, 2018–2023
12.3. Europe
12.3.1. Market Estimates & Forecast, by Country 2018–2023
12.3.2. Market Estimates & Forecast, by Product, 2018–2023
12.3.3. Market Estimates & Forecast, by Touch Types, 2018–2023
12.3.4. Market Estimates & Forecast, by End-User, 2018–2023
12.3.5. Market Estimates & Forecast, by Technology, 2018–2023
12.3.6. Market Estimates & Forecast, by Display Size, 2018–2023
12.3.7. Germany
12.3.7.1. Market Estimates & Forecast, by Product, 2018–2023
12.3.7.2. Market Estimates & Forecast, by Touch Types, 2018–2023
12.3.7.3. Market Estimates & Forecast, by End-User, 2018–2023
12.3.7.4. Market Estimates & Forecast, by Technology, 2018–2023
12.3.7.5. Market Estimates & Forecast, by Display Size, 2018–2023
12.3.8. France
12.3.8.1. Market Estimates & Forecast, by Product, 2018–2023
12.3.8.2. Market Estimates & Forecast, by Touch Types, 2018–2023
12.3.8.3. Market Estimates & Forecast, by End-User, 2018–2023
12.3.8.4. Market Estimates & Forecast, by Technology, 2018–2023
12.3.8.5. Market Estimates & Forecast, by Display Size, 2018–2023
12.3.9. UK
12.3.9.1. Market Estimates & Forecast, by Product, 2018–2023
12.3.9.2. Market Estimates & Forecast, by Touch Types, 2018–2023
12.3.9.3. Market Estimates & Forecast, by End-User, 2018–2023
12.3.9.4. Market Estimates & Forecast, by Technology, 2018–2023
12.3.9.5. Market Estimates & Forecast, by Display Size, 2018–2023
12.4. Asia-Pacific
12.4.1. Market Estimates & Forecast, by Country 2018–2023
12.4.2. Market Estimates & Forecast, by Product, 2018–2023
12.4.3. Market Estimates & Forecast, by Touch Types, 2018–2023
12.4.4. Market Estimates & Forecast, by End-User, 2018–2023
12.4.5. Market Estimates & Forecast, by Technology, 2018–2023
12.4.6. Market Estimates & Forecast, by Display Size, 2018–2023
12.4.7. China
12.4.7.1. Market Estimates & Forecast, by Product, 2018–2023
12.4.7.2. Market Estimates & Forecast, by Touch Types, 2018–2023
12.4.7.3. Market Estimates & Forecast, by End-User, 2018–2023
12.4.7.4. Market Estimates & Forecast, by Technology, 2018–2023
12.4.7.5. Market Estimates & Forecast, by Display Size, 2018–2023
12.4.8. India
12.4.8.1. Market Estimates & Forecast, by Product, 2018–2023
12.4.8.2. Market Estimates & Forecast, by Touch Types, 2018–2023
12.4.8.3. Market Estimates & Forecast, by End-User, 2018–2023
12.4.8.4. Market Estimates & Forecast, by Technology, 2018–2023
12.4.8.5. Market Estimates & Forecast, by Display Size, 2018–2023
12.4.9. Japan
12.4.9.1. Market Estimates & Forecast, by Product, 2018–2023
12.4.9.2. Market Estimates & Forecast, by Touch Types, 2018–2023
12.4.9.3. Market Estimates & Forecast, by End-User, 2018–2023
12.4.9.4. Market Estimates & Forecast, by Technology, 2018–2023
12.4.9.5. Market Estimates & Forecast, by Display Size, 2018–2023
12.4.10. Rest of Asia-Pacific
12.4.10.1. Market Estimates & Forecast, by Product, 2018–2023
12.4.10.2. Market Estimates & Forecast, by Touch Types, 2018–2023
12.4.10.3. Market Estimates & Forecast, by End-User, 2018–2023
12.4.10.4. Market Estimates & Forecast, by Technology, 2018–2023
12.4.10.5. Market Estimates & Forecast, by Display Size, 2018–2023
12.5. Rest of the World
12.5.1. Market Estimates & Forecast, by Country 2018–2023
12.5.2. Market Estimates & Forecast, by Product, 2018–2023
12.5.3. Market Estimates & Forecast, by Touch Types, 2018–2023
12.5.4. Market Estimates & Forecast, by End-User, 2018–2023
12.5.5. Market Estimates & Forecast, by Technology, 2018–2023
12.5.6. Market Estimates & Forecast, by Display Size, 2018–2023
12.5.7. Middle East & Africa
12.5.7.1. Market Estimates & Forecast, by Product, 2018–2023
12.5.7.2. Market Estimates & Forecast, by Touch Types, 2018–2023
12.5.7.3. Market Estimates & Forecast, by End-user, 2018–2023
12.5.7.4. Market Estimates & Forecast, by Technology, 2018–2023
12.5.7.5. Market Estimates & Forecast, by Display Size, 2018–2023
12.5.8. Latin Countries
12.5.8.1. Market Estimates & Forecast, by Product, 2018–2023
12.5.8.2. Market Estimates & Forecast, by Touch Types, 2018–2023
12.5.8.3. Market Estimates & Forecast, by End-user, 2018–2023
12.5.8.4. Market Estimates & Forecast, by Technology, 2018–2023
12.5.8.5. Market Estimates & Forecast, by Display Size, 2018–2023
13. Company Profiles
13.1. AU Optronics
13.1.1. Company Overview
13.1.2. Product/Business Segment Overview
13.1.3. Financial Updates
13.1.4. Key Developments
13.2. Innolux Corporation
13.2.1. Company Overview
13.2.2. Product/Business Segment Overview
13.2.3. Financial Updates
13.2.4. Key Developments
13.3. SAMSUNG
13.3.1. Company Overview
13.3.2. Product/Business Segment Overview
13.3.3. Financial Updates
13.3.4. Key Developments
13.4. Japan Display
13.4.1. Company Overview
13.4.2. Product/Business Segment Overview
13.4.3. Financial Updates
13.4.4. Key Developments
13.5. Toshiba Corporation
13.5.1. Company Overview
13.5.2. Product/Business Segment Overview
13.5.3. Financial Updates
13.5.4. Key Developments
13.6. LG Displays
13.6.1. Company Overview
13.6.2. Product/Business Segment Overview
13.6.3. Financial Updates
13.6.4. Key Developments
13.7. Sharp corporation
13.7.1. Company Overview
13.7.2. Product/Business Segment Overview
13.7.3. Financial Updates
13.7.4. Key Developments
13.8. Chi Mei Corporation
13.8.1. Company Overview
13.8.2. Product/Business Segment Overview
13.8.3. Financial Updates
13.8.4. Key Developments
13.9. Apple Inc.
13.9.1. Company Overview
13.9.2. Product/Business Segment Overview
13.9.3. Financial Updates
13.9.4. Key Developments
13.10. Tianma Microelectronics
13.10.1. Company Overview
13.10.2. Product/Business Segment Overview
13.10.3. Financial Updates
13.10.4. Key Developments
14. Conclusion
LIST OF TABLES
Table1 Global Tablet & Notebook Display Market, By Country, 2018-2023
Table2 North America: Tablet & Notebook Display Market, By Country, 2018–2023
Table3 Europe: Tablet & Notebook Display Market, By Country, 2018–2023
Table4 Asia-Pacific: Tablet & Notebook Display Market, By Country, 2018–2023
Table5 Latin America: Tablet & Notebook Display Market, By Country, 2018–2023
Table6 North America: Tablet & Notebook Display Market, By Country
Table7 North America: Tablet & Notebook Display Market, By Product
Table8 North America: Tablet & Notebook Display Market, By Touch Types
Table9 North America: Tablet & Notebook Display Market, By End-user
Table10 North America: Tablet & Notebook Display Market, By Technology
Table11 North America: Tablet & Notebook Display Market, By Display Size
Table12 Europe: Tablet & Notebook Display Market, By Country
Table13 Europe: Tablet & Notebook Display Market, By Product
Table14 Europe: Tablet & Notebook Display Market, By Touch Types
Table15 Europe: Tablet & Notebook Display Market, By End-User
Table16 Europe: Tablet & Notebook Display Market, By Technology
Table17 Europe: Tablet & Notebook Display Market, By Display Size
Table18 Asia-Pacific: Tablet & Notebook Display Market, By Country
Table19 Asia-Pacific: Tablet & Notebook Display Market, By Product
Table20 Asia-Pacific: Tablet & Notebook Display Market, By Touch Types
Table21 Asia-Pacific: Tablet & Notebook Display Market, By End-User
Table22 Asia-Pacific: Tablet & Notebook Display Market, By Technology
Table23 Asia-Pacific: Tablet & Notebook Display Market, By Display Size
Table24 Middle East & Africa: Tablet & Notebook Display Market, By Country
Table25 Middle East & Africa: Tablet & Notebook Display Market, By Product
Table26 Middle East & Africa: Tablet & Notebook Display Market, By Touch Types
Table27 Middle East & Africa: Tablet & Notebook Display Market, By End-User
Table28 Middle East & Africa: Tablet & Notebook Display Market, By Technology
Table29 Middle East & Africa: Tablet & Notebook Display Market, By Display Size
Table30 Latin America: Tablet & Notebook Display Market, By Country
Table31 Latin America: Tablet & Notebook Display Market, By Product
Table32 Latin America: Tablet & Notebook Display Market, By Touch Types
Table33 Latin America: Tablet & Notebook Display Market, By End-User
Table34 Latin America: Tablet & Notebook Display Market, By Technology
Table35 Latin America: Tablet & Notebook Display Market, By Display Size
LIST OF FIGURES
Figure 1 Global Tablet & Notebook Display Market segmentation
Figure 2 Forecast Methodology
Figure 3 Porter’s Five Forces Analysis of Global Tablet & Notebook Display Market
Figure 4 Value Chain of Global Tablet & Notebook Display Market
Figure 5 Share of Tablet & Notebook Display Market in 2018, by country (in %)
Figure 6 Global Tablet & Notebook Display Market, 2018–2023
Figure 7 Share of Global Tablet & Notebook Display Market by Industry, 2018–2023
Figure 8 Global Tablet & Notebook Display Market Size, by Product, 2018
Figure 9 Share of Global Tablet & Notebook Display Market, by Product, 2018–2023
Figure 10 Global Tablet & Notebook Display Market Size, by Touch Types, 2018
Figure 11 Share of Global Tablet & Notebook Display Market, by Touch Types, 2018–2023
Figure 12 Global Tablet & Notebook Display Market Size, by End-User, 2018
Figure 13 Share of Global Tablet & Notebook Display Market, by End-User, 2018–2023
Figure 14 Global Tablet & Notebook Display Market Size, by Technology, 2018
Figure 15 Share of Global Tablet & Notebook Display Market, by Technology, 2018–2023
Figure 16 Global Tablet & Notebook Display Market Size, by Display Size, 2018
Figure 17 Share of Global Tablet & Notebook Display Market, by Display Size, 2018–2023