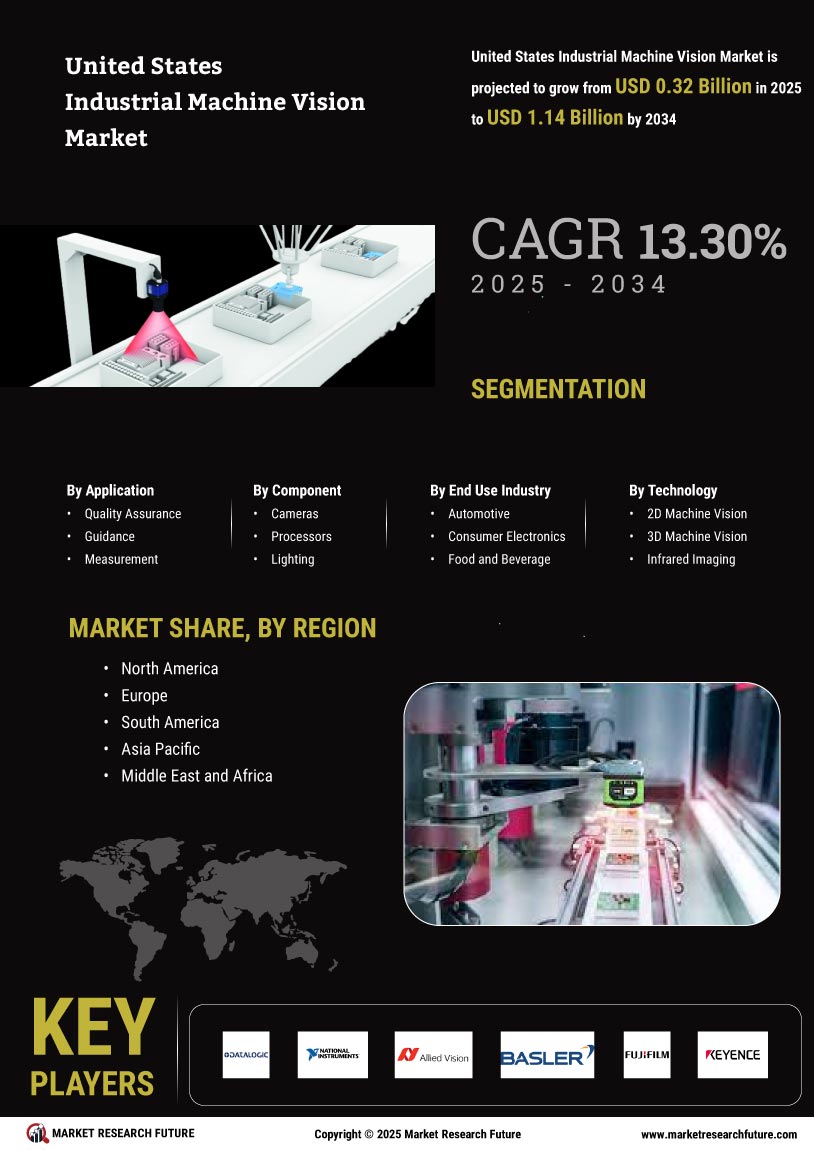
United States Industrial Machine Vision Market
ID: MRFR/ICT/19889-HCR
128 Pages
Nirmit Biswas
Last Updated: April 24, 2026
United States Industrial Machine Vision Market Research Report: By Application (Quality Assurance, Guidance, Measurement, Identification, Automated Inspection), By Component (Cameras, Processors, Lighting, Software, Frame Grabbers), By End Use Industry (Automotive, Consumer Electronics, Food and Beverage, Pharmaceuticals, Semiconductors), By Technology (2D Machine Vision, 3D Machine Vision, Infrared Imaging, Spectral Imaging, Smart Cameras) and By Regional (North America, Europe, South America, Asia Pacific, Middle East and Africa) - Forecast to 2035.