ID: MRFR/HC/5657-HCR | February 2021 | Region: Global | 100 pages
Market Scenario
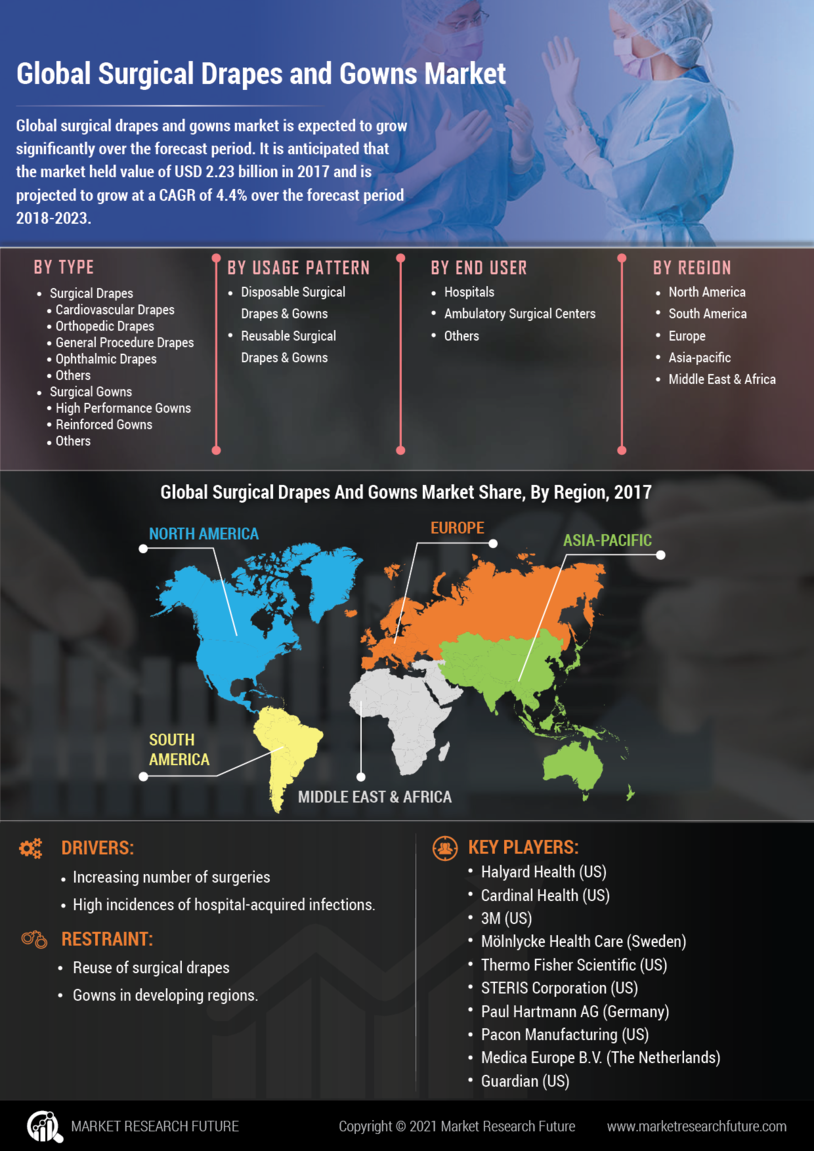
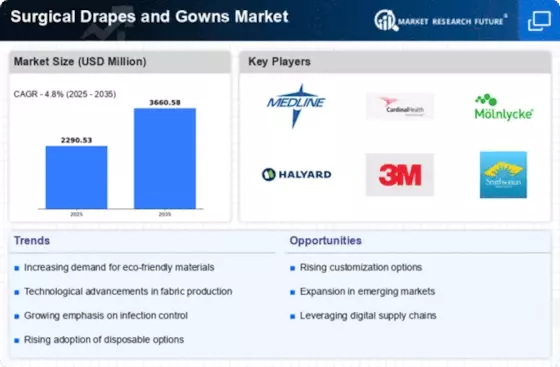
Global surgical drapes and gowns market is expected to grow significantly over the forecast period. It is anticipated that the market held value of USD 2.23 billion in 2017 and is projected to grow at a CAGR of 4.4% over the forecast period.
The factors such as increasing number of surgeries and high incidences of hospital-acquired infections are expected to propel the growth of the market. However, reuse of surgical drapes and gowns in developing regions hamper the market growth over the forecast period.
Segmentation
The global surgical drapes and gowns market has been segmented into type, usage pattern, and end user.
Based on type, surgical drapes and gowns market is segmented into surgical drapes and surgical gowns. The surgical drapes segment is expected to account for the largest share segment of the market in 2017.
Based on usage pattern, surgical drapes and gowns market is segmented into disposable surgical drapes & gowns and reusable surgical drapes & gowns.
Based on end user, surgical drapes and gowns market is segmented into hospitals, ambulatory surgical centers, and others. The hospitals segment is expected to account for the largest share segment of the market in 2017.
The surgical drapes and gowns market segmented, by region, into the Americas, Europe, Asia-Pacific, and the Middle East & Africa. The surgical drapes and gowns market in the Americas further segmented into North America and South America, with the North American market divided into the US and Canada.
The European surgical drapes and gowns market has been segmented into Western Europe and Eastern Europe. Western Europe has further been classified as Germany, France, the UK, Italy, Spain, and the rest of Western Europe.
The surgical drapes and gowns market in Asia-Pacific has been segmented into Japan, China, India, South Korea, Australia, and the rest of Asia-Pacific. The surgical drapes and gowns market in the Middle East & Africa segmented into the Middle East and Africa.
Key players
Halyard Health (US), Cardinal Health (US), 3M (US), Mölnlycke Health Care (Sweden), Thermo Fisher Scientific (US), STERIS Corporation (US), Paul Hartmann AG (Germany), Pacon Manufacturing (US), Medica Europe B.V. (The Netherlands), and Guardian (US) are some of the key players in the global surgical drapes and gowns market.
Regional Market Summary
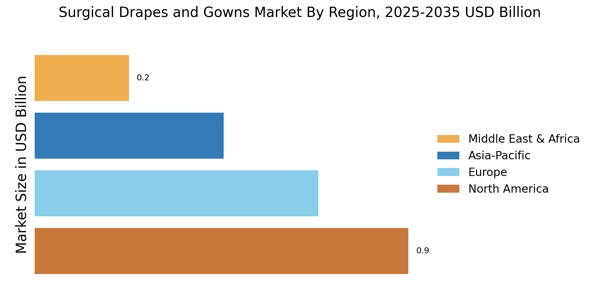
Global Surgical Drapes and Gowns Market Share (%), by Region, 2017
Source: Annual Reports and Sec filings
Geographically, the Americas is anticipated to dominate the global surgical drapes and gowns market owing to a well-established player and increasing surgical procedures.
Europe is expected to hold the second largest position in the global surgical drapes and gowns market. The market growth in this region is attributed to the growth in surgical procedures.
The surgical drapes and gowns market in Asia-Pacific region consists of countries namely China, Japan, Republic of Korea, India, Australia and Rest of Asia-Pacific. The Asia-Pacific region is expected to be fastest growing region.
The Middle East & Africa has the least share of the surgical drapes and gowns market
Global Surgical Drapes and Gowns Market, by Type:
Global Surgical Drapes and Gowns Market, by Usage Pattern:
Global Surgical Drapes and Gowns Market, by End User:
Global Surgical Drapes and Gowns Market, by Region:
Global Surgical Drapes and Gowns, by Key Players:
Intended Audience:
Frequently Asked Questions (FAQ) :
The surgical drapes and gowns market in 2017 had a valuation of USD 2.23 billion.
The surgical drapes and gowns market would grow with 4.4% CAGR during the forecast period of 2018 to 2023.
The surgical drapes and gowns market has disposable surgical drapes & gowns and reusable surgical drapes & gowns based on their usage pattern.
The surgical drapes segment had the maximum market valuation in 2017.
The hospitals segment would lead the surgical drapes and gowns market.
Table of Contents:
Chapter 1. Report Prologue
Chapter 2. Market Introduction
2.1. Definition
2.2. Scope of the Study
2.2.1. Research Objective
2.2.2. Assumptions
2.2.3. Limitations
Chapter 3. Research Methodology
3.1. Introduction
3.2. Primary Research
3.3. Secondary Research
3.4. Market Size Estimation
Chapter 4. Market Dynamics
4.1. Drivers
4.2. Restraints
4.3. Opportunities
4.4. Challenges
4.5. Macroeconomic Indicators
4.6. Detection Technique Trends & Assessment
Chapter 5. Market Factor Analysis
5.1. Porter’s Five Forces Analysis
5.1.1. Bargaining Power of Suppliers
5.1.2. Bargaining Power of Buyers
5.1.3. Threat of New Entrants
5.1.4. Threat of Substitutes
5.1.5. Intensity of Rivalry
5.2. Value Chain Analysis
5.3. Investment Feasibility Analysis
5.4. Pricing Analysis
Chapter 6. Global Surgical Drapes and Gowns Market, by Type
6.1. Introduction
6.2. Surgical Drapes
6.2.1. General Procedure Drapes
6.2.2. Cardiovascular Drapes
6.2.3. C-Section Drapes
6.2.4. Ophthalmic Drapes
6.2.5. Laparoscopy Drapes
6.2.6. Others
6.3. Surgical Gowns
6.3.1. Standard Performance Gowns
6.3.2. High-Performance Gowns
6.3.3. Reinforced Gowns
Chapter 7. Global Surgical Drapes and Gowns Market, by Usage Pattern
7.1. Introduction
7.2. Disposable Surgical Drapes & Gowns
Market Estimates & Forecast, by Region, 2018–2023
Market Estimates & Forecast, by Country, 2018–2023
7.3. Reusable Surgical Drapes & Gowns
Market Estimates & Forecast, by Region, 2018–2023
Market Estimates & Forecast, by Country, 2018–2023
Chapter 8. Global Surgical Drapes and Gowns Market, by End User
8.1. Introduction
Market Estimates & Forecast, by Region, 2018–2023
Market Estimates & Forecast, by Country, 2018–2023
8.2. Hospitals
Market Estimates & Forecast, by Region, 2018–2023
Market Estimates & Forecast, by Country, 2018–2023
8.3. Ambulatory Surgical Centers
Market Estimates & Forecast, by Region, 2018–2023
Market Estimates & Forecast, by Country, 2018–2023
8.4. Others
Market Estimates & Forecast, by Region, 2018–2023
Market Estimates & Forecast, by Country, 2018–2023
Chapter 9. Global Surgical Drapes and Gowns Market, by Region
9.1. Introduction
9.2. Americas
9.2.1. North America
9.2.1.1. US
9.2.1.2. Canada
9.2.2. South America
9.3. Europe
9.3.1. Western Europe
9.3.1.1. Germany
9.3.1.2. France
9.3.1.3. Italy
9.3.1.4. Spain
9.3.1.5. UK
9.3.1.6. Rest of Western Europe
9.3.2. Eastern Europe
9.4. Asia-Pacific
9.4.1. Japan
9.4.2. China
9.4.3. India
9.4.4. Australia
9.4.5. South Korea
9.4.6. Rest of Asia-Pacific
9.5. Middle East & Africa
9.5.1. Middle East
9.5.2. Africa
Chapter 10. Company Landscape
10.1. Introduction
10.2. Market Share Analysis
10.3. Key Developments & Strategies
Chapter 11. Company Profiles
11.1. Halyard Health
11.1.1. Company Overview
11.1.2. Type Overview
11.1.3. Financials Overview
11.1.4. Key Developments
11.1.5. SWOT Analysis
11.1.6. Key Strategies
11.2. Cardinal Health
11.2.1. Company Overview
11.2.2. Type Overview
11.2.3. Financials Overview
11.2.4. Key Developments
11.2.5. SWOT Analysis
11.2.6. Key Strategies
11.3. 3M
11.3.1. Company Overview
11.3.2. Type Overview
11.3.3. Financials Overview
11.3.4. Key Developments
11.3.5. SWOT Analysis
11.3.6. Key Strategies
11.4. Mölnlycke Health Care
11.4.1. Company Overview
11.4.2. Type Overview
11.4.3. Financials Overview
11.4.4. Key Developments
11.4.5. SWOT Analysis
11.4.6. Key Strategies
11.5. Thermo Fisher Scientific
11.5.1. Company Overview
11.5.2. Type Overview
11.5.3. Financials Overview
11.5.4. Key Developments
11.5.5. SWOT Analysis
11.5.6. Key Strategies
11.6. STERIS Corporation
11.6.1. Company Overview
11.6.2. Type Overview
11.6.3. Financials Overview
11.6.4. Key Developments
11.6.5. SWOT Analysis
11.6.6. Key Strategies
11.7. Paul Hartmann AG
11.7.1. Company Overview
11.7.2. Type Overview
11.7.3. Financials Overview
11.7.4. Key Developments
11.7.5. SWOT Analysis
11.7.6. Key Strategies
11.8. Vivostat A/S
11.8.1. Company Overview
11.8.2. Type Overview
11.8.3. Financials Overview
11.8.4. Key Developments
11.8.5. SWOT Analysis
11.8.6. Key Strategies
11.9. Medica Europe B.V.
11.9.1. Company Overview
11.9.2. Type Overview
11.9.3. Financials Overview
11.9.4. Key Developments
11.9.5. SWOT Analysis
11.9.6. Key Strategies
11.10. Guardian
11.10.1. Company Overview
11.10.2. Type Overview
11.10.3. Financials Overview
11.10.4. Key Developments
11.10.5. SWOT Analysis
11.10.6. Key Strategies
11.11. Others
Chapter 12. MRFR Conclusion
12.1. Key Findings
12.1.1. From CEO’s View point
12.1.2. Unmet Needs of the Market
12.2. Key Companies to Watch
12.3. Predictions for the Surgical Drapes and Gowns Industry
Chapter 13. Appendix
LIST OF TABLES
Table 1. Global Surgical Drapes and Gowns Market Synopsis, 2018–2023
Table 2. Global Surgical Drapes and Gowns Market Estimates and Forecast, 2018–2023 (USD Million)
Table 3. Global Surgical Drapes and Gowns Market, by Region, 2018–2023 (USD Million)
Table 4. Global Surgical Drapes and Gowns Market, by Type, 2018–2023 (USD Million)
Table 5. Global Surgical Drapes and Gowns Market, by Usage Pattern, 2018–2023 (USD Million)
Table 6. Global Surgical Drapes and Gowns Market, by End User, 2018–2023 (USD Million)
Table 7. North America: Surgical Drapes and Gowns Market, by Type, 2018–2023 (USD Million)
Table 8. North America: Surgical Drapes and Gowns Market, by Usage Pattern, 2018–2023 (USD Million)
Table 9. North America: Surgical Drapes and Gowns Market, by End User, 2018–2023 (USD Million)
Table 10. US: Surgical Drapes and Gowns Market, by Type, 2018–2023 (USD Million)
Table 11. US: Surgical Drapes and Gowns Market, by Usage Pattern, 2018–2023 (USD Million)
Table 12. US: Surgical Drapes and Gowns Market, by End User, 2018–2023 (USD Million)
Table 13. Canada: Surgical Drapes and Gowns Market, by Type, 2018–2023 (USD Million)
Table 14. Canada: Surgical Drapes and Gowns Market, by Usage Pattern, 2018–2023 (USD Million)
Table 15. Canada: Surgical Drapes and Gowns Market, by End User, 2018–2023 (USD Million)
Table 16. South America: Surgical Drapes and Gowns Market, by Type, 2018–2023 (USD Million)
Table 17. South America: Surgical Drapes and Gowns Market, by Usage Pattern, 2018–2023 (USD Million)
Table 18. South America: Surgical Drapes and Gowns Market, by End User, 2018–2023 (USD Million)
Table 19. Europe: Surgical Drapes and Gowns Market, by Type, 2018–2023 (USD Million)
Table 20. Europe: Surgical Drapes and Gowns Market, by Usage Pattern, 2018–2023 (USD Million)
Table 21. Europe: Surgical Drapes and Gowns Market, by End User, 2018–2023 (USD Million)
Table 22. Western Europe: Surgical Drapes and Gowns Market, by Type, 2018–2023 (USD Million)
Table 23. Western Europe: Surgical Drapes and Gowns Market, by Usage Pattern, 2018–2023 (USD Million)
Table 24. Western Europe: Surgical Drapes and Gowns Market, by End User, 2018–2023 (USD Million)
Table 25. Eastern Europe: Surgical Drapes and Gowns Market, by Type, 2018–2023 (USD Million)
Table 26. Eastern Europe: Surgical Drapes and Gowns Market, by Usage Pattern, 2018–2023 (USD Million)
Table 27. Eastern Europe: Surgical Drapes and Gowns Market, by End User, 2018–2023 (USD Million)
Table 28. Asia-Pacific: Surgical Drapes and Gowns Market, by Type, 2018–2023 (USD Million)
Table 29. Asia-Pacific: Surgical Drapes and Gowns Market, by Usage Pattern, 2018–2023 (USD Million)
Table 30. Asia-Pacific: Surgical Drapes and Gowns Market, by End User, 2018–2023 (USD Million)
Table 31. Middle East & Africa: Surgical Drapes and Gowns Market, by Type, 2018–2023 (USD Million)
Table 32. Middle East & Africa: Surgical Drapes and Gowns Market, by Usage Pattern, 2018–2023 (USD Million)
Table 33. Middle East & Africa: Surgical Drapes and Gowns Market, by End User, 2018–2023 (USD Million)
LIST OF FIGURES
Figure 1. Research Process
Figure 2. Segmentation for Global Surgical Drapes and Gowns Market
Figure 3. Segmentation Market Dynamics for Global Surgical Drapes and Gowns Market
Figure 4. Global Surgical Drapes and Gowns Market Share, by Type, 2017
Figure 5. Global Surgical Drapes and Gowns Market Share, by Usage Pattern, 2017
Figure 6. Global Surgical Drapes and Gowns Market Share, by End User, 2017
Figure 7. Global Surgical Drapes and Gowns Market Share, by Region, 2017
Figure 8. North America: Surgical Drapes and Gowns Market Share, by Country, 2017
Figure 9. Europe: Surgical Drapes and Gowns Market Share, by Country, 2017
Figure 10. Asia-Pacific: Surgical Drapes and Gowns Market Share, by Country, 2017
Figure 11. Middle East & Africa: Surgical Drapes and Gowns Market Share, by Country, 2017
Figure 12. Global Surgical Drapes and Gowns Market: Company Share Analysis, 2017 (%)
Figure 13. Halyard Health: Key Financials
Figure 14. Halyard Health: Segmental Revenue
Figure 15. Halyard Health: Geographical Revenue
Figure 16. Cardinal Health: Key Financials
Figure 17. Cardinal Health: Segmental Revenue
Figure 18. Cardinal Health: Geographical Revenue
Figure 19. 3M: Key Financials
Figure 20. 3M: Segmental Revenue
Figure 21. 3M: Geographical Revenue
Figure 22. Mölnlycke Health Care: Key Financials
Figure 23. Mölnlycke Health Care: Segmental Revenue
Figure 24. Mölnlycke Health Care: Geographical Revenue
Figure 25. Thermo Fisher Scientific: Key Financials
Figure 26. Thermo Fisher Scientific: Segmental Revenue
Figure 27. Thermo Fisher Scientific: Geographical Revenue
Figure 28. STERIS Corporation: Key Financials
Figure 29. STERIS Corporation: Segmental Revenue
Figure 30. STERIS Corporation: Geographical Revenue
Figure 31. Paul Hartmann AG: Key Financials
Figure 32. Paul Hartmann AG: Segmental Revenue
Figure 33. Paul Hartmann AG: Geographical Revenue
Figure 34. Pacon Manufacturing: Key Financials
Figure 35. Pacon Manufacturing: Segmental Revenue
Figure 36. Pacon Manufacturing: Geographical Revenue
Figure 37. Medica Europe B.V.: Key Financials
Figure 38. Medica Europe B.V.: Segmental Revenue
Figure 39. Medica Europe B.V.: Geographical Revenue
Figure 40. Guardian: Key Financials
Figure 41. Guardian: Segmental Revenue
Figure 42. Guardian: Geographical Revenue
This table of content is tentative and subject to change as the research progresses.
Please Note: Financial details of company cannot be provided if the information of the company is not available in public domain and or reliable source.