Solar Energy and Battery Storage Market Summary
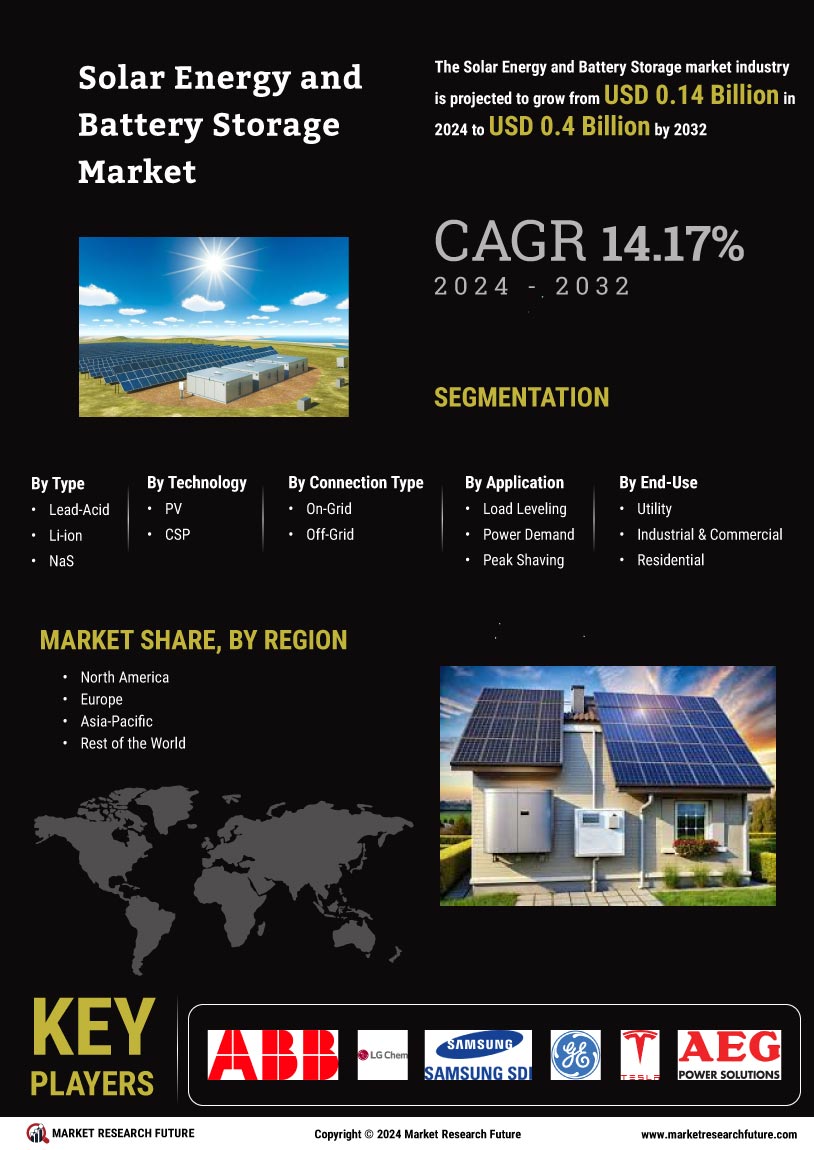
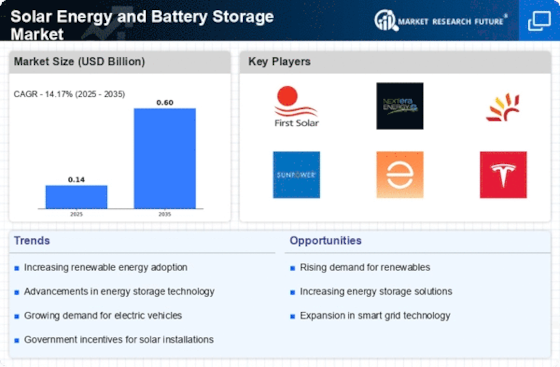
As per MRFR Analysis, the Global Solar Energy and Battery Storage Market was valued at 168.47 USD Billion in 2023 and is projected to reach 600.2 USD Billion by 2035, reflecting a CAGR of 11.17% from 2025 to 2035. The market is driven by increasing demand for renewable energy, technological advancements, and supportive government policies aimed at reducing greenhouse gas emissions.
Key Market Trends & Highlights
The Solar Energy and Battery Storage Market is witnessing significant momentum due to various factors.
- Market size in 2024: 187.29 USD Billion; driven by residential (40.0 USD Billion), commercial (50.0 USD Billion), and utility (97.29 USD Billion) sectors.
- Global renewable energy capacity reached 3,064 Gigawatts in 2020, with solar energy accounting for a substantial share.
- Efficiency of solar panels improved from around 15% in the early 2000s to over 22% today.
- North America leads the market with a valuation of 70.0 USD Billion in 2024.
Market Size & Forecast
2023 Market Size: USD 168.47 Billion
2024 Market Size: USD 187.29 Billion
2035 Market Size: USD 600.2 Billion
CAGR (2025-2035): 11.17%
Largest Regional Market Share in 2024: North America.
Major Players
Key players include ABB, NextEra Energy, Brookfield Renewable Partners, Vivint Solar, LONGi Green Energy, Tesla, JinkoSolar, Sunrun, Enphase Energy, BYD, Trina Solar, Canadian Solar, First Solar, LG Energy Solution, and SMA Solar Technology.
Key Solar Energy and Battery Storage Market Trends Highlighted
The Solar Energy and Battery Storage Market is witnessing significant trends driven by the growing demand for renewable energy sources and advancements in technology. One of the key market drivers is the increasing commitment from governments around the world to reduce carbon emissions, with many nations setting ambitious renewable energy targets. This push towards sustainability is fostering investments in solar energy and battery storage systems, leading to greater adoption among residential, commercial, and industrial sectors. Opportunities to be explored include the integration of solar energy systems with energy storage solutions, which enhances grid reliability and allows for better management of energy supply and demand.
The declining costs of solar photovoltaic panels and battery technologies are also expanding access to solar energy, making it a viable option for more consumers and businesses.ย In recent times, the trend towards decentralized energy generation is gaining momentum, where individuals and communities can harness solar power and store it for personal use, reducing dependence on traditional power grids.ย
Additionally, the rise of electric vehicles is creating synergies between solar energy and battery storage, leading to innovative solutions that enhance energy efficiency. Countries are also focusing on developing smart grids, which will further support the integration of renewable sources into the energy mix.
The emphasis on energy storage is crucial, as it allows for the effective use of solar power, ensuring energy availability even during non-productive hours. Hence, the Solar Energy and Battery Storage Market is not only aligning with environmental goals but also driving technological advancements and economic growth.

Source: Primary Research, Secondary Research, MRFR Database and Analyst Review
Solar Energy and Battery Storage Market Drivers
Increasing Adoption of Renewable Energy Sources
The transition towards renewable energy sources is gaining significant momentum globally. Governments worldwide have set ambitious targets to reduce carbon emissions, driving demand for renewable energy solutions like solar energy. For instance, the Solar Energy and Battery Storage Market Industry is bolstered by initiatives from various governments aiming for net-zero emissions by 2050. According to the International Renewable Energy Agency, renewables are projected to represent about 86.5% of global power generation by 2050, highlighting a major shift in energy production.
Countries such as Germany and China are leading this charge, with Germany's feed-in tariffs and China's substantial investments bolstering the transition. In optimism fueled by these renewable commitments, the global solar market is expected to grow, driving the adoption of both solar energy and battery storage technologies as complementary solutions.
Technological Advancements in Solar Energy and Battery Storage
The continuous advancement in solar technologies, including photovoltaic cells and battery storage systems, is significantly contributing to the growth of the Solar Energy and Battery Storage Market Industry. Innovative solutions, such as perovskite solar cells, are reported to enhance the efficiency of solar panels, while battery technologies are also evolving, with improvements noted in energy density and charging speeds. For instance, Tesla's development of high-performance lithium-ion batteries has made energy storage more viable, making solar energy more reliable and accessible.
The Department of Energy in the United States projects that battery costs could decline by up to 66% by 2030, leading to widespread adoption. Thus, significant technological advancements are expected to spur increased investment in solar and battery solutions.
Falling Costs of Solar Installation and Battery Systems
The cost of solar energy installations and battery systems has seen a substantial decline over the past decade, making these technologies more accessible to consumers and businesses alike. According to the International Energy Agency, between 2010 and 2020, the cost of solar photovoltaic systems fell by nearly 90%. The downward trend in pricing is largely driven by increased competition in the market, economies of scale, and advancements in manufacturing processes.
Major players like First Solar and SunPower play a crucial role in setting competitive pricing, thus expanding market penetration. As solar energy becomes more affordable, more individuals and corporations are likely to invest, which will contribute to the growth of the Solar Energy and Battery Storage Market Industry.
Solar Energy and Battery Storage Market Segment Insights
Solar Energy and Battery Storage Market Application Insightsย ย
The Solar Energy and Battery Storage Market showcases significant potential and versatility across various applications, primarily categorized into Residential, Commercial, and Utility sectors. In 2024, the total market value is poised at 187.29 USD Billion, a reflection of the growing adoption of solar technologies and battery storage systems across multiple usage areas. Delving into the specifics, the Residential segment alone is anticipated to generate a market value of 48.0 USD Billion in 2024, rising to 160.0 USD Billion by 2035. This growth trajectory emphasizes the increasing reliance of homeowners on renewable energy sources, driven by rising electricity costs and a collective push toward sustainability.
Conversely, the Commercial segment is expected to command a market valuation of 35.0 USD Billion in 2024, which will reach approximately 115.0 USD Billion by 2035. This reflects a growing trend among businesses seeking energy independence and reduced operational costs while enhancing their environmental footprint. The embrace of solar energy within commercial settings is vital, as these establishments contribute significantly to energy consumption on a global scale.
The Utility segment, dominating the market with a valuation of 104.29 USD Billion in 2024 and projected to increase to 325.2 USD Billion by 2035, demonstrates the highest demand for large-scale solar power installations and energy storage solutions. The majority holding of this sector indicates the strong commitment from energy providers to transition towards renewable energy sources and meet regulatory sustainability mandates. This focus not only supports grid stability but also addresses the increasing need for clean energy to cater to growing electricity demands.
The market growth in these applications is fueled by advancements in technology, declining costs of solar panels and battery systems, and supportive government policies geared towards green energy initiatives. The segmentation in the Solar Energy and Battery Storage Market highlights the thrust towards renewable energy adoption on both micro and macro levels, showcasing opportunities for businesses and households to capitalize on enhanced energy efficiency and cost savings. These insights into the application-based market segmentation underscore its critical role in shaping a sustainable energy future globally.

Source: Primary Research, Secondary Research, MRFR Database and Analyst Review
Solar Energy and Battery Storage Market Battery Type Insightsย ย
The Solar Energy and Battery Storage Market is experiencing significant growth, particularly in the Battery Type segment, which plays a crucial role in optimizing solar energy utilization. By 2024, the market is projected to be valued at 187.29 billion USD, underscoring the increasing importance of efficient battery solutions. Within this segment, Lithium-Ion batteries have gained prominence due to their high energy density and cost-effectiveness, making them the preferred choice for various applications. Lead-Acid batteries, known for their reliability and affordability, remain a substantial player, especially in traditional energy storage solutions.
Flow Batteries are gaining traction, thanks to their scalability and potential for long-duration energy storage, which aligns well with the intermittent nature of solar energy generation. Meanwhile, Nickel-Cadmium batteries, although less common now, offer advantages in specific applications where performance in extreme temperatures is necessary. Overall, the Solar Energy and Battery Storage Market data indicates that these battery types are essential in driving the industry's growth, addressing challenges related to energy storage, and contributing to the transition towards renewable energy sources.
Global trends show that investments in sustainable energy and battery technology are on the rise, creating favorable opportunities for innovation and expansion.
Solar Energy and Battery Storage Market Technology Insightsย ย
The Solar Energy and Battery Storage Market is poised for significant growth, driven by advancements in technology and increasing emphasis on renewable energy sources. By 2024, the market is expected to reach a valuation of 187.29 billion USD, with various technologies playing a pivotal role. The Solar Photovoltaic segment stands out due to its widespread adoption and efficiency in energy conversion, making it a cornerstone in the market. Concentrated Solar Power technology is also gaining traction, as it allows for energy generation during non-sunny hours through thermal storage.
Solar Thermal systems continue to be essential for large-scale heating applications, enhancing energy efficiency in residential and industrial sectors. The anticipated evolution in these technologies aligns with rising global energy demands and governmental support for clean energy initiatives. The market is set to capitalize on these trends, presenting numerous opportunities for innovation, though challenges such as integration with existing infrastructure and initial investment costs remain. Overall, the Solar Energy and Battery Storage Market segmentation emphasizes a robust growth trajectory, with each technology segment contributing uniquely to its advancement and sustainability.
Solar Energy and Battery Storage Market End Use Insightsย ย
The Solar Energy and Battery Storage Market is experiencing substantial growth, with a market valuation of 187.29 USD Billion in 2024, reflecting a strong demand across various End Use applications. The segmentation within this market includes Grid-tied, Off-grid, and Hybrid systems, each contributing uniquely to the overall market dynamics. Grid-tied systems are pivotal as they connect directly to the electricity grid, enabling users to sell excess energy back to the grid, which enhances their economic viability. Off-grid systems cater primarily to remote areas lacking grid access, and they play a significant role in enhancing energy accessibility, particularly in developing regions.
Hybrid systems integrate both grid-connected and off-grid capabilities, offering flexibility and reliability, which is crucial for consumers looking for sustainable energy solutions. The sustained increase in renewable energy adoption and the need for energy independence are key growth drivers, while challenges like high initial investment costs and regulatory barriers pose hurdles. The Solar Energy and Battery Storage Market revenue is projected to continue its growth trajectory, supported by technological advancements and favorable government policies promoting clean energy usage.
Solar Energy and Battery Storage Market Regional Insightsย ย
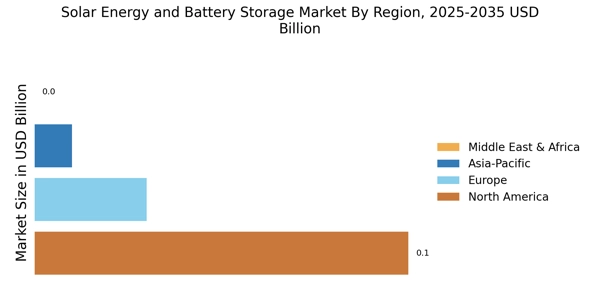
The Regional segment of the Solar Energy and Battery Storage Market shows robust growth across various regions, reflecting a shift towards sustainable energy solutions. By 2024, North America is expected to reach a value of 45.0 USD Billion, positioning it as a key player, with a projected increase to 170.0 USD Billion by 2035, highlighting its significant investment in renewable technologies. Europe closely follows, valued at 40.0 USD Billion in 2024 and anticipated to grow to 130.0 USD Billion by 2035, fueled by stringent regulations and a strong commitment to reducing carbon footprints.
The Asia Pacific region dominates the market with a valuation of 75.0 USD Billion in 2024, expected to surge to 250.0 USD Billion by 2035, driven by rapid industrialization and increasing energy demands in countries like China and India. South America, while smaller, is projected to grow from 12.0 USD Billion in 2024 to 35.0 USD Billion in 2035, capitalizing on its vast solar resources. The Middle East and Africa region, despite its lower valuation at 15.29 USD Billion in 2024, is showing potential due to rising investments in renewable projects.
Overall, the Solar Energy and Battery Storage Market segmentation reveals that North America and Asia Pacific are major contributors, reflecting their strategic initiatives and technological advancements in the renewable energy sector.

Source: Primary Research, Secondary Research, MRFR Database and Analyst Review
Solar Energy and Battery Storage Market Key Players and Competitive Insights
The Solar Energy and Battery Storage Market is witnessing significant advancements and competitive dynamics driven by the growing demand for renewable energy solutions. With an increasing focus on sustainability and the transition to green energy, various players are striving to enhance their product offerings and technological capabilities. The competitive landscape is characterized by innovation, strategic partnerships, and investments in research and development. Companies are leveraging government incentives and rising consumer awareness to expand their market reach and improve their operational efficiencies in solar energy and battery storage systems, presenting a dynamic backdrop for competition. The integration of battery storage with solar energy solutions is becoming a crucial element in this sector, allowing for optimized energy usage and providing consumers with reliable energy options.
Sungrow has established itself as a strong contender in the Solar Energy and Battery Storage Market, noted for its innovative inverter technology and energy storage solutions. The company has a significant global presence, marking its footprint with both utility-scale and residential-level deployments. Sungrowโs strengths lie in its commitment to research and development, which has enabled the company to maintain a competitive edge through technological advancements in inverter efficiency and energy management. Furthermore, the brand emphasizes sustainability and customer-centric approaches, positioning itself as a reputable provider in the renewable energy sector. Its strategic alliances and collaborations with various partners across the globe further enhance its industry stature, ensuring that it meets the growing demands for energy solutions in various markets.
SunPower, a prominent player in the Solar Energy and Battery Storage Market, is recognized for its high-efficiency solar panels and energy storage systems, serving both residential and commercial customers. The companyโs strengths are amplified by its focus on quality and performance, leading to a solid reputation in the field of solar technology. SunPower has strategically expanded its market presence through various mergers and acquisitions that enhance its technological capabilities and distribution networks globally. The broad range of key products and services includes solar panels, battery storage solutions, and sophisticated energy management systems designed to optimize energy consumption. The firmโs dedication to innovation is exemplified by its continuous investments in advanced solar technology and strong customer service initiatives, which position it favorably in the competitive landscape of solar energy and battery storage solutions across different regions.
Key Companies in the Solar Energy and Battery Storage Market Include:
- Sungrow
- SunPower
- Nextera Energy
- Brookfield Renewable Partners
- Trina Solar
- Enphase Energy
- BYD
- SolarEdge Technologies
- Tesla
- First Solar
- JinkoSolar
- Vivint Solar
- LG Energy Solution
- NIO
- Canadian Solar
Solar Energy and Battery Storage Market Industry Developments
In recent months, the Solar Energy and Battery Storage Market has witnessed significant developments. In September 2023, First Solar announced plans to expand its manufacturing capacity in the United States, emphasizing its commitment to domestic production of solar panels. This expansion aligns with the increasing domestic energy requirements and government incentives. Simultaneously, in October 2023, Tesla launched upgraded versions of its solar products and energy storage solutions, enhancing efficiency and integrating with the electric vehicle ecosystem, which bolsters its position in the competitive market. Furthermore, in August 2023, Enphase Energy entered into a partnership with BYD to promote combined solar and energy storage solutions, aiming to increase market penetration in renewable energy sectors.
In terms of mergers and acquisitions, Brookfield Renewable Partners completed the acquisition of a large-scale solar project in California from a well-known solar developer in July 2023, reflecting the ongoing trend of consolidation in the sector. Furthermore, Trina Solar and JinkoSolar continue to report increasing revenues, driven by rising demands for solar installations globally. With these advancements, the market is positioned for notable growth, with ongoing investments shaping the future landscape of renewable energy technologies.
Report Attribute/Metric
|
Details
|
Market Size 2023
|
168.47 (USD Billion)
|
Market Size 2024
|
187.29 (USD Billion)
|
Market Size 2035
|
600.2 (USD Billion)
|
Compound Annual Growth Rate (CAGR)
|
11.17% (2025 - 2035)
|
Report Coverage
|
Revenue Forecast, Competitive Landscape, Growth Factors, and Trends
|
Base Year
|
2024
|
Market Forecast Period
|
2025 - 2035
|
Historical Data
|
2019 - 2024
|
Market Forecast Units
|
USD Billion
|
Key Companies Profiled
|
Sungrow, SunPower, Nextera Energy, Brookfield Renewable Partners, Trina Solar, Enphase Energy, BYD, SolarEdge Technologies, Tesla, First Solar, JinkoSolar, Vivint Solar, LG Energy Solution, NIO, Canadian Solar
|
Segments Covered
|
Application, Battery Type, Technology, End Use, Regional
|
Key Market Opportunities
|
Rising demand for renewable energy, Government incentives and subsidies, Technological advancements in storage, Increasing electric vehicle adoption, Expansion in emerging markets
|
Key Market Dynamics
|
government regulations and incentives, technological advancements, increasing energy demand, decreasing battery prices, environmental sustainability focus
|
Countries Covered
|
North America, Europe, APAC, South America, MEA
|
Solar Energy and Battery Storage Market Highlights:
Frequently Asked Questions (FAQ):
The market is expected to be valued at 187.29 billion USD in 2024.
The market is projected to reach a value of 600.2 billion USD by 2035.
The expected CAGR for the market during this period is 11.17 percent.
North America is expected to have the largest market share valued at 45.0 billion USD in 2024.
The utility application is projected to be valued at 325.2 billion USD by 2035.
Some major players include Sungrow, SunPower, Nextera Energy, Trina Solar, and Enphase Energy.
The commercial segment is expected to reach a market size of 115.0 billion USD in 2035.
Asia Pacific is anticipated to witness the highest growth rate, projected to be valued at 250.0 billion USD by 2035.
The residential application is valued at 48.0 billion USD in 2024.
The market for the Middle East and Africa is estimated to be valued at 15.2 billion USD by 2035.
TABLE OF CONTENTS
1. EXECUTIVE SUMMARY
1.1. SOLAR ENERGY AND BATTERY STORAGE Market Overview
1.2. Key Findings
1.3. Market Segmentation
1.4. Competitive Landscape
1.5. Challenges and Opportunities
1.6. Future Outlook
2. SOLAR ENERGY AND BATTERY STORAGE MARKET INTRODUCTION
2.1. Definition
2.2. Scope of the study
2.2.1. Research Objective
2.2.2. Assumption
2.2.3. Limitations
3. SOLAR ENERGY AND BATTERY STORAGE MARKET RESEARCH METHODOLOGY
3.1. Overview
3.2. Data Mining
3.3. Secondary Research
3.4. Primary Research
3.4.1. Primary Interviews and Information Gathering Process
3.4.2. Breakdown of Primary Respondents
3.5. Forecasting Model
3.6. Market Size Estimation
3.6.1. Bottom-Up Approach
3.6.2. Top-Down Approach
3.7. Data Triangulation
3.8. Validation
4. SOLAR ENERGY AND BATTERY STORAGE MARKET DYNAMICS
4.1. Overview
4.2. Drivers
4.3. Restraints
4.4. Opportunities
5. SOLAR ENERGY AND BATTERY STORAGE MARKET FACTOR ANALYSIS
5.1. Value chain Analysis
5.2. Porter's Five Forces Analysis
5.2.1. Bargaining Power of Suppliers
5.2.2. Bargaining Power of Buyers
5.2.3. Threat of New Entrants
5.2.4. Threat of Substitutes
5.2.5. Intensity of Rivalry
5.3. COVID-19 Impact Analysis
5.3.1. Market Impact Analysis
5.3.2. Regional Impact
5.3.3. Opportunity and Threat Analysis
6. SOLAR ENERGY AND BATTERY STORAGE MARKET, BY APPLICATION (USD BILLION)
6.1. Residential
6.2. Commercial
6.3. Utility
7. SOLAR ENERGY AND BATTERY STORAGE MARKET, BY BATTERY TYPE (USD BILLION)
7.1. Lithium-Ion
7.2. Lead-Acid
7.3. Flow Battery
7.4. Nickel-Cadmium
8. SOLAR ENERGY AND BATTERY STORAGE MARKET, BY TECHNOLOGY (USD BILLION)
8.1. Solar Photovoltaic
8.2. Concentrated Solar Power
8.3. Solar Thermal
9. SOLAR ENERGY AND BATTERY STORAGE MARKET, BY END USE (USD BILLION)
9.1. Grid-tied
9.2. Off-grid
9.3. Hybrid
10. SOLAR ENERGY AND BATTERY STORAGE MARKET, BY REGIONAL (USD BILLION)
10.1. North America
10.1.1. US
10.1.2. Canada
10.2. Europe
10.2.1. Germany
10.2.2. UK
10.2.3. France
10.2.4. Russia
10.2.5. Italy
10.2.6. Spain
10.2.7. Rest of Europe
10.3. APAC
10.3.1. China
10.3.2. India
10.3.3. Japan
10.3.4. South Korea
10.3.5. Malaysia
10.3.6. Thailand
10.3.7. Indonesia
10.3.8. Rest of APAC
10.4. South America
10.4.1. Brazil
10.4.2. Mexico
10.4.3. Argentina
10.4.4. Rest of South America
10.5. MEA
10.5.1. GCC Countries
10.5.2. South Africa
10.5.3. Rest of MEA
11. COMPETITIVE LANDSCAPE
11.1. Overview
11.2. Competitive Analysis
11.3. Market share Analysis
11.4. Major Growth Strategy in the Market
11.5. Competitive Benchmarking
11.6. Leading Players in Terms of Number of Developments in the Market
11.7. Key developments and growth strategies
11.7.1. New Product Launch/Service Deployment
11.7.2. Merger & Acquisitions
11.7.3. Joint Ventures
11.8. Major Players Financial Matrix
11.8.1. Sales and Operating Income
11.8.2. Major Players R&D Expenditure. 2023
12. COMPANY PROFILES
12.1. Sungrow
12.1.1. Financial Overview
12.1.2. Products Offered
12.1.3. Key Developments
12.1.4. SWOT Analysis
12.1.5. Key Strategies
12.2. SunPower
12.2.1. Financial Overview
12.2.2. Products Offered
12.2.3. Key Developments
12.2.4. SWOT Analysis
12.2.5. Key Strategies
12.3. Nextera Energy
12.3.1. Financial Overview
12.3.2. Products Offered
12.3.3. Key Developments
12.3.4. SWOT Analysis
12.3.5. Key Strategies
12.4. Brookfield Renewable Partners
12.4.1. Financial Overview
12.4.2. Products Offered
12.4.3. Key Developments
12.4.4. SWOT Analysis
12.4.5. Key Strategies
12.5. Trina Solar
12.5.1. Financial Overview
12.5.2. Products Offered
12.5.3. Key Developments
12.5.4. SWOT Analysis
12.5.5. Key Strategies
12.6. Enphase Energy
12.6.1. Financial Overview
12.6.2. Products Offered
12.6.3. Key Developments
12.6.4. SWOT Analysis
12.6.5. Key Strategies
12.7. BYD
12.7.1. Financial Overview
12.7.2. Products Offered
12.7.3. Key Developments
12.7.4. SWOT Analysis
12.7.5. Key Strategies
12.8. SolarEdge Technologies
12.8.1. Financial Overview
12.8.2. Products Offered
12.8.3. Key Developments
12.8.4. SWOT Analysis
12.8.5. Key Strategies
12.9. Tesla
12.9.1. Financial Overview
12.9.2. Products Offered
12.9.3. Key Developments
12.9.4. SWOT Analysis
12.9.5. Key Strategies
12.10. First Solar
12.10.1. Financial Overview
12.10.2. Products Offered
12.10.3. Key Developments
12.10.4. SWOT Analysis
12.10.5. Key Strategies
12.11. JinkoSolar
12.11.1. Financial Overview
12.11.2. Products Offered
12.11.3. Key Developments
12.11.4. SWOT Analysis
12.11.5. Key Strategies
12.12. Vivint Solar
12.12.1. Financial Overview
12.12.2. Products Offered
12.12.3. Key Developments
12.12.4. SWOT Analysis
12.12.5. Key Strategies
12.13. LG Energy Solution
12.13.1. Financial Overview
12.13.2. Products Offered
12.13.3. Key Developments
12.13.4. SWOT Analysis
12.13.5. Key Strategies
12.14. NIO
12.14.1. Financial Overview
12.14.2. Products Offered
12.14.3. Key Developments
12.14.4. SWOT Analysis
12.14.5. Key Strategies
12.15. Canadian Solar
12.15.1. Financial Overview
12.15.2. Products Offered
12.15.3. Key Developments
12.15.4. SWOT Analysis
12.15.5. Key Strategies
13. APPENDIX
13.1. References
13.2. Related Reports
LIST OF TABLES
TABLE 1. LIST OF ASSUMPTIONS
TABLE 2. NORTH AMERICA MARKET SIZE ESTIMATES & FORECAST, BY APPLICATION, 2019-2035 (USD BILLIONS)
TABLE 3. NORTH AMERICA MARKET SIZE ESTIMATES & FORECAST, BY BATTERY TYPE, 2019-2035 (USD BILLIONS)
TABLE 4. NORTH AMERICA MARKET SIZE ESTIMATES & FORECAST, BY TECHNOLOGY, 2019-2035 (USD BILLIONS)
TABLE 5. NORTH AMERICA MARKET SIZE ESTIMATES & FORECAST, BY END USE, 2019-2035 (USD BILLIONS)
TABLE 6. NORTH AMERICA MARKET SIZE ESTIMATES & FORECAST, BY REGIONAL, 2019-2035 (USD BILLIONS)
TABLE 7. US MARKET SIZE ESTIMATES & FORECAST, BY APPLICATION, 2019-2035 (USD BILLIONS)
TABLE 8. US MARKET SIZE ESTIMATES & FORECAST, BY BATTERY TYPE, 2019-2035 (USD BILLIONS)
TABLE 9. US MARKET SIZE ESTIMATES & FORECAST, BY TECHNOLOGY, 2019-2035 (USD BILLIONS)
TABLE 10. US MARKET SIZE ESTIMATES & FORECAST, BY END USE, 2019-2035 (USD BILLIONS)
TABLE 11. US MARKET SIZE ESTIMATES & FORECAST, BY REGIONAL, 2019-2035 (USD BILLIONS)
TABLE 12. CANADA MARKET SIZE ESTIMATES & FORECAST, BY APPLICATION, 2019-2035 (USD BILLIONS)
TABLE 13. CANADA MARKET SIZE ESTIMATES & FORECAST, BY BATTERY TYPE, 2019-2035 (USD BILLIONS)
TABLE 14. CANADA MARKET SIZE ESTIMATES & FORECAST, BY TECHNOLOGY, 2019-2035 (USD BILLIONS)
TABLE 15. CANADA MARKET SIZE ESTIMATES & FORECAST, BY END USE, 2019-2035 (USD BILLIONS)
TABLE 16. CANADA MARKET SIZE ESTIMATES & FORECAST, BY REGIONAL, 2019-2035 (USD BILLIONS)
TABLE 17. EUROPE MARKET SIZE ESTIMATES & FORECAST, BY APPLICATION, 2019-2035 (USD BILLIONS)
TABLE 18. EUROPE MARKET SIZE ESTIMATES & FORECAST, BY BATTERY TYPE, 2019-2035 (USD BILLIONS)
TABLE 19. EUROPE MARKET SIZE ESTIMATES & FORECAST, BY TECHNOLOGY, 2019-2035 (USD BILLIONS)
TABLE 20. EUROPE MARKET SIZE ESTIMATES & FORECAST, BY END USE, 2019-2035 (USD BILLIONS)
TABLE 21. EUROPE MARKET SIZE ESTIMATES & FORECAST, BY REGIONAL, 2019-2035 (USD BILLIONS)
TABLE 22. GERMANY MARKET SIZE ESTIMATES & FORECAST, BY APPLICATION, 2019-2035 (USD BILLIONS)
TABLE 23. GERMANY MARKET SIZE ESTIMATES & FORECAST, BY BATTERY TYPE, 2019-2035 (USD BILLIONS)
TABLE 24. GERMANY MARKET SIZE ESTIMATES & FORECAST, BY TECHNOLOGY, 2019-2035 (USD BILLIONS)
TABLE 25. GERMANY MARKET SIZE ESTIMATES & FORECAST, BY END USE, 2019-2035 (USD BILLIONS)
TABLE 26. GERMANY MARKET SIZE ESTIMATES & FORECAST, BY REGIONAL, 2019-2035 (USD BILLIONS)
TABLE 27. UK MARKET SIZE ESTIMATES & FORECAST, BY APPLICATION, 2019-2035 (USD BILLIONS)
TABLE 28. UK MARKET SIZE ESTIMATES & FORECAST, BY BATTERY TYPE, 2019-2035 (USD BILLIONS)
TABLE 29. UK MARKET SIZE ESTIMATES & FORECAST, BY TECHNOLOGY, 2019-2035 (USD BILLIONS)
TABLE 30. UK MARKET SIZE ESTIMATES & FORECAST, BY END USE, 2019-2035 (USD BILLIONS)
TABLE 31. UK MARKET SIZE ESTIMATES & FORECAST, BY REGIONAL, 2019-2035 (USD BILLIONS)
TABLE 32. FRANCE MARKET SIZE ESTIMATES & FORECAST, BY APPLICATION, 2019-2035 (USD BILLIONS)
TABLE 33. FRANCE MARKET SIZE ESTIMATES & FORECAST, BY BATTERY TYPE, 2019-2035 (USD BILLIONS)
TABLE 34. FRANCE MARKET SIZE ESTIMATES & FORECAST, BY TECHNOLOGY, 2019-2035 (USD BILLIONS)
TABLE 35. FRANCE MARKET SIZE ESTIMATES & FORECAST, BY END USE, 2019-2035 (USD BILLIONS)
TABLE 36. FRANCE MARKET SIZE ESTIMATES & FORECAST, BY REGIONAL, 2019-2035 (USD BILLIONS)
TABLE 37. RUSSIA MARKET SIZE ESTIMATES & FORECAST, BY APPLICATION, 2019-2035 (USD BILLIONS)
TABLE 38. RUSSIA MARKET SIZE ESTIMATES & FORECAST, BY BATTERY TYPE, 2019-2035 (USD BILLIONS)
TABLE 39. RUSSIA MARKET SIZE ESTIMATES & FORECAST, BY TECHNOLOGY, 2019-2035 (USD BILLIONS)
TABLE 40. RUSSIA MARKET SIZE ESTIMATES & FORECAST, BY END USE, 2019-2035 (USD BILLIONS)
TABLE 41. RUSSIA MARKET SIZE ESTIMATES & FORECAST, BY REGIONAL, 2019-2035 (USD BILLIONS)
TABLE 42. ITALY MARKET SIZE ESTIMATES & FORECAST, BY APPLICATION, 2019-2035 (USD BILLIONS)
TABLE 43. ITALY MARKET SIZE ESTIMATES & FORECAST, BY BATTERY TYPE, 2019-2035 (USD BILLIONS)
TABLE 44. ITALY MARKET SIZE ESTIMATES & FORECAST, BY TECHNOLOGY, 2019-2035 (USD BILLIONS)
TABLE 45. ITALY MARKET SIZE ESTIMATES & FORECAST, BY END USE, 2019-2035 (USD BILLIONS)
TABLE 46. ITALY MARKET SIZE ESTIMATES & FORECAST, BY REGIONAL, 2019-2035 (USD BILLIONS)
TABLE 47. SPAIN MARKET SIZE ESTIMATES & FORECAST, BY APPLICATION, 2019-2035 (USD BILLIONS)
TABLE 48. SPAIN MARKET SIZE ESTIMATES & FORECAST, BY BATTERY TYPE, 2019-2035 (USD BILLIONS)
TABLE 49. SPAIN MARKET SIZE ESTIMATES & FORECAST, BY TECHNOLOGY, 2019-2035 (USD BILLIONS)
TABLE 50. SPAIN MARKET SIZE ESTIMATES & FORECAST, BY END USE, 2019-2035 (USD BILLIONS)
TABLE 51. SPAIN MARKET SIZE ESTIMATES & FORECAST, BY REGIONAL, 2019-2035 (USD BILLIONS)
TABLE 52. REST OF EUROPE MARKET SIZE ESTIMATES & FORECAST, BY APPLICATION, 2019-2035 (USD BILLIONS)
TABLE 53. REST OF EUROPE MARKET SIZE ESTIMATES & FORECAST, BY BATTERY TYPE, 2019-2035 (USD BILLIONS)
TABLE 54. REST OF EUROPE MARKET SIZE ESTIMATES & FORECAST, BY TECHNOLOGY, 2019-2035 (USD BILLIONS)
TABLE 55. REST OF EUROPE MARKET SIZE ESTIMATES & FORECAST, BY END USE, 2019-2035 (USD BILLIONS)
TABLE 56. REST OF EUROPE MARKET SIZE ESTIMATES & FORECAST, BY REGIONAL, 2019-2035 (USD BILLIONS)
TABLE 57. APAC MARKET SIZE ESTIMATES & FORECAST, BY APPLICATION, 2019-2035 (USD BILLIONS)
TABLE 58. APAC MARKET SIZE ESTIMATES & FORECAST, BY BATTERY TYPE, 2019-2035 (USD BILLIONS)
TABLE 59. APAC MARKET SIZE ESTIMATES & FORECAST, BY TECHNOLOGY, 2019-2035 (USD BILLIONS)
TABLE 60. APAC MARKET SIZE ESTIMATES & FORECAST, BY END USE, 2019-2035 (USD BILLIONS)
TABLE 61. APAC MARKET SIZE ESTIMATES & FORECAST, BY REGIONAL, 2019-2035 (USD BILLIONS)
TABLE 62. CHINA MARKET SIZE ESTIMATES & FORECAST, BY APPLICATION, 2019-2035 (USD BILLIONS)
TABLE 63. CHINA MARKET SIZE ESTIMATES & FORECAST, BY BATTERY TYPE, 2019-2035 (USD BILLIONS)
TABLE 64. CHINA MARKET SIZE ESTIMATES & FORECAST, BY TECHNOLOGY, 2019-2035 (USD BILLIONS)
TABLE 65. CHINA MARKET SIZE ESTIMATES & FORECAST, BY END USE, 2019-2035 (USD BILLIONS)
TABLE 66. CHINA MARKET SIZE ESTIMATES & FORECAST, BY REGIONAL, 2019-2035 (USD BILLIONS)
TABLE 67. INDIA MARKET SIZE ESTIMATES & FORECAST, BY APPLICATION, 2019-2035 (USD BILLIONS)
TABLE 68. INDIA MARKET SIZE ESTIMATES & FORECAST, BY BATTERY TYPE, 2019-2035 (USD BILLIONS)
TABLE 69. INDIA MARKET SIZE ESTIMATES & FORECAST, BY TECHNOLOGY, 2019-2035 (USD BILLIONS)
TABLE 70. INDIA MARKET SIZE ESTIMATES & FORECAST, BY END USE, 2019-2035 (USD BILLIONS)
TABLE 71. INDIA MARKET SIZE ESTIMATES & FORECAST, BY REGIONAL, 2019-2035 (USD BILLIONS)
TABLE 72. JAPAN MARKET SIZE ESTIMATES & FORECAST, BY APPLICATION, 2019-2035 (USD BILLIONS)
TABLE 73. JAPAN MARKET SIZE ESTIMATES & FORECAST, BY BATTERY TYPE, 2019-2035 (USD BILLIONS)
TABLE 74. JAPAN MARKET SIZE ESTIMATES & FORECAST, BY TECHNOLOGY, 2019-2035 (USD BILLIONS)
TABLE 75. JAPAN MARKET SIZE ESTIMATES & FORECAST, BY END USE, 2019-2035 (USD BILLIONS)
TABLE 76. JAPAN MARKET SIZE ESTIMATES & FORECAST, BY REGIONAL, 2019-2035 (USD BILLIONS)
TABLE 77. SOUTH KOREA MARKET SIZE ESTIMATES & FORECAST, BY APPLICATION, 2019-2035 (USD BILLIONS)
TABLE 78. SOUTH KOREA MARKET SIZE ESTIMATES & FORECAST, BY BATTERY TYPE, 2019-2035 (USD BILLIONS)
TABLE 79. SOUTH KOREA MARKET SIZE ESTIMATES & FORECAST, BY TECHNOLOGY, 2019-2035 (USD BILLIONS)
TABLE 80. SOUTH KOREA MARKET SIZE ESTIMATES & FORECAST, BY END USE, 2019-2035 (USD BILLIONS)
TABLE 81. SOUTH KOREA MARKET SIZE ESTIMATES & FORECAST, BY REGIONAL, 2019-2035 (USD BILLIONS)
TABLE 82. MALAYSIA MARKET SIZE ESTIMATES & FORECAST, BY APPLICATION, 2019-2035 (USD BILLIONS)
TABLE 83. MALAYSIA MARKET SIZE ESTIMATES & FORECAST, BY BATTERY TYPE, 2019-2035 (USD BILLIONS)
TABLE 84. MALAYSIA MARKET SIZE ESTIMATES & FORECAST, BY TECHNOLOGY, 2019-2035 (USD BILLIONS)
TABLE 85. MALAYSIA MARKET SIZE ESTIMATES & FORECAST, BY END USE, 2019-2035 (USD BILLIONS)
TABLE 86. MALAYSIA MARKET SIZE ESTIMATES & FORECAST, BY REGIONAL, 2019-2035 (USD BILLIONS)
TABLE 87. THAILAND MARKET SIZE ESTIMATES & FORECAST, BY APPLICATION, 2019-2035 (USD BILLIONS)
TABLE 88. THAILAND MARKET SIZE ESTIMATES & FORECAST, BY BATTERY TYPE, 2019-2035 (USD BILLIONS)
TABLE 89. THAILAND MARKET SIZE ESTIMATES & FORECAST, BY TECHNOLOGY, 2019-2035 (USD BILLIONS)
TABLE 90. THAILAND MARKET SIZE ESTIMATES & FORECAST, BY END USE, 2019-2035 (USD BILLIONS)
TABLE 91. THAILAND MARKET SIZE ESTIMATES & FORECAST, BY REGIONAL, 2019-2035 (USD BILLIONS)
TABLE 92. INDONESIA MARKET SIZE ESTIMATES & FORECAST, BY APPLICATION, 2019-2035 (USD BILLIONS)
TABLE 93. INDONESIA MARKET SIZE ESTIMATES & FORECAST, BY BATTERY TYPE, 2019-2035 (USD BILLIONS)
TABLE 94. INDONESIA MARKET SIZE ESTIMATES & FORECAST, BY TECHNOLOGY, 2019-2035 (USD BILLIONS)
TABLE 95. INDONESIA MARKET SIZE ESTIMATES & FORECAST, BY END USE, 2019-2035 (USD BILLIONS)
TABLE 96. INDONESIA MARKET SIZE ESTIMATES & FORECAST, BY REGIONAL, 2019-2035 (USD BILLIONS)
TABLE 97. REST OF APAC MARKET SIZE ESTIMATES & FORECAST, BY APPLICATION, 2019-2035 (USD BILLIONS)
TABLE 98. REST OF APAC MARKET SIZE ESTIMATES & FORECAST, BY BATTERY TYPE, 2019-2035 (USD BILLIONS)
TABLE 99. REST OF APAC MARKET SIZE ESTIMATES & FORECAST, BY TECHNOLOGY, 2019-2035 (USD BILLIONS)
TABLE 100. REST OF APAC MARKET SIZE ESTIMATES & FORECAST, BY END USE, 2019-2035 (USD BILLIONS)
TABLE 101. REST OF APAC MARKET SIZE ESTIMATES & FORECAST, BY REGIONAL, 2019-2035 (USD BILLIONS)
TABLE 102. SOUTH AMERICA MARKET SIZE ESTIMATES & FORECAST, BY APPLICATION, 2019-2035 (USD BILLIONS)
TABLE 103. SOUTH AMERICA MARKET SIZE ESTIMATES & FORECAST, BY BATTERY TYPE, 2019-2035 (USD BILLIONS)
TABLE 104. SOUTH AMERICA MARKET SIZE ESTIMATES & FORECAST, BY TECHNOLOGY, 2019-2035 (USD BILLIONS)
TABLE 105. SOUTH AMERICA MARKET SIZE ESTIMATES & FORECAST, BY END USE, 2019-2035 (USD BILLIONS)
TABLE 106. SOUTH AMERICA MARKET SIZE ESTIMATES & FORECAST, BY REGIONAL, 2019-2035 (USD BILLIONS)
TABLE 107. BRAZIL MARKET SIZE ESTIMATES & FORECAST, BY APPLICATION, 2019-2035 (USD BILLIONS)
TABLE 108. BRAZIL MARKET SIZE ESTIMATES & FORECAST, BY BATTERY TYPE, 2019-2035 (USD BILLIONS)
TABLE 109. BRAZIL MARKET SIZE ESTIMATES & FORECAST, BY TECHNOLOGY, 2019-2035 (USD BILLIONS)
TABLE 110. BRAZIL MARKET SIZE ESTIMATES & FORECAST, BY END USE, 2019-2035 (USD BILLIONS)
TABLE 111. BRAZIL MARKET SIZE ESTIMATES & FORECAST, BY REGIONAL, 2019-2035 (USD BILLIONS)
TABLE 112. MEXICO MARKET SIZE ESTIMATES & FORECAST, BY APPLICATION, 2019-2035 (USD BILLIONS)
TABLE 113. MEXICO MARKET SIZE ESTIMATES & FORECAST, BY BATTERY TYPE, 2019-2035 (USD BILLIONS)
TABLE 114. MEXICO MARKET SIZE ESTIMATES & FORECAST, BY TECHNOLOGY, 2019-2035 (USD BILLIONS)
TABLE 115. MEXICO MARKET SIZE ESTIMATES & FORECAST, BY END USE, 2019-2035 (USD BILLIONS)
TABLE 116. MEXICO MARKET SIZE ESTIMATES & FORECAST, BY REGIONAL, 2019-2035 (USD BILLIONS)
TABLE 117. ARGENTINA MARKET SIZE ESTIMATES & FORECAST, BY APPLICATION, 2019-2035 (USD BILLIONS)
TABLE 118. ARGENTINA MARKET SIZE ESTIMATES & FORECAST, BY BATTERY TYPE, 2019-2035 (USD BILLIONS)
TABLE 119. ARGENTINA MARKET SIZE ESTIMATES & FORECAST, BY TECHNOLOGY, 2019-2035 (USD BILLIONS)
TABLE 120. ARGENTINA MARKET SIZE ESTIMATES & FORECAST, BY END USE, 2019-2035 (USD BILLIONS)
TABLE 121. ARGENTINA MARKET SIZE ESTIMATES & FORECAST, BY REGIONAL, 2019-2035 (USD BILLIONS)
TABLE 122. REST OF SOUTH AMERICA MARKET SIZE ESTIMATES & FORECAST, BY APPLICATION, 2019-2035 (USD BILLIONS)
TABLE 123. REST OF SOUTH AMERICA MARKET SIZE ESTIMATES & FORECAST, BY BATTERY TYPE, 2019-2035 (USD BILLIONS)
TABLE 124. REST OF SOUTH AMERICA MARKET SIZE ESTIMATES & FORECAST, BY TECHNOLOGY, 2019-2035 (USD BILLIONS)
TABLE 125. REST OF SOUTH AMERICA MARKET SIZE ESTIMATES & FORECAST, BY END USE, 2019-2035 (USD BILLIONS)
TABLE 126. REST OF SOUTH AMERICA MARKET SIZE ESTIMATES & FORECAST, BY REGIONAL, 2019-2035 (USD BILLIONS)
TABLE 127. MEA MARKET SIZE ESTIMATES & FORECAST, BY APPLICATION, 2019-2035 (USD BILLIONS)
TABLE 128. MEA MARKET SIZE ESTIMATES & FORECAST, BY BATTERY TYPE, 2019-2035 (USD BILLIONS)
TABLE 129. MEA MARKET SIZE ESTIMATES & FORECAST, BY TECHNOLOGY, 2019-2035 (USD BILLIONS)
TABLE 130. MEA MARKET SIZE ESTIMATES & FORECAST, BY END USE, 2019-2035 (USD BILLIONS)
TABLE 131. MEA MARKET SIZE ESTIMATES & FORECAST, BY REGIONAL, 2019-2035 (USD BILLIONS)
TABLE 132. GCC COUNTRIES MARKET SIZE ESTIMATES & FORECAST, BY APPLICATION, 2019-2035 (USD BILLIONS)
TABLE 133. GCC COUNTRIES MARKET SIZE ESTIMATES & FORECAST, BY BATTERY TYPE, 2019-2035 (USD BILLIONS)
TABLE 134. GCC COUNTRIES MARKET SIZE ESTIMATES & FORECAST, BY TECHNOLOGY, 2019-2035 (USD BILLIONS)
TABLE 135. GCC COUNTRIES MARKET SIZE ESTIMATES & FORECAST, BY END USE, 2019-2035 (USD BILLIONS)
TABLE 136. GCC COUNTRIES MARKET SIZE ESTIMATES & FORECAST, BY REGIONAL, 2019-2035 (USD BILLIONS)
TABLE 137. SOUTH AFRICA MARKET SIZE ESTIMATES & FORECAST, BY APPLICATION, 2019-2035 (USD BILLIONS)
TABLE 138. SOUTH AFRICA MARKET SIZE ESTIMATES & FORECAST, BY BATTERY TYPE, 2019-2035 (USD BILLIONS)
TABLE 139. SOUTH AFRICA MARKET SIZE ESTIMATES & FORECAST, BY TECHNOLOGY, 2019-2035 (USD BILLIONS)
TABLE 140. SOUTH AFRICA MARKET SIZE ESTIMATES & FORECAST, BY END USE, 2019-2035 (USD BILLIONS)
TABLE 141. SOUTH AFRICA MARKET SIZE ESTIMATES & FORECAST, BY REGIONAL, 2019-2035 (USD BILLIONS)
TABLE 142. REST OF MEA MARKET SIZE ESTIMATES & FORECAST, BY APPLICATION, 2019-2035 (USD BILLIONS)
TABLE 143. REST OF MEA MARKET SIZE ESTIMATES & FORECAST, BY BATTERY TYPE, 2019-2035 (USD BILLIONS)
TABLE 144. REST OF MEA MARKET SIZE ESTIMATES & FORECAST, BY TECHNOLOGY, 2019-2035 (USD BILLIONS)
TABLE 145. REST OF MEA MARKET SIZE ESTIMATES & FORECAST, BY END USE, 2019-2035 (USD BILLIONS)
TABLE 146. REST OF MEA MARKET SIZE ESTIMATES & FORECAST, BY REGIONAL, 2019-2035 (USD BILLIONS)
TABLE 147. PRODUCT LAUNCH/PRODUCT DEVELOPMENT/APPROVAL
TABLE 148. ACQUISITION/PARTNERSHIP
LIST OF FIGURES
FIGURE 1. MARKET SYNOPSIS
FIGURE 2. NORTH AMERICA MARKET ANALYSIS
FIGURE 3. US MARKET ANALYSIS BY APPLICATION
FIGURE 4. US MARKET ANALYSIS BY BATTERY TYPE
FIGURE 5. US MARKET ANALYSIS BY TECHNOLOGY
FIGURE 6. US MARKET ANALYSIS BY END USE
FIGURE 7. US MARKET ANALYSIS BY REGIONAL
FIGURE 8. CANADA MARKET ANALYSIS BY APPLICATION
FIGURE 9. CANADA MARKET ANALYSIS BY BATTERY TYPE
FIGURE 10. CANADA MARKET ANALYSIS BY TECHNOLOGY
FIGURE 11. CANADA MARKET ANALYSIS BY END USE
FIGURE 12. CANADA MARKET ANALYSIS BY REGIONAL
FIGURE 13. EUROPE MARKET ANALYSIS
FIGURE 14. GERMANY MARKET ANALYSIS BY APPLICATION
FIGURE 15. GERMANY MARKET ANALYSIS BY BATTERY TYPE
FIGURE 16. GERMANY MARKET ANALYSIS BY TECHNOLOGY
FIGURE 17. GERMANY MARKET ANALYSIS BY END USE
FIGURE 18. GERMANY MARKET ANALYSIS BY REGIONAL
FIGURE 19. UK MARKET ANALYSIS BY APPLICATION
FIGURE 20. UK MARKET ANALYSIS BY BATTERY TYPE
FIGURE 21. UK MARKET ANALYSIS BY TECHNOLOGY
FIGURE 22. UK MARKET ANALYSIS BY END USE
FIGURE 23. UK MARKET ANALYSIS BY REGIONAL
FIGURE 24. FRANCE MARKET ANALYSIS BY APPLICATION
FIGURE 25. FRANCE MARKET ANALYSIS BY BATTERY TYPE
FIGURE 26. FRANCE MARKET ANALYSIS BY TECHNOLOGY
FIGURE 27. FRANCE MARKET ANALYSIS BY END USE
FIGURE 28. FRANCE MARKET ANALYSIS BY REGIONAL
FIGURE 29. RUSSIA MARKET ANALYSIS BY APPLICATION
FIGURE 30. RUSSIA MARKET ANALYSIS BY BATTERY TYPE
FIGURE 31. RUSSIA MARKET ANALYSIS BY TECHNOLOGY
FIGURE 32. RUSSIA MARKET ANALYSIS BY END USE
FIGURE 33. RUSSIA MARKET ANALYSIS BY REGIONAL
FIGURE 34. ITALY MARKET ANALYSIS BY APPLICATION
FIGURE 35. ITALY MARKET ANALYSIS BY BATTERY TYPE
FIGURE 36. ITALY MARKET ANALYSIS BY TECHNOLOGY
FIGURE 37. ITALY MARKET ANALYSIS BY END USE
FIGURE 38. ITALY MARKET ANALYSIS BY REGIONAL
FIGURE 39. SPAIN MARKET ANALYSIS BY APPLICATION
FIGURE 40. SPAIN MARKET ANALYSIS BY BATTERY TYPE
FIGURE 41. SPAIN MARKET ANALYSIS BY TECHNOLOGY
FIGURE 42. SPAIN MARKET ANALYSIS BY END USE
FIGURE 43. SPAIN MARKET ANALYSIS BY REGIONAL
FIGURE 44. REST OF EUROPE MARKET ANALYSIS BY APPLICATION
FIGURE 45. REST OF EUROPE MARKET ANALYSIS BY BATTERY TYPE
FIGURE 46. REST OF EUROPE MARKET ANALYSIS BY TECHNOLOGY
FIGURE 47. REST OF EUROPE MARKET ANALYSIS BY END USE
FIGURE 48. REST OF EUROPE MARKET ANALYSIS BY REGIONAL
FIGURE 49. APAC MARKET ANALYSIS
FIGURE 50. CHINA MARKET ANALYSIS BY APPLICATION
FIGURE 51. CHINA MARKET ANALYSIS BY BATTERY TYPE
FIGURE 52. CHINA MARKET ANALYSIS BY TECHNOLOGY
FIGURE 53. CHINA MARKET ANALYSIS BY END USE
FIGURE 54. CHINA MARKET ANALYSIS BY REGIONAL
FIGURE 55. INDIA MARKET ANALYSIS BY APPLICATION
FIGURE 56. INDIA MARKET ANALYSIS BY BATTERY TYPE
FIGURE 57. INDIA MARKET ANALYSIS BY TECHNOLOGY
FIGURE 58. INDIA MARKET ANALYSIS BY END USE
FIGURE 59. INDIA MARKET ANALYSIS BY REGIONAL
FIGURE 60. JAPAN MARKET ANALYSIS BY APPLICATION
FIGURE 61. JAPAN MARKET ANALYSIS BY BATTERY TYPE
FIGURE 62. JAPAN MARKET ANALYSIS BY TECHNOLOGY
FIGURE 63. JAPAN MARKET ANALYSIS BY END USE
FIGURE 64. JAPAN MARKET ANALYSIS BY REGIONAL
FIGURE 65. SOUTH KOREA MARKET ANALYSIS BY APPLICATION
FIGURE 66. SOUTH KOREA MARKET ANALYSIS BY BATTERY TYPE
FIGURE 67. SOUTH KOREA MARKET ANALYSIS BY TECHNOLOGY
FIGURE 68. SOUTH KOREA MARKET ANALYSIS BY END USE
FIGURE 69. SOUTH KOREA MARKET ANALYSIS BY REGIONAL
FIGURE 70. MALAYSIA MARKET ANALYSIS BY APPLICATION
FIGURE 71. MALAYSIA MARKET ANALYSIS BY BATTERY TYPE
FIGURE 72. MALAYSIA MARKET ANALYSIS BY TECHNOLOGY
FIGURE 73. MALAYSIA MARKET ANALYSIS BY END USE
FIGURE 74. MALAYSIA MARKET ANALYSIS BY REGIONAL
FIGURE 75. THAILAND MARKET ANALYSIS BY APPLICATION
FIGURE 76. THAILAND MARKET ANALYSIS BY BATTERY TYPE
FIGURE 77. THAILAND MARKET ANALYSIS BY TECHNOLOGY
FIGURE 78. THAILAND MARKET ANALYSIS BY END USE
FIGURE 79. THAILAND MARKET ANALYSIS BY REGIONAL
FIGURE 80. INDONESIA MARKET ANALYSIS BY APPLICATION
FIGURE 81. INDONESIA MARKET ANALYSIS BY BATTERY TYPE
FIGURE 82. INDONESIA MARKET ANALYSIS BY TECHNOLOGY
FIGURE 83. INDONESIA MARKET ANALYSIS BY END USE
FIGURE 84. INDONESIA MARKET ANALYSIS BY REGIONAL
FIGURE 85. REST OF APAC MARKET ANALYSIS BY APPLICATION
FIGURE 86. REST OF APAC MARKET ANALYSIS BY BATTERY TYPE
FIGURE 87. REST OF APAC MARKET ANALYSIS BY TECHNOLOGY
FIGURE 88. REST OF APAC MARKET ANALYSIS BY END USE
FIGURE 89. REST OF APAC MARKET ANALYSIS BY REGIONAL
FIGURE 90. SOUTH AMERICA MARKET ANALYSIS
FIGURE 91. BRAZIL MARKET ANALYSIS BY APPLICATION
FIGURE 92. BRAZIL MARKET ANALYSIS BY BATTERY TYPE
FIGURE 93. BRAZIL MARKET ANALYSIS BY TECHNOLOGY
FIGURE 94. BRAZIL MARKET ANALYSIS BY END USE
FIGURE 95. BRAZIL MARKET ANALYSIS BY REGIONAL
FIGURE 96. MEXICO MARKET ANALYSIS BY APPLICATION
FIGURE 97. MEXICO MARKET ANALYSIS BY BATTERY TYPE
FIGURE 98. MEXICO MARKET ANALYSIS BY TECHNOLOGY
FIGURE 99. MEXICO MARKET ANALYSIS BY END USE
FIGURE 100. MEXICO MARKET ANALYSIS BY REGIONAL
FIGURE 101. ARGENTINA MARKET ANALYSIS BY APPLICATION
FIGURE 102. ARGENTINA MARKET ANALYSIS BY BATTERY TYPE
FIGURE 103. ARGENTINA MARKET ANALYSIS BY TECHNOLOGY
FIGURE 104. ARGENTINA MARKET ANALYSIS BY END USE
FIGURE 105. ARGENTINA MARKET ANALYSIS BY REGIONAL
FIGURE 106. REST OF SOUTH AMERICA MARKET ANALYSIS BY APPLICATION
FIGURE 107. REST OF SOUTH AMERICA MARKET ANALYSIS BY BATTERY TYPE
FIGURE 108. REST OF SOUTH AMERICA MARKET ANALYSIS BY TECHNOLOGY
FIGURE 109. REST OF SOUTH AMERICA MARKET ANALYSIS BY END USE
FIGURE 110. REST OF SOUTH AMERICA MARKET ANALYSIS BY REGIONAL
FIGURE 111. MEA MARKET ANALYSIS
FIGURE 112. GCC COUNTRIES MARKET ANALYSIS BY APPLICATION
FIGURE 113. GCC COUNTRIES MARKET ANALYSIS BY BATTERY TYPE
FIGURE 114. GCC COUNTRIES MARKET ANALYSIS BY TECHNOLOGY
FIGURE 115. GCC COUNTRIES MARKET ANALYSIS BY END USE
FIGURE 116. GCC COUNTRIES MARKET ANALYSIS BY REGIONAL
FIGURE 117. SOUTH AFRICA MARKET ANALYSIS BY APPLICATION
FIGURE 118. SOUTH AFRICA MARKET ANALYSIS BY BATTERY TYPE
FIGURE 119. SOUTH AFRICA MARKET ANALYSIS BY TECHNOLOGY
FIGURE 120. SOUTH AFRICA MARKET ANALYSIS BY END USE
FIGURE 121. SOUTH AFRICA MARKET ANALYSIS BY REGIONAL
FIGURE 122. REST OF MEA MARKET ANALYSIS BY APPLICATION
FIGURE 123. REST OF MEA MARKET ANALYSIS BY BATTERY TYPE
FIGURE 124. REST OF MEA MARKET ANALYSIS BY TECHNOLOGY
FIGURE 125. REST OF MEA MARKET ANALYSIS BY END USE
FIGURE 126. REST OF MEA MARKET ANALYSIS BY REGIONAL
FIGURE 127. KEY BUYING CRITERIA OF MARKET
FIGURE 128. RESEARCH PROCESS OF MRFR
FIGURE 129. DRO ANALYSIS OF MARKET
FIGURE 130. DRIVERS IMPACT ANALYSIS: MARKET
FIGURE 131. RESTRAINTS IMPACT ANALYSIS: MARKET
FIGURE 132. SUPPLY / VALUE CHAIN: MARKET
FIGURE 133. MARKET, BY APPLICATION, 2025 (% SHARE)
FIGURE 134. MARKET, BY APPLICATION, 2019 TO 2035 (USD Billions)
FIGURE 135. MARKET, BY BATTERY TYPE, 2025 (% SHARE)
FIGURE 136. MARKET, BY BATTERY TYPE, 2019 TO 2035 (USD Billions)
FIGURE 137. MARKET, BY TECHNOLOGY, 2025 (% SHARE)
FIGURE 138. MARKET, BY TECHNOLOGY, 2019 TO 2035 (USD Billions)
FIGURE 139. MARKET, BY END USE, 2025 (% SHARE)
FIGURE 140. MARKET, BY END USE, 2019 TO 2035 (USD Billions)
FIGURE 141. MARKET, BY REGIONAL, 2025 (% SHARE)
FIGURE 142. MARKET, BY REGIONAL, 2019 TO 2035 (USD Billions)
FIGURE 143. BENCHMARKING OF MAJOR COMPETITORS