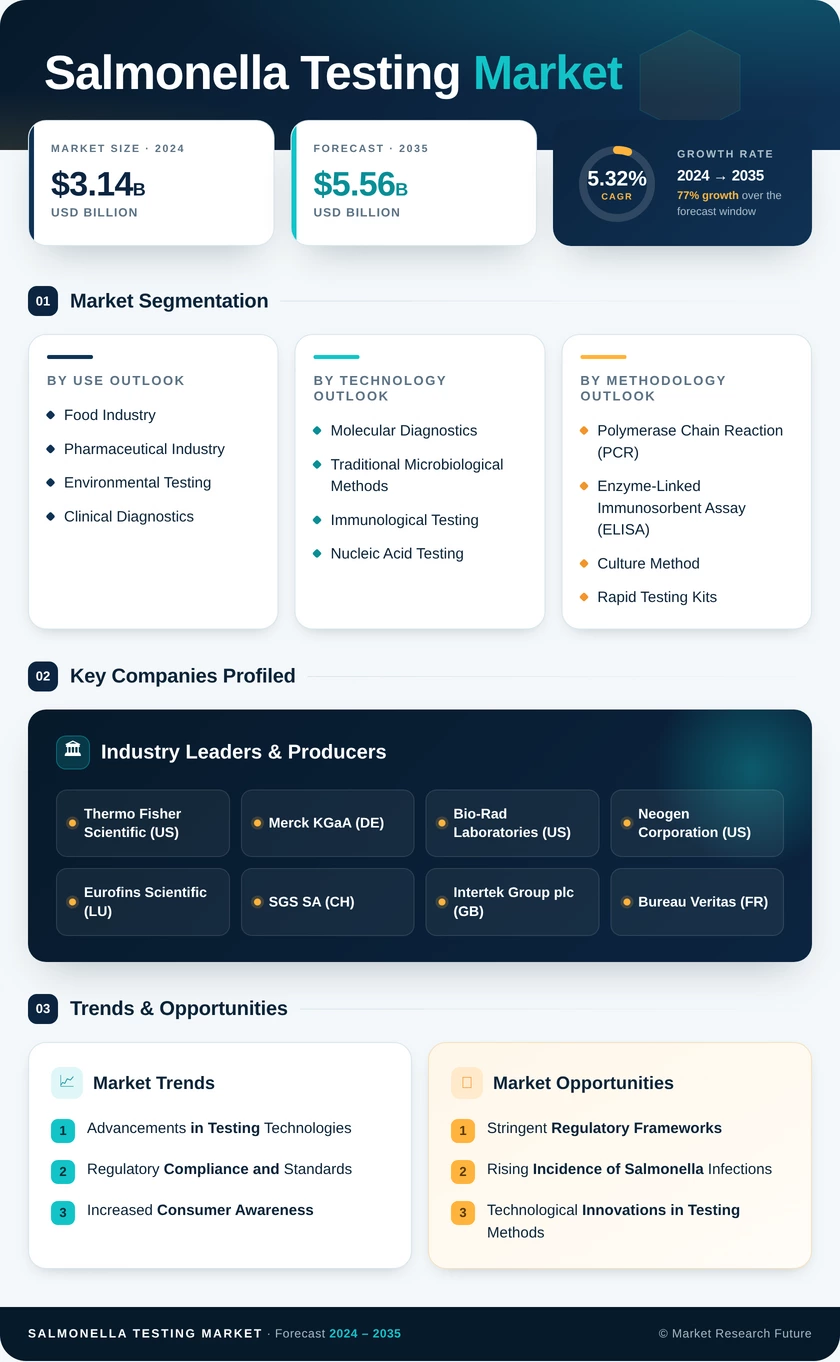
Segmentation Quick Reference
| Dimension | Sub-Segments | Dominant Segment | Fastest Growing Segment |
| By Offering | Instruments & Automation Platforms; Test Kits & Reagents; Services | Test Kits & Reagents (59.8% share) | Services (10.44% CAGR) |
| By Test Type | Conventional Culture Methods; Immunoassay; PCR-Based; Isothermal; Next-Generation Sequencing | PCR-Based (34.9% share) | Isothermal (11.32% CAGR) |
| By Sample Type | Food; Feed & Pet Food; Environmental Samples; Clinical & Veterinary Samples; Water & Beverage | Food (41.6% share) | Feed & Pet Food (12.35% CAGR) |
| By End-User | Food & Beverage Manufacturers; Contract Laboratories; Government & Regulatory Agencies; Research & Academic Institutes; Others | Food & Beverage Manufacturers (31.1% share) | Contract Laboratories (10.18% CAGR) |
| By Region | North America; Europe; Asia-Pacific; South America; Middle East & Africa | North America (34.1% share) | Asia-Pacific (10.12% CAGR) |
Market Segmentation Overview
By Offering
| Sub-Segment | Key Trend |
| Instruments & Automation Platforms | Consolidation of manual benches into automated liquid-handling decks |
| Test Kits & Reagents | Closed-system consumables locked to validated instrument ecosystems |
| Services | Outsourced sequencing, serotyping, and bioinformatics interpretation |
Test Kits & Reagents lead this dimension at 59.8% share because every released lot consumes chemistry irrespective of instrument age, and validated consumables cannot be substituted without re-qualification. Services grow fastest at a 10.44% CAGR, driven by processors that will buy sequencing and resistance interpretation but will not staff bioinformatics teams. Instruments & Automation Platforms sit between the two: revenue per placement is rising, yet each automated deck displaces several manual stations, which restrains unit growth.
By Test Type
| Sub-Segment | Key Trend |
| Conventional Culture Methods | Retained as the regulatory confirmation and dispute-resolution reference |
| Immunoassay | Low-capital screening in cost-constrained and emerging laboratories |
| PCR-Based | Broadest validated matrix claim library across food categories |
| Isothermal | LAMP panels on battery heaters for on-farm and border use |
| Next-Generation Sequencing | Source attribution, persistence mapping and resistance prediction |
PCR-Based methods hold 34.9% share on the strength of validation depth and a large installed instrument base that buyers are reluctant to strand. Isothermal grows fastest at an 11.32% CAGR because LAMP chemistry runs on simple heaters, cutting the capital threshold for on-farm and inspection-point deployment where PCR is impractical. Conventional Culture Methods remain the confirmatory reference against which alternatives are validated, so their decline is gradual rather than abrupt.
By Sample Type
| Sub-Segment | Key Trend |
| Food | Lot-discrete release testing across meat, dairy, produce, and RTE categories |
| Feed & Pet Food | Quantitative load tracking replacing presence-absence screening |
| Environmental Samples | Zone-based swabbing embedded in HACCP verification |
| Clinical & Veterinary Samples | Zoonotic surveillance and herd health monitoring |
| Water & Beverage | Agricultural and process water controls under produce safety rules |
Food dominates at 41.6% share because release testing applies to virtually every regulated lot leaving a processing facility. Feed & Pet Food expands fastest at a 12.35% CAGR as antibiotic-free production removes a suppression mechanism, forcing quantitative monitoring from raw ingredient intake through finished pellet. Environmental Samples grow steadily alongside, since auditors now read facility swab data as the earlier and more reliable signal of process control.
By End-User
| Sub-Segment | Key Trend |
| Food & Beverage Manufacturers | In-house PCR and culture workflows tied to release decisions |
| Contract Laboratories | Absorption of sequencing, serotyping, and resistome workloads |
| Government & Regulatory Agencies | Statutory verification sampling and national surveillance |
| Research & Academic Institutes | Method development and outbreak forensics |
| Others | Retailers, food service groups and certification bodies |
Food & Beverage Manufacturers lead at 31.1% share because release decisions cannot wait on third-party turnaround, which keeps core screening in-house. Contract Laboratories grow fastest at a 10.18% CAGR, taking on whole-genome SNP comparison and resistome mapping that individual plants cannot staff or justify. Government & Regulatory Agencies provide a stable revenue floor tied to statutory sampling rather than commercial demand cycles, which cushions the industry during downturns.


 Noah Malgeri
Co-Founder

 Peter Groot koerkamp
Account and Business Manager

 Younghwan Choi
Senior Retail Manager

 Mark Irwin
Management Consultant

 Akif Moroglu
Strategy & Business Development Director

 Guilherme Gomes Martins
Product Management Director

 Joseph Aguayo
Sales Operations & Pricing Manager

 La Terria Dodd
Program Support Specialist

 Rob Kooiker
Group Product Manager HVAC & Fire Protection GMA