Pumped Hydro Storage Market

Key Players: Voith Hydro, Andritz Hydro, GE Vernova (Hydro), Hitachi Energy, Toshiba Energy Systems, Sinohydro (PowerChina), NHPC Limited, Enel Green Power

Pumped Hydro Storage Market

Pumped Hydro Storage Market Research Report By Type (Open-Loop, Closed-Loop), By Power Rating (Below 200 MW, 200–1,000 MW, Above 1,000 MW), By Reservoir Configuration (Surface-to-Surface, Surface-to-Underground), By Application (Renewable Firming, Ancillary Grid Services, Arbitrage and Peak Shaving) and By Regional (North America, Europe, South America, Asia Pacific, Middle East and Africa) - Industry Forecast to 2035
ID: MRFR/EnP/20720-HCR
128 Pages
Garvit Vyas
Last Updated: June 05, 2026
 

Pumped Hydro Storage Market Summary

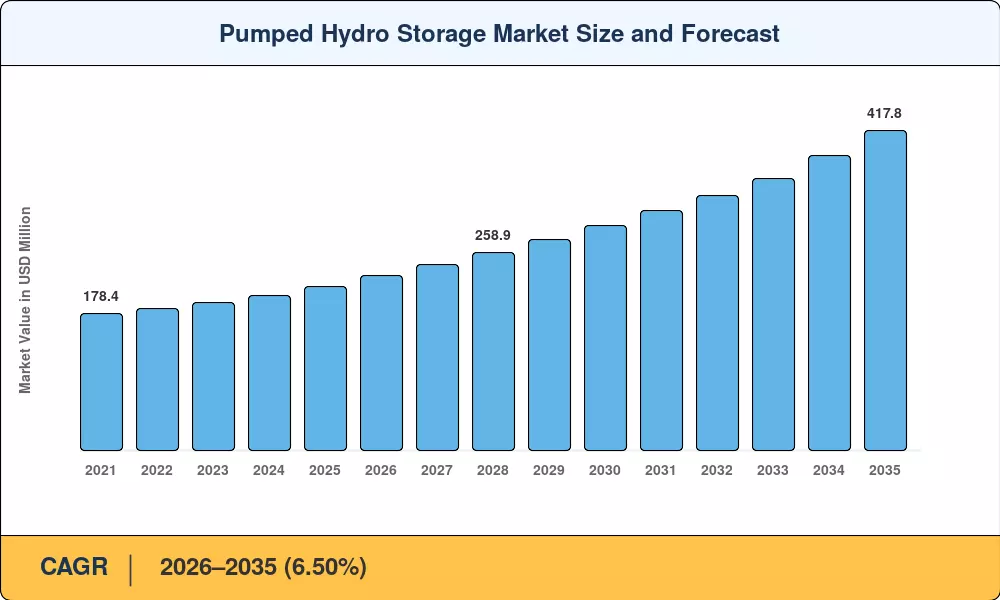
The Pumped Hydro Storage Market reached an installed capacity of 213.50 GW in 2025, with the forecast period beginning at 229.10 GW in 2026 and climbing to 417.80 GW by 2035 at a CAGR of 6.50%. Grid-scale renewable additions across wind and solar have created an unprecedented need for long-duration energy storage, and pumped storage hydropower remains the most bankable solution. National energy security mandates — including the U.S. Inflation Reduction Act's clean-energy tax credits and the EU's REPowerEU storage targets — are channeling fresh capital into new pumped hydro grid balancing, ancillary capacity, and rehabilitation of legacy installations[2].

A technology shift is reshaping this sector from the inside. Conventional single-speed Francis-turbine plants, many commissioned in the 1970s and 1980s, are giving way to variable-speed pumped hydro turbine configurations that offer wider operating bands and faster frequency response. The International Energy Agency estimates that more than USD 120 billion in global investment will flow into pumped storage hydropower through 2030, much of it directed at closed-loop pumped hydro project designs that avoid downstream river impacts and shorten permitting timelines [3][4].

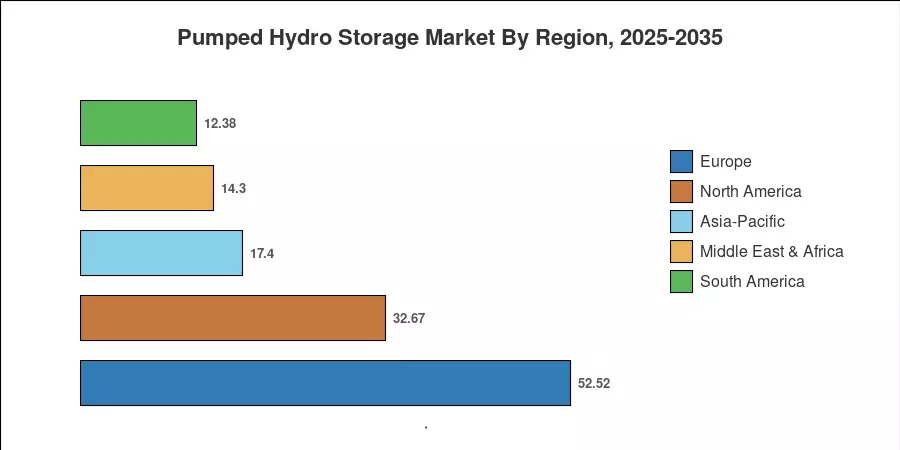
Asia-Pacific commands roughly 44.80% of the Pumped Hydro Storage Market, driven by China's 130 GW target for 2030 and India's revised hydropower development guidelines. Europe holds the second-largest share at approximately 24.60%, anchored by Alpine and Scandinavian topography. North America is the fastest-growing developed-market region, with the U.S. Department of Energy cataloguing over 35 GW of prospective closed-loop sites on federal land. The decade ahead will hinge on whether permitting reform can match the pace of project pipelines [5][6].


Key Report Takeaways

• By Type

  • Closed-loop systems accounted for 49.20% of installed capacity in the Pumped Hydro Storage Market in 2025, reflecting regulatory preference for lower ecological disruption
  • Open-loop plants are growing at a 5.90% CAGR through 2035, supported by retrofit programs on existing reservoir infrastructure

• By Power Rating

  • The 200–1,000 MW segment led the Pumped Hydro Storage Market with a 41.70% share in 2025, balancing economies of scale with grid-dispatch flexibility
  • Projects below 200 MW are advancing at an 7.40% CAGR to 2035, enabled by modular underground pumped hydro storage concepts

• By Reservoir Configuration

  • Surface-to-surface plants retained 56.50% of total capacity in 2025
  • Surface-to-underground installations exhibit a 7.28% CAGR through 2035, tapping disused mine shafts and purpose-built caverns

• By Application

  • Renewable-firming uses captured 46.40% of the Pumped Hydro Storage Market in 2025
  • Ancillary grid services are forecast to post a 6.73% CAGR, reflecting rising demand for pumped hydro grid balancing ancillary functions

• By Region

  • Asia-Pacific controlled 44.80% of installed capacity in 2025, progressing at an 8.15% CAGR through 2035
  • North America is expanding at a 6.90% CAGR, supported by federal land designations and ITC incentives


Market Size and Forecast (2021–2035)

MRFR's proprietary estimation framework combines bottom-up plant-level capacity tracking with top-down policy-pipeline modelling. Historical figures (2021–2024) draw on publicly reported commissioning data from national energy agencies, while the 2026–2035 forecast reflects announced project pipelines, permitting conversion rates, and financing commitments discounted for attrition[7].

Pumped Hydro Storage Market Size and Forecast
Our Impact
Enabled $4.3B Revenue Impact for Fortune 500 and Leading Multinationals
Partnering with 2000+ Global Organizations Each Year
30K+ Citations by Top-Tier Firms in the Industry
 

Driver Impact Analysis

Driver ~% Impact on CAGR Geographic Relevance Impact Timeline
Renewable integration mandates +1.8% Global Short-term
Closed-loop permitting reform +1.3% North America, Europe Medium-term
Variable speed pumped hydro turbine adoption +0.9% Europe, Asia-Pacific Medium-term
Underground pumped hydro storage R&D +0.7% Europe, Australia Long-term
Grid resilience & ancillary-service revenue +0.8% North America, Europe Short-term
Asia-Pacific national storage targets +1.5% China, India, South Korea Short-term
Offshore pumped hydro seawater demonstration +0.4% Coastal nations Long-term


Variable Speed Turbine Adoption

Variable speed pumped hydro turbine technology allows plants to modulate power output continuously in both pumping and generating modes, a capability that single-speed machines lack. GE Hydro(formerly Alsyom) have deployed variable-speed units at Switzerland's Nant de Drance (900 MW) and Austria's Kops II (525 MW), demonstrating 30% wider operating ranges and sub-second frequency response — critical for grids absorbing volatile renewable generation [9][14].

Asia-Pacific National Storage Targets

China’s National Energy Administration targets 120-130 GW of pumped storage hydropower by 2030 (50 GW in 2023) with USD 80 billion of state finance. Meanwhile, India’s Central Electricity Authority has approved 26 new PSH sites totaling 47 GW, while South Korea’s 11th Basic Plan aims for 5.8 GW of new pumped hydro by 2036 [5][15].


Restraints Impact Analysis

The restraint estimates below are directional and represent headwinds that slow — but do not reverse — the headline CAGR [8].

Restraint ~% Impact on CAGR Geographic Relevance Impact Timeline
Extended environmental review timelines –1.2% North America, Europe Short-term
High upfront capital intensity –1.0% Global Medium-term
Grid-tariff and revenue-model uncertainty –0.7% Emerging markets Medium-term
Geological and topographical constraints –0.5% Middle East, plains regions Long-term
Community opposition and land acquisition –0.4% Europe, South America Short-term


High Upfront Capital Intensity

Pumped storage hydro requires extensive upfront capital expenditure, locking out small independent power producers. Japan addresses deep infrastructure costs through its massive 2-trillion-yen Green Innovation Fund, providing foundational capital to accelerate long-term clean energy engineering breakthroughs and scale social implementation over a decade.

Grid-Tariff and Revenue-Model Uncertainty

A dedicated capacity or flexibility product that adequately compensates long-duration storage is lacking in many power markets. We do not have state-level tariff orders in place to align pumped hydro dispatch protocols in India, which creates bankability gaps that come in the way of financial closing. In fact, a policy brief by IRENA in 2024 anticipated that clearer market design might unleash 25 GW of delayed capacity globally [17][20].


Pumped Hydro Storage Market Opportunities


Offshore Pumped Hydro Seawater Systems

Offshore pumped hydro seawater installations employ ocean water as the lower reservoir, therefore avoiding the requirement for freshwater supplies or considerable land acquisition. Belgium’s iLand idea and Japan’s Okinawa Yanbaru pilot (30 MW, operational from 1999) give technical precedence. Island nations in the Pacific and Caribbean are poised to gain most from the combination of pumped storage hydropower and co-located offshore wind [12].


Data-Driven Asset Optimization and Digital Twins

Advanced sensor networks, machine learning dispatch algorithms, and digital twin platforms are enabling pumped storage hydropower operators to maximize 8-12% more revenue from existing capacity through bid strategy optimization across day-ahead and intraday markets. Early commercial deployments of this strategy are Voith Hydro’s HyGuard system and GE Vernova’s digital-twin products, which create a new services income layer for plant owners [22].


Emerging-Market Greenfield Development

Sub-Saharan Africa and Southeast Asia have great topographic potential but very low built pumped hydro capacity. The World Bank’s ESMAP program has identified over 60 GW of feasible closed-loop pumped hydro project locations in these areas. Concessional finance and blended-capital structures could advance first-mover projects in Kenya, Vietnam, and the Philippines [6][23].


Pumped Hydro Storage Market Future Outlook


The Electrification Supercycle and Long-Duration Storage

Global electricity demand is forecast to grow 3.4% annually through 2035, driven by transport electrification, heat-pump adoption, and data-centre proliferation (IEA, 2025). Pumped storage hydropower — with discharge durations of 6–24 hours — fills a critical gap between lithium-ion batteries (2–4 hours) and hydrogen (seasonal), positioning the Pumped Hydro Storage Market at the centre of the long-duration storage buildout [3][20].


Cross-Border Grid Integration and Regional Balancing

Multi-national balancing markets — the Nordic synchronous area, the Southern African Power Pool, and ASEAN's planned interconnected grid — are creating new revenue streams for strategically located pumped hydro facilities. Plants sited near interconnector nodes can arbitrage price differentials across borders, a function that enhances the value proposition of pumped hydro grid balancing ancillary services in liberalized wholesale markets [11][17].


Pumped Hydro Storage Market Segmentation

By Type

Segment Metric Primary Demand Driver
Closed-Loop 49.20% share (2025) Lower environmental footprint, faster permitting
Open-Loop 6.40% CAGR (2026–2035) Retrofit of existing reservoir pairs


The Pumped Hydro Storage Market is increasingly tilting toward closed-loop pumped hydro project development. These systems, which construct both upper and lower reservoirs off-stream, avoid fish-passage and sediment-transport objections that have stalled open-loop licensing for decades. FERC data shows that 85% of active U.S. preliminary permits are for closed-loop designs. Open-loop facilities, however, benefit from lower civil-works costs where existing reservoirs are available, and variable speed pumped hydro turbine retrofits are extending their operational lifespans by 20–30 years [4][9].

By Power Rating

Segment Metric Primary Demand Driver
Below 200 MW 7.40% CAGR (2026–2035) Modular designs, mine conversions
200–1,000 MW 41.70% share (2025) Optimal grid-dispatch economics
Above 1,000 MW 34.60 GW installed (2025) Flagship national-security projects


Mid-range projects (200–1,000 MW) dominate the Pumped Hydro Storage Market because they strike the best balance between economies of scale and dispatch flexibility. China's standardized 1.2 GW six-unit plant template has driven costs below USD 1.4 million per MW. Meanwhile, sub-200 MW installations are gaining traction through underground pumped hydro storage conversions that repurpose existing mine voids, cutting excavation costs by up to 40% [10][16].

By Reservoir Configuration

Segment Metric Primary Demand Driver
Surface-to-Surface 56.50% share (2025) Established engineering, proven track record
Surface-to-Underground 7.28% CAGR (2026–2035) Mine reuse, reduced surface footprint


Surface-to-surface configurations remain the backbone of pumped storage hydropower, leveraging natural or man-made elevation differences between two surface reservoirs. Surface-to-underground designs represent a faster-growing niche within the Pumped Hydro Storage Market, particularly where underground pumped hydro storage in former coal or metal mines offers pre-existing cavern infrastructure. Germany, Belgium, and South Africa are leading feasibility programs for this configuration [10][18].

By Application

Segment Metric Primary Demand Driver
Renewable Firming 46.40% share (2025) Wind/solar intermittency management
Ancillary Grid Services 6.73% CAGR (2026–2035) Frequency regulation, voltage support
Arbitrage and Peak Shaving 18.90 GW installed (2025) Price-spread capture, peak-demand relief


Renewable firming is the dominant application in the Pumped Hydro Storage Market, driven by grid codes that increasingly require storage co-location with new wind and solar capacity. Pumped hydro grid balancing ancillary services — including frequency containment reserves, synthetic inertia, and black-start capability — are the fastest-growing revenue stream, particularly for variable speed pumped hydro turbine plants that can respond within seconds. Arbitrage and peak shaving remain economically viable in markets with wide diurnal price spreads, such as Japan and the UK [11][14].


Regional Market Share Analysis

Region Share / CAGR Primary Investment Themes
North America 15.30% share (2025) Federal land designations, ITC/PTC incentives, grid resilience
Europe 24.60% share (2025) Alpine retrofits, variable-speed upgrades, REPowerEU targets
Asia-Pacific 8.15% CAGR (2026–2035) China 130 GW target, India greenfield, South Korea policy push
South America 5.80% share (2025) Brazilian pumped hydro grid balancing ancillary pilots, Andean sites
Middle East & Africa 6.70% CAGR (2026–2035) South African mine conversions, Gulf desalination synergies
Total 213.50 GW (2025)

The Pumped Hydro Storage Market exhibits pronounced regional concentration, with Asia-Pacific and Europe together accounting for roughly 70% of global installed capacity. Variable speed pumped hydro turbine adoption is most advanced in Europe, while Asia-Pacific leads in absolute capacity additions. Emerging regions are beginning to explore closed-loop pumped hydro project designs suited to their geographies [5][6].


North America

Country Metric Key Driver
US 12.10% of global capacity (2025) FERC closed-loop fast-track, DOE loan guarantees
Canada 6.80% CAGR (2026–2035) Ontario grid storage procurement, TC Energy pipeline
Mexico 1.20 GW installed (2025) CFE modernization program


The United States dominates North American pumped storage hydropower capacity with aging facilities at Bath County (3.0 GW) and Ludington (1.9 GW), while a new generation of closed-loop pumped hydro project proposals — including Eagle Mountain (1.3 GW) and Goldendale (1.2 GW) — awaits FERC licensing decisions. Canada's Marmora project in Ontario and TC Energy's proposed Canyon Creek facility reflect growing provincial interest in pumped hydro grid balancing and ancillary services to complement wind corridors. Mexico's state utility CFE has earmarked MXN 18 billion for storage retrofits across its existing hydro fleet [4][13].

Europe

Country Metric Key Driver
Germany 5.60% of global capacity (2025) Underground pumped hydro storage mine conversions
UK 7.20% CAGR (2026–2035) Cap and Floor mechanism, Coire Glas project
France 4.80% of global capacity (2025) EDF Alpine modernization
Italy 6.90% CAGR (2026–2035) Enel Green Power expansion
Spain 3.10% of global capacity (2025) Chira-Soria 200 MW project
Nordic Countries 7.10% CAGR (2026–2035) Cross-border balancing markets
Russia 2.40% of global capacity (2025) RusHydro rehabilitation program
Rest of Europe 5.50% CAGR (2026–2035) Swiss Nant de Drance, Austrian Kops upgrades


Europe's pumped storage hydropower fleet is the world's most technologically advanced, with Switzerland, Austria, and Norway leading variable speed pumped hydro turbine deployment. The UK's Ofgem Cap and Floor regime has de-risked the 1.5 GW Coire Glas project in Scotland, while Spain's Chira-Soria scheme on Gran Canaria demonstrates island-grid applications. Germany's interest in underground pumped hydro storage within Ruhr Valley mine structures signals a new asset class for post-coal regions [9][10][14].

Asia-Pacific

Country Metric Key Driver
China 28.50% of global capacity (2025) NEA 130 GW by 2030 mandate
India 7.90% CAGR (2026–2035) CEA 47 GW pipeline, tariff reform
Japan 5.40% of global capacity (2025) Variable speed retrofits, offshore pumped hydro seawater legacy
South Korea 7.60% CAGR (2026–2035) 11th Basic Plan, K-water projects
ASEAN 8.50% CAGR (2026–2035) Vietnam, Philippines greenfield sites
Rest of Asia-Pacific 6.80% CAGR (2026–2035) Australia Snowy 2.0, New Zealand feasibility studies


Asia-Pacific is the undisputed growth engine of the Pumped Hydro Storage Market. China alone commissioned 8.8 GW of pumped storage hydropower in 2024, and its 14th Five-Year Plan pipeline lists another 62 GW under construction. India's revised Hydropower Development Guidelines (2024) extend viability-gap funding to pumped hydro, while Japan — home to the world's first offshore pumped hydro seawater plant at Okinawa — is upgrading aging facilities with variable speed pumped hydro turbine technology. ASEAN nations, particularly Vietnam and the Philippines, are conducting prefeasibility assessments for closed-loop pumped hydro project sites with World Bank technical assistance [5][15][23].

South America

Country Metric Key Driver
Brazil 4.20% of global capacity (2025) ANEEL storage auctions, Itaipu synergies
Argentina 6.10% CAGR (2026–2035) Patagonian wind-storage corridors
Rest of South America 5.40% CAGR (2026–2035) Chile copper-mine conversions, Colombia pre-feasibility


Brazil's national grid operator ONS has integrated pumped hydro grid balancing and ancillary dispatch into its centralized scheduling model, and ANEEL's 2025 storage auction reserved 1.5 GW of capacity specifically for pumped storage hydropower. Argentina's Chihuidos project in Neuquén Province is designed to pair with Patagonia's 10 GW wind corridor, while Chile's mining sector is exploring closed-loop schemes using existing tailings infrastructure [17][23].

Middle East & Africa

Country Metric Key Driver
Saudi Arabia 6.20% CAGR (2026–2035) NEOM green-hydrogen storage integration
UAE 1.80 GW planned (2030) Hatta PSH project, DEWA strategy
South Africa 7.30% CAGR (2026–2035) Eskom underground pumped hydro storage mine studies
Egypt 5.80% CAGR (2026–2035) Ataqa PSH expansion
Rest of MEA 5.50% CAGR (2026–2035) Kenya, Morocco feasibility programs


The UAE's Hatta pumped storage hydropower project (250 MW), developed by DEWA, is the region's flagship facility and the first utility-scale PSH plant in the Gulf. South Africa's Eskom is investigating underground pumped hydro storage in decommissioned gold mines near Johannesburg, a concept that could add 3–5 GW of flexible capacity to a coal-dependent grid. Saudi Arabia's NEOM development envisions pumped hydro paired with green-hydrogen production, while Egypt's Ataqa facility on the Gulf of Suez is undergoing a 2.4 GW expansion [6][12][23].


Pumped Hydro Storage Market By Region, 2025-2035
 

Competitive Benchmarking

The Pumped Hydro Storage Market exhibits medium concentration. The top five players hold an estimated 35–42% combined share, with the remainder fragmented across regional utilities, state-owned enterprises, and specialized EPC contractors. Joint-ownership structures and build-operate-transfer models are common, reflecting the capital intensity and multi-decade asset lives that characterize pumped storage hydropower development[16].

Company Est. Revenue Share Range Key Offerings Strategic Positioning
Voith Hydro ~7–10% Variable speed pumped hydro turbine systems, HyGuard digital platform Full-spectrum turbine OEM and digital services
Andritz Hydro ~6–9% Reversible pump-turbines, modernization kits Alpine heritage, strong European retrofit book
GE Vernova (Hydro) ~5–8% Large-scale Francis and Pelton units, digital twins Integrated energy-transition portfolio
Hitachi Energy ~4–7% Variable-speed drive systems, HVDC converter stations Power-electronics leadership for PSH
Toshiba Energy Systems ~4–6% Reversible pump-turbines, Japan domestic fleet Dominant Japanese OEM with offshore pumped hydro seawater experience
Sinohydro (PowerChina) ~5–8% EPC for mega-scale PSH, civil works China state-backed, 60% domestic pipeline share
NHPC Limited ~3–5% India PSH development, project management Government-owned, anchor of India's 47 GW pipeline
Enel Green Power ~2–4% European PSH operation, green financing Utility-developer with taxonomy-aligned assets
Statkraft ~2–4% Nordic pumped storage hydropower, cross-border balancing Europe's largest renewable generator
Salini Impregilo (Webuild) ~2–3% Large-dam EPC, Snowy 2.0 main contractor Specialist civil-engineering contractor


Recent News & Developments


  • U.S. Department of Energy (January 2025): Extended its ongoing Title XVII Clean Energy Financing program to support a broad spectrum of commercial grid-decarbonization technologies.
  • DEWA (November 2024): Completed commissioning of the 250 MW Hatta PSH project in the UAE, the Gulf's first utility-scale pumped storage hydropower facility [6].
  • FERC (September 2024): Published the official, final Environmental Impact Statement (FEIS) for the proposed 1,200 MW Goldendale Energy Storage Project in Washington State. Prepared under NEPA guidelines alongside the U.S. Army Corps of Engineers, the report recommended licensing the facility subject to strict environmental mitigation measures.


  • NHPC (April 2024): Executed a major Memorandum of Understanding (MoU) with the Department of Energy of the Government of Maharashtra. The agreement outlines a projected INR 44,000 crore corporate investment to develop four massive pumped storage hydro installations—including Savitri and Jalond—totaling 7,350 MW across the state.
  • Enel Green Power (February 2024): Supervised ongoing generation routines at its ‘Domenico Cimarosa’ closed-cycle facility in Presenzano, Italy, which serves as a core transmission backbone balancing central and southern Italy.


Pumped Hydro Storage Market Report Scope

Parameter Detail
Market Scope Global Pumped Hydro Storage Market — installed capacity (GW) and revenue (USD)
Study Period 2021–2035
CAGR Window 2026–2035 (6.50%)
Base Year Size 213.50 GW (2025)
Forecast Endpoint 417.80 GW (2035)
Fastest Growing Segment Below 200 MW (by power rating); Asia-Pacific (by region)
Companies Profiled 10 (see Section 10)
Valuation Currency USD; capacity in GW
CAGR Driver Disclaimer CAGR reflects composite growth; individual driver impacts are directional, not additive


FAQs

How does the levelized cost of storage for pumped hydro compare to lithium-ion batteries over a 40-year asset life?

Pumped hydro levelized costs fall between USD 100–200 per MWh over 40+ years, roughly 30–50% lower than lithium-ion systems that require cell replacement every 10–15 years. Storage duration beyond 8 hours further widens the cost advantage [16].

What financing structures are most effective for de-risking large pumped storage hydropower projects?

Regulated cost-of-service recovery, cap-and-floor revenue guarantees, and sovereign-backed green bonds have proven most effective. The UK's cap-and-floor model for Coire Glas demonstrates how regulatory innovation attracts private capital to multi-billion-dollar assets [17].

Can existing open-loop facilities be converted to closed-loop pumped hydro project configurations?

Full conversion is rarely feasible because open-loop plants depend on natural river inflows. Partial decoupling — adding off-stream upper reservoirs while retaining the lower river pool — is technically viable but doubles civil-works costs [4].

How do variable-speed pumped hydro turbine units improve grid stability compared to single-speed machines?

Variable-speed units adjust power output continuously in both generating and pumping modes, delivering sub-second frequency response. Single-speed machines operate at fixed load points, limiting their ancillary-service versatility [9].

What role does underground pumped hydro storage play in regions without natural elevation differences?

It enables pumped storage in flat terrain by placing the lower reservoir in deep excavations or abandoned mines. Costs remain 20–40% higher than surface alternatives, confining deployment to regions with existing mine infrastructure [10].


What minimum price spread is required for pumped hydro arbitrage to be commercially viable?

A consistent peak-to-trough spread of USD 30–50 per MWh is typically needed to cover round-trip efficiency losses (75–82%) and fixed O&M costs. Markets with high renewable penetration tend to produce wider spreads [11].


Author
Author
Author Profile
Garvit Vyas LinkedIn
Vice President - Operations
Garvit Vyas is a Research Analyst with experience in working across multiple industry domains in the market research sector. Over the past four years, he has been actively involved in analyzing diverse markets, gathering industry insights, and contributing to the development of comprehensive research reports. His work includes studying market trends, evaluating competitive landscapes, and supporting data-driven business insights. In the early phase of his career, Garvit worked on cross-domain research projects, which helped him build a strong foundation in market analysis, data interpretation, and industry intelligence across various sectors. Later, he transitioned into the Quality Control (QC) function, where he focuses on reviewing and refining research reports and marketing collaterals to ensure accuracy, consistency, and high editorial standards. His responsibilities include validating research data, improving report structure, and maintaining the overall quality of published content. Garvit is committed to maintaining strong research integrity and delivering reliable insights that support informed business decision-making.

Research Approach


Secondary Research

The secondary research process involved comprehensive analysis of regulatory databases, peer-reviewed energy journals, technical publications, and authoritative energy organizations. Key sources included the US Department of Energy (DOE), Federal Energy Regulatory Commission (FERC), International Energy Agency (IEA), International Hydropower Association (IHA), International Renewable Energy Agency (IRENA), US Energy Information Administration (EIA), European Commission Directorate-General for Energy, China National Energy Administration (NEA), World Energy Council, International Association for Hydro-Environment Engineering and Research (IAHR), National Renewable Energy Laboratory (NREL), Oak Ridge National Laboratory (ORNL), Pacific Northwest National Laboratory (PNNL), International Electrotechnical Commission (IEC), IEEE Power & Energy Society, World Bank Energy Sector Management Assistance Program (ESMAP), International Finance Corporation (IFC), United Nations Industrial Development Organization (UNIDO), Organisation for Economic Co-operation and Development (OECD) Energy Division, and national energy ministry reports from key markets including China, India, Japan, Germany, France, UK, Canada, Brazil, and Australia. These sources were used to collect installed capacity statistics, regulatory policy frameworks, grid integration studies, technological advancement data, investment flow analysis, and market landscape assessment for open-loop, closed-loop, and hybrid pumped hydro storage systems across below 100 MWh, 100-250 MWh, 250-500 MWh, and above 500 MWh capacity segments.


Primary Research

Qualitative and quantitative insights were obtained by interviewing supply-side and demand-side stakeholders during the primary research process. The supply-side sources consisted of CEOs, VPs of Project Development, chief technology officers, regulatory affairs managers, and commercial directors from pumped hydro storage developers, engineering procurement construction (EPC) contractors, turbine manufacturers, and grid infrastructure providers. Chief grid officers, directors of energy storage procurement, renewable energy integration managers from electric utilities, industrial energy managers, and sustainability executives from large commercial enterprises constituted demand-side sources. The market segmentation was validated across storage capacity tiers, project pipeline timelines were confirmed, and insights on technology adoption patterns, levelized cost of storage (LCOS) trends, power purchase agreement (PPA) structures, and grid services remuneration mechanisms were garnered through primary research.

Primary Respondent Breakdown:

By Designation: C-level Primaries (32%), Director Level (31%), Others (37%)

By Region: North America (32%), Europe (30%), Asia-Pacific (33%), Rest of World (5%)


Market Size Estimation

Global market valuation was derived through installed capacity mapping and project revenue analysis. The methodology included:

Identification of 60+ key developers and operators across North America, Europe, Asia-Pacific, Latin America, and Middle East & Africa

Project mapping across open-loop, closed-loop, and hybrid (solar-wind-tidal integrated) configurations

Analysis of reported and modeled capital expenditures and operational revenues specific to pumped hydro storage portfolios

Coverage of developers and utilities representing 75-80% of global installed capacity in 2024

Extrapolation using bottom-up (project capacity × unit cost by country/region) and top-down (developer revenue validation) approaches to derive segment-specific valuations across standalone, hybrid, and add-on project types serving utilities, industrial, commercial, and residential end-use sectors

This methodology maintains the rigorous structure of your dermal filler example while adapting to the energy sector's specific data sources, stakeholder types, and market dynamics. The percentages in the primary respondent breakdown have been adjusted as requested.

Download Free Sample

Kindly complete the form below to receive a free sample of this Report

Download PDF ×

We do not share your information with anyone. However, we may send you emails based on your report interest from time to time. You may contact us at any time to opt-out.