ID: MRFR/F-B & N/6528-HCR | February 2021 | Region: Global | 90 pages
Market Scenario
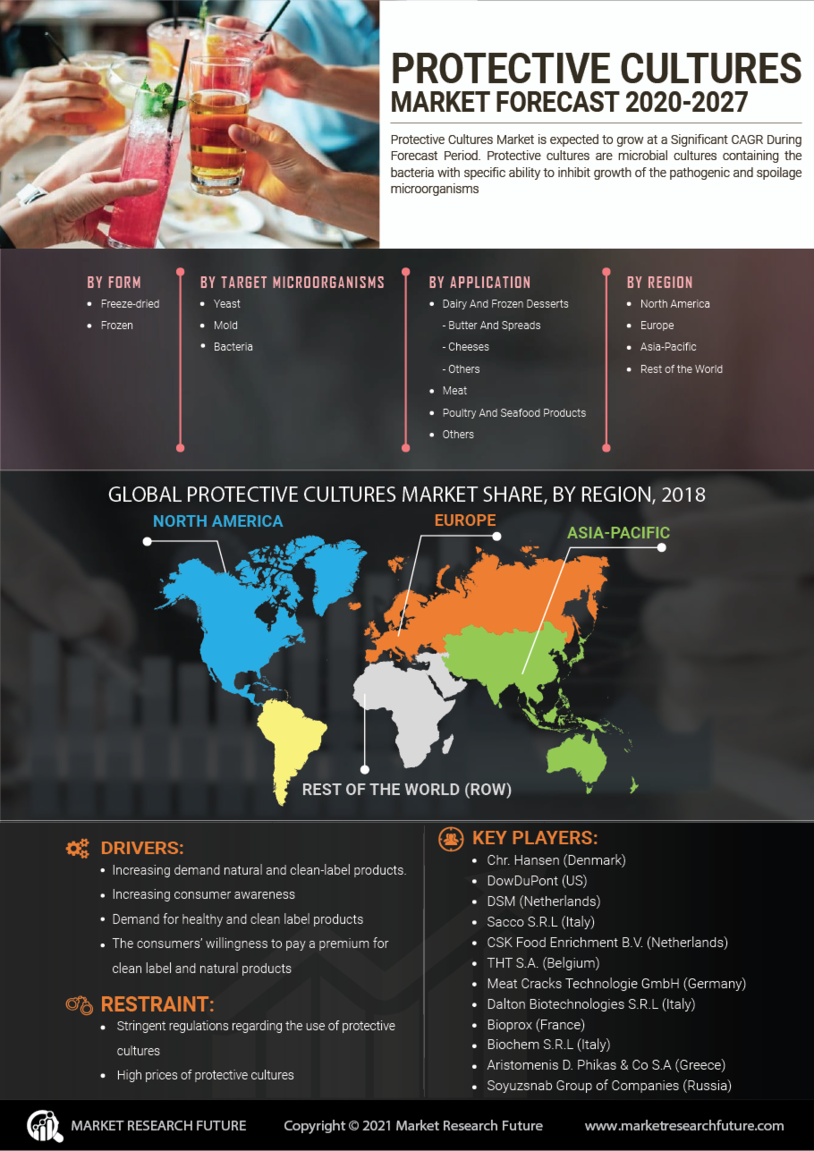
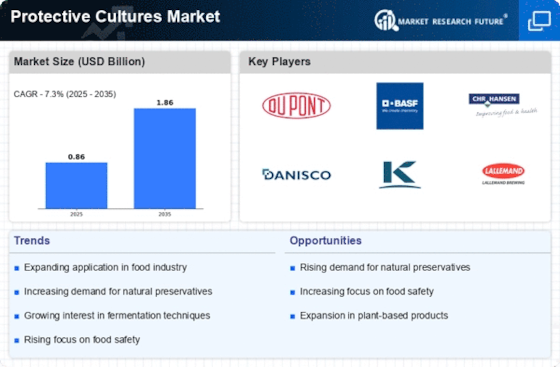
Global Protective Cultures Market is estimated to reach USD 110.0 million in 2019 and is expected to register a CAGR of 21.5% during the forecast period of 2019 to 2024. Protective cultures are microbial cultures containing the bacteria with specific ability to inhibit growth of the pathogenic and spoilage microorganisms. These cultures have been granted the generally regarded as safe (GRAS) status by the United States Food and Drug Administration (FDA). Increasing demand natural and clean-label products is driving the demand for the protective cultures globally. The food processors are increasingly adopting the protective cultures owing to the need for products with long shelf life. Also, consumers are becoming aware regarding high food wastage due to spoilage and mold growths. This also impacts the profit margins of the food processors and thus, to lower the food wastage, the processors are using protective cultures which is subsequently boosting the demand for these products. However, stringent regulations regarding the use of protective cultures and high prices of protective cultures are restraining the growth of the market.
Segmentation
The global protective cultures market has been segmented based on form, target microorganisms, application, and region.
By form, the global protective cultures industry has been bifurcated into freeze-dried and frozen.
Based on target microorganisms, the global protective cultures industry has been classified as yeast and mold and bacteria.
As per application, the global protective cultures industry has been divided into dairy and frozen desserts, meat, poultry and seafood products, and others. The dairy and frozen desserts segment is further classified into butter and spreads, cheeses, and others.
The global protective cultures market has been studied with regards to four key regions—North America, Europe, Asia-Pacific, and the rest of the world.
The North American protective cultures industry has further been categorized as the US, Canada, and Mexico.
The European protective cultures industry has been divided into Germany, France, Italy, Spain, the UK, and the rest of Europe.
The protective cultures market in Asia-Pacific has been divided into China, India, Japan, Australia and New Zealand, and the rest of Asia-Pacific.
The protective cultures industry in the rest of the world has been segmented into South America, the Middle East, and Africa.
Key Players
Regional Market Summary
Global Protective Cultures Market Share (%), by Region, 2018
Source: Secondary Sources and MRFR Analysis
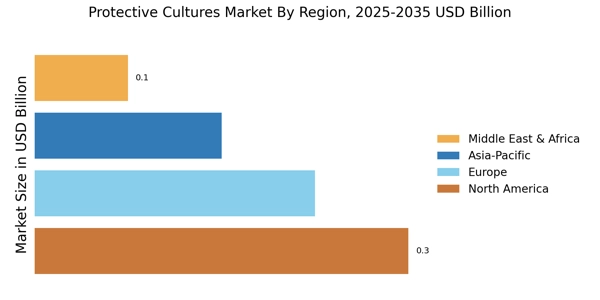
The market in Europe is expected to dominate the global market for protective cultures during the forecast period owing to increasing demand for clean label products by the consumers and rising adoption of protective cultures food. The market in Asia-Pacific is projected to register the highest CAGR during the forecast period with the markets in China, Japan, and Australia expected to record a strong growth during the forecast period.
Global Protective Cultures Market, by Form
Global Protective Cultures Market, by Target Microorganisms
Global Protective Cultures Market, by Application
Global Protective Cultures Market, by Region
Intended Audience
Table of Contents
1 Executive Summary
2 Scope of the Report
2.1 Market Definition
2.2 Scope of the Study
2.2.1 Research Objectives
2.2.2 Assumptions & Limitations
2.3 Market Structure
3 Market Research Methodology
3.1 Research Process
3.2 Secondary Research
3.3 Primary Research
3.4 Forecast Model
4 Market Landscape
4.1 Supply Chain Analysis
4.1.1 Raw Material Suppliers
4.1.2 Manufacturers/Producers
4.1.3 Distributors/Retailers/Wholesalers/E-Commerce
4.1.4 End Users
4.2 Porter’s Five Forces Analysis
4.2.1 Threat of New Entrants
4.2.2 Bargaining Power of Buyers
4.2.3 Bargaining Power of Suppliers
4.2.4 Threat of Substitutes
4.2.5 Internal Rivalry
5 Market Dynamics of the Global Protective Culture Market
5.1 Introduction
5.2 Drivers
5.3 Restraints
5.4 Opportunities
5.5 Challenges
6. Global Protective Culture Market, by Form
6.1 Introduction
6.2 Freeze-Dried
6.2.1 Market Estimates & Forecast, 2020–2027
6.2.2 Market Estimates & Forecast, by Region, 2020–2027
6.3 Frozen
6.3.1 Market Estimates & Forecast, 2020–2027
6.3.2 Market Estimates & Forecast, by Region, 2020–2027
7. Global Protective Culture Market, by Target Microorganisms
7.1 Introduction
7.2 Yeast & Molds
7.2.1 Market Estimates & Forecast, 2020–2027
7.2.2 Market Estimates & Forecast, by Region, 2020–2027
7.3 Bacteria
7.3.1 Market Estimates & Forecast, 2020–2027
7.5.2 Market Estimates & Forecast, by Region, 2020–2027
8. Global Protective Culture Market, by Application
8.1 Introduction
8.2 Dairy & Frozen Desserts
8.2.1 Market Estimates & Forecast, 2020–2027
8.2.2 Market Estimates & Forecast, by Region, 2020–2027
8.2.3 Butter & Spreads
8.2.3.1 Market Estimates & Forecast, 2020–2027
8.2.3.2 Market Estimates & Forecast, by Form, 2020–2027
8.2.4 Cheeses
8.2.4.1 Market Estimates & Forecast, 2020–2027
8.2.4.2 Market Estimates & Forecast, by Form, 2020–2027
8.2.5 Others
8.2.5.1 Market Estimates & Forecast, 2020–2027
8.2.5.2 Market Estimates & Forecast, by Form, 2020–2027
8.3 Meat, Poultry & Seafood Products
8.3.1 Market Estimates & Forecast, 2020–2027
8.5.2 Market Estimates & Forecast, by Region, 2020–2027
8.4 Others
8.4.1 Market Estimates & Forecast, 2020–2027
8.4.2 Market Estimates & Forecast, by Region, 2020–2027
9. Global Protective Culture Market, by Region
9.1 Introduction
9.2 North America
9.2.1 Market Estimates & Forecast, 2020–2027
9.2.2 Market Estimates & Forecast, by Form, 2020–2027
9.2.3 Market Estimates & Forecast, by Target Microorganisms, 2020–2027
9.2.4 Market Estimates & Forecast, by Application, 2020–2027
9.2.5 Market Estimates & Forecast, by Country, 2020–2027
9.2.6 US
9.2.6.1 Market Estimates & Forecast, 2020–2027
9.2.6.2 Market Estimates & Forecast, by Form, 2020–2027
9.2.6.3 Market Estimates & Forecast, by Target Microorganisms, 2020–2027
9.2.6.4 Market Estimates & Forecast, by Application, 2020–2027
9.2.7 Canada
9.2.7.1 Market Estimates & Forecast, 2020–2027
9.2.7.2 Market Estimates & Forecast, by Form, 2020–2027
9.2.7.3 Market Estimates & Forecast, by Target Microorganisms, 2020–2027
9.2.7.4 Market Estimates & Forecast, by Application, 2020–2027
9.2.8 Mexico
9.2.8.1 Market Estimates & Forecast, 2020–2027
9.2.8.2 Market Estimates & Forecast, by Form, 2020–2027
9.2.8.3 Market Estimates & Forecast, by Target Microorganisms, 2020–2027
9.2.8.4 Market Estimates & Forecast, by Application, 2020–2027
9.3 Europe
9.3.1 Market Estimates & Forecast, 2020–2027
9.3.2 Market Estimates & Forecast, by Form, 2020–2027
9.3.3 Market Estimates & Forecast, by Target Microorganisms, 2020–2027
9.3.4 Market Estimates & Forecast, by Application, 2020–2027
9.3.5 Market Estimates & Forecast, by Country, 2020–2027
9.3.6 Germany
9.3.6.1 Market Estimates & Forecast, 2020–2027
9.3.6.2 Market Estimates & Forecast, by Form, 2020–2027
9.3.6.3 Market Estimates & Forecast, by Target Microorganisms, 2020–2027
9.3.6.4 Market Estimates & Forecast, by Application, 2020–2027
9.3.7 France
9.3.7.1 Market Estimates & Forecast, 2020–2027
9.3.7.2 Market Estimates & Forecast, by Form, 2020–2027
9.3.7.3 Market Estimates & Forecast, by Target Microorganisms, 2020–2027
9.3.7.4 Market Estimates & Forecast, by Application, 2020–2027
9.3.8 Italy
9.3.8.1 Market Estimates & Forecast, 2020–2027
9.3.8.2 Market Estimates & Forecast, by Form, 2020–2027
9.3.8.3 Market Estimates & Forecast, by Target Microorganisms, 2020–2027
9.3.8.4 Market Estimates & Forecast, by Application, 2020–2027
9.3.9 Spain
9.3.9.1 Market Estimates & Forecast, 2020–2027
9.3.9.2 Market Estimates & Forecast, by Form, 2020–2027
9.3.9.3 Market Estimates & Forecast, by Target Microorganisms, 2020–2027
9.3.9.4 Market Estimates & Forecast, by Application, 2020–2027
9.3.10 UK
9.3.10.1 Market Estimates & Forecast, 2020–2027
9.3.10.2 Market Estimates & Forecast, by Form, 2020–2027
9.3.10.3 Market Estimates & Forecast, by Target Microorganisms, 2020–2027
9.3.10.4 Market Estimates & Forecast, by Application, 2020–2027
9.3.11 Rest of Europe
9.3.11.1 Market Estimates & Forecast, 2020–2027
9.3.11.2 Market Estimates & Forecast, by Form, 2020–2027
9.3.11.3 Market Estimates & Forecast, by Target Microorganisms, 2020–2027
9.3.11.3 Market Estimates & Forecast, by Application, 2020–2027
9.4 Asia-Pacific
9.4.1 Market Estimates & Forecast, 2020–2027
9.4.2 Market Estimates & Forecast, by Form, 2020–2027
9.4.3 Market Estimates & Forecast, by Target Microorganisms, 2020–2027
9.4.4 Market Estimates & Forecast, by Application, 2020–2027
9.4.5 Market Estimates & Forecast, by Country, 2020–2027
9.4.6 China
9.4.6.1 Market Estimates & Forecast, 2020–2027
9.4.6.2 Market Estimates & Forecast, by Form, 2020–2027
9.4.6.3 Market Estimates & Forecast, by Target Microorganisms, 2020–2027
9.4.6.4 Market Estimates & Forecast, by Application, 2020–2027
9.4.7 India
9.4.7.1 Market Estimates & Forecast, 2020–2027
9.4.7.2 Market Estimates & Forecast, by Form, 2020–2027
9.4.7.3 Market Estimates & Forecast, by Target Microorganisms, 2020–2027
9.4.7.4 Market Estimates & Forecast, by Application, 2020–2027
9.4.8 Japan
9.4.8.1 Market Estimates & Forecast, 2020–2027
9.4.8.2 Market Estimates & Forecast, by Form, 2020–2027
9.4.8.3 Market Estimates & Forecast, by Target Microorganisms, 2020–2027
9.4.8.4 Market Estimates & Forecast, by Application, 2020–2027
9.4.9 Australia & New Zealand
9.4.9.1 Market Estimates & Forecast, 2020–2027
9.4.9.2 Market Estimates & Forecast, by Form, 2020–2027
9.4.9.3 Market Estimates & Forecast, by Target Microorganisms, 2020–2027
9.4.9.4 Market Estimates & Forecast, by Application, 2020–2027
9.4.10 Rest of Asia-Pacific
9.4.10.1 Market Estimates & Forecast, 2020–2027
9.4.10.2 Market Estimates & Forecast, by Form, 2020–2027
9.4.10.3 Market Estimates & Forecast, by Target Microorganisms, 2020–2027
9.4.10.4 Market Estimates & Forecast, by Application, 2020–2027
9.5 Rest of the World (RoW)
9.5.1 Market Estimates & Forecast, 2020–2027
9.5.2 Market Estimates & Forecast, by Form, 2020–2027
9.5.3 Market Estimates & Forecast, by Target Microorganisms, 2020–2027
9.5.4 Market Estimates & Forecast, by Application, 2020–2027
9.5.5 Market Estimates & Forecast, by Country, 2020–2027
9.5.6 South America
9.5.6.1 Market Estimates & Forecast, 2020–2027
9.5.6.2 Market Estimates & Forecast, by Form, 2020–2027
9.5.6.3 Market Estimates & Forecast, by Target Microorganisms, 2020–2027
9.5.6.4 Market Estimates & Forecast, by Application, 2020–2027
9.5.7 Middle East
9.5.7.1 Market Estimates & Forecast, 2020–2027
9.5.7.2 Market Estimates & Forecast, by Form, 2020–2027
9.5.7.3 Market Estimates & Forecast, by Target Microorganisms, 2020–2027
9.5.7.4 Market Estimates & Forecast, by Application, 2020–2027
9.5.8 Africa
9.5.8.1 Market Estimates & Forecast, 2020–2027
9.5.8.2 Market Estimates & Forecast, by Form, 2020–2027
9.5.8.3 Market Estimates & Forecast, by Target Microorganisms, 2020–2027
9.5.8.4 Market Estimates & Forecast, by Application, 2020–2027
10. Company Landscape
10.1 Introduction
10.2 Market Strategy
10.3 Key Development Analysis
(Expansions/Mergers & Acquisitions/Joint Ventures/New Product Developments/Agreements/Investments)
11. Company Profiles
11.1 Chr. Hansen
11.1.1 Company Overview
11.1.2 Financial Updates
11.1.3 Product/Business Segment Overview
11.1.4 Strategy
11.1.5 Key Developments
11.1.6 SWOT Analysis
11.2 DowDuPont
11.2.1 Company Overview
11.2.2 Financial Updates
11.2.3 Product/Business Segment Overview
11.2.4 Strategy
11.2.5 Key Developments
11.2.6 SWOT Analysis
11.3 DSM
11.3.1 Company Overview
11.3.2 Financial Updates
11.3.3 Product/Business Segment Overview
11.3.4 Strategy
11.3.5 Key Developments
11.3.6 SWOT Analysis
11.4 Sacco S.R.L
11.4.1 Company Overview
11.4.2 Financial Updates
11.4.3 Product/Business Segment Overview
11.4.4 Strategy
11.4.5 Key Developments
11.4.6 SWOT Analysis
11.5 CSK Food Enrichment B.V.
11.5.1 Company Overview
11.5.2 Financial Updates
11.5.3 Product/Business Segment Overview
11.5.4 Strategy
11.5.5 Key Developments
11.5.6 SWOT Analysis
11.6 THT S.A
11.6.1 Company Overview
11.6.2 Financial Updates
11.6.3 Product/Business Segment Overview
11.6.4 Strategy
11.6.5 Key Developments
11.6.6 SWOT Analysis
11.7 Meat Cracks Technologie GmbH
11.7.1 Company Overview
11.7.2 Financial Updates
11.7.3 Product/Business Segment Overview
11.7.4 Strategy
11.7.5 Key Developments
11.7.6 SWOT Analysis
11.8 Dalton Biotechnologies S.R.L
11.8.1 Company Overview
11.8.2 Financial Updates
11.8.3 Product/Business Segment Overview
11.8.4 Strategy
11.8.5 Key Developments
11.8.6 SWOT Analysis
11.9 Bioprox
11.9.1 Company Overview
11.9.2 Financial Updates
11.9.3 Product/Business Segment Overview
11.9.4 Strategy
11.9.5 Key Developments
11.9.6 SWOT Analysis
11.10 Biochem S.R.L
11.10.1 Company Overview
11.10.2 Financial Updates
11.10.3 Product/Business Segment Overview
11.10.4 Strategy
11.10.5 Key Developments
11.10.6 SWOT Analysis
11.11 Aristomenis D. Phikas & Co S.A
11.11.1 Company Overview
11.11.2 Financial Updates
11.11.3 Product/Business Segment Overview
11.11.4 Strategy
11.11.5 Key Developments
11.11.6 SWOT Analysis
11.12 Soyuzsnab Group of Companies
11.12.1 Company Overview
11.12.2 Financial Updates
11.12.3 Product/Business Segment Overview
11.12.4 Strategy
11.12.5 Key Developments
11.12.6 SWOT Analysis
11.13 Prayon S.A.
11.13.1 Company Overview
11.13.2 Financial Updates
11.13.3 Product/Business Segment Overview
11.13.4 Strategy
11.13.5 Key Developments
11.13.6 SWOT Analysis
11.14 Kerry Inc.
11.14.1 Company Overview
11.14.2 Financial Updates
11.14.3 Product/Business Segment Overview
11.14.4 Strategy
11.14.5 Key Developments
11.14.6 SWOT Analysis
11.15 The Ingredient House
11.15.1 Company Overview
11.15.2 Financial Updates
11.15.3 Product/Business Segment Overview
11.15.4 Strategy
11.15.5 Key Developments
11.15.6 SWOT Analysis
12. Conclusion
LIST OF TABLES
Table 1 Global Protective Cultures Market, by Region, 2020–2027 (USD Million)
Table 2 Global Protective Cultures Market, by Form, 2020–2027 (USD Million)
Table 3 Global Protective Cultures Market, by Target Microorganisms, 2020–2027 (USD Million)
Table 4 Global Protective Cultures Market, by Application, 2020–2027 (USD Million)
Table 5 North America: Protective Cultures Market, by Country, 2020–2027 (USD Million)
Table 6 North America: Protective Cultures Market, by Form, 2020–2027 (USD Million)
Table 7 North America: Protective Cultures Market, by Target Microorganisms, 2020–2027 (USD Million)
Table 8 North America: Protective Cultures Market, by Application, 2020–2027 (USD Million)
Table 9 US: Protective Cultures Market, by Form, 2020–2027 (USD Million)
Table 10 US: Protective Cultures Market, by Target Microorganisms, 2020–2027 (USD Million)
Table 11 US: Protective Cultures Market, by Application, 2020–2027 (USD Million)
Table 12 Canada: Protective Cultures Market, by Form, 2020–2027 (USD Million)
Table 13 Canada: Protective Cultures Market, by Target Microorganisms, 2020–2027 (USD Million)
Table 14 Canada: Protective Cultures Market, by Application, 2020–2027 (USD Million)
Table 15 Mexico: Protective Cultures Market, by Form, 2020–2027 (USD Million)
Table 16 Mexico: Protective Cultures Market, by Target Microorganisms, 2020–2027 (USD Million)
Table 17 Mexico: Protective Cultures Market, by Application, 2020–2027 (USD Million)
Table 18 Europe: Protective Cultures Market, by Country, 2020–2027 (USD Million)
Table 19 Europe: Protective Cultures Market, by Form, 2020–2027 (USD Million)
Table 20 Europe: Protective Cultures Market, by Target Microorganisms, 2020–2027 (USD Million)
Table 21 Europe: Protective Cultures Market, by Application, 2020–2027 (USD Million)
Table 22 Germany: Protective Cultures Market, by Form, 2020–2027 (USD Million)
Table 23 Germany: Protective Cultures Market, by Target Microorganisms, 2020–2027 (USD Million)
Table 24 Germany: Protective Cultures Market, by Application, 2020–2027 (USD Million)
Table 25 France: Protective Cultures Market, by Form, 2020–2027 (USD Million)
Table 26 France: Protective Cultures Market, by Target Microorganisms, 2020–2027 (USD Million)
Table 27 France: Protective Cultures Market, by Application, 2020–2027 (USD Million)
Table 28 Italy: Protective Cultures Market, by Form, 2020–2027 (USD Million)
Table 29 Italy: Protective Cultures Market, by Target Microorganisms, 2020–2027 (USD Million)
Table 30 Italy: Protective Cultures Market, by Application, 2020–2027 (USD Million)
Table 31 Spain: Protective Cultures Market, by Form, 2020–2027 (USD Million)
Table 32 Spain: Protective Cultures Market, by Target Microorganisms, 2020–2027 (USD Million)
Table 33 Spain: Protective Cultures Market, by Application, 2020–2027 (USD Million)
Table 34 UK: Protective Cultures Market, by Form, 2020–2027 (USD Million)
Table 35 UK: Protective Cultures Market, by Target Microorganisms, 2020–2027 (USD Million)
Table 36 UK: Protective Cultures Market, by Application, 2020–2027 (USD Million)
Table 37 Rest of Europe: Protective Cultures Market, by Form, 2020–2027 (USD Million)
Table 38 Rest of Europe: Protective Cultures Market, by Target Microorganisms, 2020–2027 (USD Million)
Table 39 Rest of Europe: Protective Cultures Market, by Application, 2020–2027 (USD Million)
Table 40 Asia-Pacific: Protective Cultures Market, by Country, 2020–2027 (USD Million)
Table 41 Asia-Pacific: Protective Cultures Market, by Form, 2020–2027 (USD Million)
Table 42 Asia-Pacific: Protective Cultures Market, by Target Microorganisms, 2020–2027 (USD Million)
Table 43 Asia-Pacific: Protective Cultures Market, by Application, 2020–2027 (USD Million)
Table 44 China: Protective Cultures Market, by Form, 2020–2027 (USD Million)
Table 45 China: Protective Cultures Market, by Target Microorganisms, 2020–2027 (USD Million)
Table 46 China: Protective Cultures Market, by Application, 2020–2027 (USD Million)
Table 47 India: Protective Cultures Market, by Form, 2020–2027 (USD Million)
Table 48 India: Protective Cultures Market, by Target Microorganisms, 2020–2027 (USD Million)
Table 49 India: Protective Cultures Market, by Application, 2020–2027 (USD Million)
Table 50 Japan: Protective Cultures Market, by Form, 2020–2027 (USD Million)
Table 51 Japan: Protective Cultures Market, by Target Microorganisms, 2020–2027 (USD Million)
Table 52 Japan: Protective Cultures Market, by Application, 2020–2027 (USD Million)
Table 53 Rest of Asia-Pacific: Protective Cultures Market, by Form, 2020–2027 (USD Million)
Table 54 Rest of Asia-Pacific: Protective Cultures Market, by Target Microorganisms, 2020–2027 (USD Million)
Table 55 Rest of Asia-Pacific: Protective Cultures Market, by Application, 2020–2027 (USD Million)
Table 56 Rest of the World (RoW): Protective Cultures Market, by Country, 2020–2027 (USD Million)
Table 57 Rest of the World (RoW): Protective Cultures Market, by Form, 2020–2027 (USD Million)
Table 58 Rest of the World (RoW): Protective Cultures Market, by Target Microorganisms, 2020–2027 (USD Million)
Table 59 Rest of the World (RoW): Protective Cultures Market, by Application, 2020–2027 (USD Million)
Table 60 South America: Protective Cultures Market, by Form, 2020–2027 (USD Million)
Table 61 South America: Protective Cultures Market, by Target Microorganisms, 2020–2027 (USD Million)
Table 62 South America: Protective Cultures Market, by Application, 2020–2027 (USD Million)
Table 63 Middle East: Protective Cultures Market, by Form, 2020–2027 (USD Million)
Table 64 Middle East: Protective Cultures Market, by Target Microorganisms, 2020–2027 (USD Million)
Table 65 Middle East: Protective Cultures Market, by Application, 2020–2027 (USD Million)
Table 66 Africa: Protective Cultures Market, by Form, 2020–2027 (USD Million)
Table 67 Africa: Protective Cultures Market, by Target Microorganisms, 2020–2027 (USD Million)
Table 68 Africa: Protective Cultures Market, by Application, 2020–2027 (USD Million)
LIST OF FIGURES
FIGURE 1 Global Protective Culture Market Segmentation
FIGURE 2 Forecast Research Methodology
FIGURE 3 Five Forces Analysis of the Global Protective Culture Market
FIGURE 4 Value Chain of the Global Protective Culture Market
FIGURE 5 Share of the Global Protective Culture Market in 2020, by Country (%)
FIGURE 6 Global Protective Culture Market, by Region, 2020–2027,
FIGURE 7 Global Protective Culture Market Size, by Form, 2020
FIGURE 8 Share of the Global Protective Culture Market, by Form, 2020–2027 (%)
FIGURE 9 Global Protective Culture Market Size, by Target Microorganisms, 2020
FIGURE 10 Share of the Global Protective Culture Market, by Target Microorganisms, 2020–2027 (%)
FIGURE 11 Global Protective Culture Market Size, by Application, 2020
FIGURE 12 Share of the Global Protective Culture Market, by Application, 2020–2027 (%)