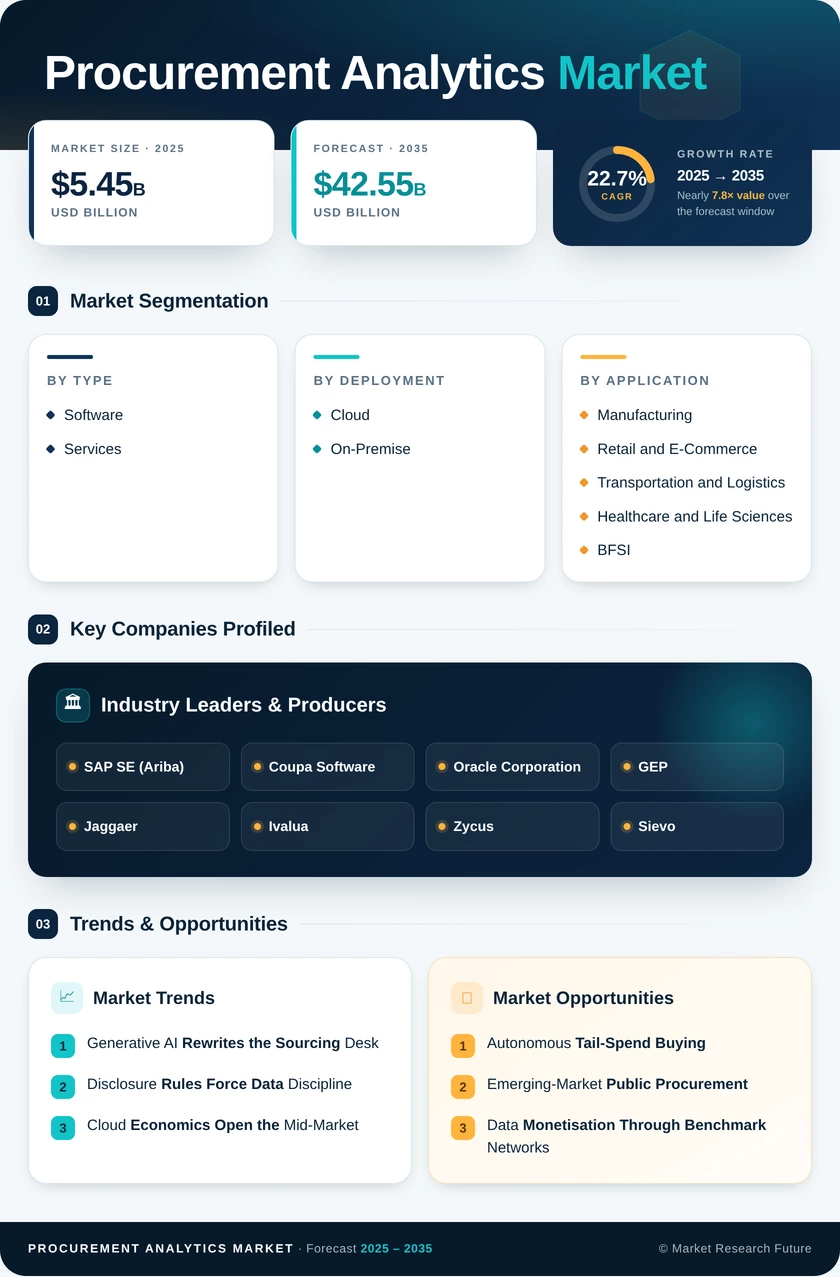
Procurement Analytics Market (2026 – 2035)

ID: MRFR/ICT/6213-HCR 200 Pages Kiran Jinkalwad Last Updated: September 15, 2026
Procurement Analytics Market Size, Share and Research Report By Dirty Data Defeats Good Models, By Sovereignty Rules Complicate Multi-Tenant Hosting, By Talent Scarcity Caps Realised Value and By Regional (North America, Europe, South America, South Africa, Asia Pacific, Middle East and Africa) - Industry Forecast to 2035.
Procurement Analytics Market
Market Size
Forecast Period2026-2035
CAGR (2026-2035)22.7%
2025 Market SizeUSD 5.45 Billion
2035 Market SizeUSD 42.55 Billion
Key Players
SAP SE
Coupa Software
Oracle Corporation
GEP
Jaggaer
Ivalua
Opportunities
  • Autonomous Tail-Spend Buying
  • Emerging-Market Public Procurement
  • Data Monetisation Through Benchmark Networks
  1. 1 Market Overview |
    1. 1.1 Study Assumptions & Market Definition |
    2. 1.2 Scope of the Study |
    3. 1.3 Research Methodology
  2. 2 Market Summary & Key Takeaways |
    1. 2.1 By Technology |
    2. 2.2 By Sector |
    3. 2.3 By Geography
  3. 3 Market Size & Forecast (2021–2035) |
    1. 3.1 Historical Market Size (2021–2025) |
    2. 3.2 Current & Forecast Market Size (2026–2035) |
    3. 3.3 Year-over-Year Growth Analysis
  4. 4 Market Drivers Analysis |
    1. 4.1 Generative AI Rewrites the Sourcing Desk |
    2. 4.2 Disclosure Rules Force Data Discipline |
    3. 4.3 Cloud Economics Open the Mid-Market |
    4. 4.4 Tariff Volatility Rewards Predictive Modelling
  5. 5 Market Restraints Analysis |
    1. 5.1 Dirty Data Defeats Good Models |
    2. 5.2 Sovereignty Rules Complicate Multi-Tenant Hosting |
    3. 5.3 Talent Scarcity Caps Realised Value
  6. 6 Market Opportunity Analysis |
    1. 6.1 Autonomous Tail-Spend Buying |
    2. 6.2 Emerging-Market Public Procurement |
    3. 6.3 Data Monetisation Through Benchmark Networks |
    4. 6.4 Embedded Carbon Accounting |
    5. 6.5 Supplier Financial Distress Prediction |
    6. 6.6 Industry Value Chain Analysis |
    7. 6.7 Porter's Five Forces Analysis
  7. 7 Regional Analysis |
    1. 7.1 North America | |
      1. 7.1.1 US | |
      2. 7.1.2 Canada | |
      3. 7.1.3 Mexico |
    2. 7.2 Europe | |
      1. 7.2.1 Germany | |
      2. 7.2.2 UK | |
      3. 7.2.3 France | |
      4. 7.2.4 Italy | |
      5. 7.2.5 Spain | |
      6. 7.2.6 Nordic Countries | |
      7. 7.2.7 Russia | |
      8. 7.2.8 Rest of Europe |
    3. 7.3 Asia-Pacific | |
      1. 7.3.1 China | |
      2. 7.3.2 India | |
      3. 7.3.3 Japan | |
      4. 7.3.4 South Korea | |
      5. 7.3.5 ASEAN | |
      6. 7.3.6 Rest of Asia-Pacific |
    4. 7.4 South America | |
      1. 7.4.1 Brazil | |
      2. 7.4.2 Argentina | |
      3. 7.4.3 Rest of South America |
    5. 7.5 Middle East & Africa | |
      1. 7.5.1 Saudi Arabia | |
      2. 7.5.2 UAE | |
      3. 7.5.3 South Africa | |
      4. 7.5.4 Egypt | |
      5. 7.5.5 Rest of MEA
  8. 8 Future Outlook (2026–2035) |
    1. 8.1 Agentic Buying Becomes Default |
    2. 8.2 Platform Economics Reward Network Density |
    3. 8.3 Carbon Becomes a Contract Term |
    4. 8.4 Resilience Spending Outlives the Shock Cycle
  9. 9 Segmentation Analysis |
    1. 9.1 By Type | |
      1. 9.1.1 Software | |
      2. 9.1.2 Services |
    2. 9.2 By Deployment | |
      1. 9.2.1 On-Premise | |
      2. 9.2.2 Cloud |
    3. 9.3 By Application | |
      1. 9.3.1 Spend Analytics | |
      2. 9.3.2 Supply Chain Analytics | |
      3. 9.3.3 Risk Analytics | |
      4. 9.3.4 Contract Analytics | |
      5. 9.3.5 Other Applications |
    4. 9.4 By End-User Industry | |
      1. 9.4.1 Manufacturing | |
      2. 9.4.2 Retail and E-Commerce | |
      3. 9.4.3 Transportation and Logistics | |
      4. 9.4.4 Healthcare and Life Sciences | |
      5. 9.4.5 BFSI | |
      6. 9.4.6 Energy and Utilities | |
      7. 9.4.7 Other Industries |
    5. 9.5 By Organization Size | |
      1. 9.5.1 Large Enterprises | |
      2. 9.5.2 Small and Medium Enterprises
  10. 10 Competitive Landscape |
    1. 10.1 Market Share Analysis (2026) |
    2. 10.2 Competitive Benchmarking Matrix |
    3. 10.3 Company Profiles | |
      1. 10.3.1 SAP SE (Ariba) | |
      2. 10.3.2 Coupa Software | |
      3. 10.3.3 Oracle Corporation | |
      4. 10.3.4 GEP | |
      5. 10.3.5 Jaggaer | |
      6. 10.3.6 Ivalua | |
      7. 10.3.7 Zycus | |
      8. 10.3.8 Sievo | |
      9. 10.3.9 Basware | |
      10. 10.3.10 IBM Corporation | |
      11. 10.3.11 Accenture plc | |
      12. 10.3.12 Microsoft Corporation
  11. 11 Recent Developments & News
  12. 12 Report Scope & Methodology |
    1. 12.1 Study Period & Base Year |
    2. 12.2 Data Sources & Citations |
    3. 12.3 Abbreviations
  13. 13 Detailed Sources and Citations
  14. 14 Frequently Asked Questions (FAQs)
  15. 15 LIST OF TABLES |
  16. TABLE 1 Global Procurement Analytics Market Size & Forecast, by Revenue (USD Billion), 2021–2035 |
  17. TABLE 2 Global Procurement Analytics Market – Year-over-Year Growth Analysis, 2021–2035 |
  18. TABLE 3 Driver Impact Analysis Matrix, 2026–2035 |
  19. TABLE 4 Restraint Impact Analysis Matrix, 2026–2035 |
  20. TABLE 5 Global Procurement Analytics Market Size, by Type, 2021–2035 (USD Billion) |
  21. TABLE 6 Global Procurement Analytics Market Size, by Deployment, 2021–2035 (USD Billion) |
  22. TABLE 7 Global Procurement Analytics Market Size, by Application, 2021–2035 (USD Billion) |
  23. TABLE 8 Global Procurement Analytics Market Size, by End-User Industry, 2021–2035 (USD Billion) |
  24. TABLE 9 Global Procurement Analytics Market Size, by Organization Size, 2021–2035 (USD Billion) |
  25. TABLE 10 Global Procurement Analytics Market Size, by Region, 2021–2035 (USD Billion) |
  26. TABLE 11 North America Procurement Analytics Market Size, by Country, 2021–2035 (USD Billion) |
  27. TABLE 12 Europe Procurement Analytics Market Size, by Country, 2021–2035 (USD Billion) |
  28. TABLE 13 Asia-Pacific Procurement Analytics Market Size, by Country, 2021–2035 (USD Billion) |
  29. TABLE 14 South America Procurement Analytics Market Size, by Country, 2021–2035 (USD Billion) |
  30. TABLE 15 Middle East & Africa Procurement Analytics Market Size, by Country, 2021–2035 (USD Billion) |
  31. TABLE 16 North America Procurement Analytics Market Size, by Type and Deployment, 2021–2035 (USD Billion) |
  32. TABLE 17 Europe Procurement Analytics Market Size, by Application and End-User Industry, 2021–2035 (USD Billion) |
  33. TABLE 18 Asia-Pacific Procurement Analytics Market Size, by Application and Organization Size, 2021–2035 (USD Billion) |
  34. TABLE 19 South America Procurement Analytics Market Size, by Type and Application, 2021–2035 (USD Billion) |
  35. TABLE 20 Middle East & Africa Procurement Analytics Market Size, by Deployment and End-User Industry, 2021–2035 (USD Billion) |
  36. TABLE 21 Competitive Benchmarking Matrix – Global Procurement Analytics Market, 2026 |
  37. TABLE 22 Company Profiles – Key Players, Global Procurement Analytics Market |
  38. TABLE 23 Recent Developments & Strategic Announcements, 2023–2025 |
  39. TABLE 24 Report Scope & Methodology Summary |
  40. TABLE 25 Detailed Sources and Citations Index
  41. 16 LIST OF FIGURES |
  42. FIGURE 1 Global Procurement Analytics Market Dynamics – Drivers, Restraints and Opportunities |
  43. FIGURE 2 Industry Value Chain Analysis – Procurement Analytics |
  44. FIGURE 3 Porter's Five Forces Analysis – Procurement Analytics |
  45. FIGURE 4 Global Market Size Trend and Forecast, 2021–2035 (USD Billion) |
  46. FIGURE 5 Year-over-Year Growth Curve, 2022–2035 (%) |
  47. FIGURE 6 Market Share by Type, 2025 vs 2035 (%) |
  48. FIGURE 7 Market Share by Deployment, 2025 vs 2035 (%) |
  49. FIGURE 8 Market Share by Application, 2025 (%) |
  50. FIGURE 9 Market Share by End-User Industry, 2025 (%) |
  51. FIGURE 10 Market Share by Organization Size, 2025 vs 2035 (%) |
  52. FIGURE 11 Regional Revenue Share, 2025 (%) |
  53. FIGURE 12 Regional CAGR Comparison, 2026–2035 (%) |
  54. FIGURE 13 North America Country-Level Share, 2025 (%) |
  55. FIGURE 14 Europe Country-Level Share, 2025 (%) |
  56. FIGURE 15 Asia-Pacific Country-Level Share, 2025 (%) |
  57. FIGURE 16 Competitive Landscape – Vendor Positioning Quadrant, 2026 |
  58. FIGURE 17 Estimated Revenue Share Ranges of Leading Vendors, 2026 (%)

Segmentation Quick Reference

DimensionSub-SegmentsDominant SegmentFastest Growing Segment
By TypeSoftware; ServicesSoftwareServices
By DeploymentOn-Premise; CloudCloudCloud
By ApplicationSpend Analytics; Supply Chain Analytics; Risk Analytics; Contract Analytics; Other ApplicationsSpend AnalyticsRisk Analytics
By End-User IndustryManufacturing; Transportation and Logistics; Retail and E-Commerce; Healthcare and Life Sciences; BFSI; Energy and Utilities; Other IndustriesManufacturingHealthcare and Life Sciences
By Organization SizeLarge Enterprises; Small and Medium EnterprisesLarge EnterprisesSmall and Medium Enterprises
By GeographyNorth America; Europe; Asia-Pacific; South America; Middle East & AfricaNorth AmericaAsia-Pacific


Market Segmentation Overview

By Type

Sub-SegmentKey Trend
SoftwareModular expansion from classification into predictive award recommendation
ServicesRising demand for taxonomy remediation and model tuning engagements


Licence revenue still dominates, but the incremental dollar increasingly flows to integration and managed analytics work as estates grow more heterogeneous.

By Deployment

Sub-SegmentKey Trend
On-PremiseRetained where residency rules or legacy ERP coupling prevent migration
CloudDefault for new deployments; enables consumption-based commercial models.


Hosting decisions now follow regulatory geography as much as IT preference, prompting vendors to expand in-region infrastructure footprints.

By Application

Sub-SegmentKey Trend
Spend AnalyticsEntry module delivering first-year savings baselines
Supply Chain AnalyticsMulti-tier mapping moving from pilot to standard practice.
Risk AnalyticsSolvency, cyber, and geopolitical scoring converge into single dashboards.
Contract AnalyticsClause extraction reduces renewal leakage and pricing drift.
Other ApplicationsSupplier diversity tracking and tail automation gain budget


Application breadth is widening as buyers move past savings measurement toward exposure management and contract enforcement.

By End-User Industry

Sub-SegmentKey Trend
ManufacturingDirect-material should-cost modelling under input volatility
Transportation and LogisticsFreight rate benchmarking against spot and contract indices
Retail and E-CommercePrivate-label sourcing and assortment cost optimisation
Healthcare and Life SciencesShortage prediction and group purchasing contract compliance
BFSIThird-party risk regulation drives supplier governance tooling.
Energy and UtilitiesCapital project sourcing and long-lead equipment tracking
Other IndustriesPublic sector transparency mandates expand addressable demand.


Vertical demand correlates closely with direct-material intensity and regulatory supervision, which explains why manufacturing leads while healthcare compounds fastest.

By Organization Size

Sub-SegmentKey Trend
Large EnterprisesGlobal category consolidation across multiple ERP instances
Small and Medium EnterprisesSubscription tiers remove capital barriers to entry.


Enterprise buyers still supply the majority of revenue, yet mid-market adoption is where unit growth is concentrated through the forecast decade.




Download PDF ×

We do not share your information with anyone. However, we may send you emails based on your report interest from time to time. You may contact us at any time to opt-out.