• Cat-intel
  • MedIntelliX
  • Resources
  • About Us
  • Hero Background
    English
    Chinese
    French
    Japanese
    Korean
    German
    Spanish

    Procurement Analytics Market Analysis

    ID: MRFR/ICT/6213-HCR
    200 Pages
    Aarti Dhapte
    October 2025

    Procurement Analytics Market Research Report By Deployment Type (Cloud, On-premises, Hybrid), By Application (Spend Analysis, Supplier Performance Analysis, Contract Management, Risk Management), By End User (Retail, Manufacturing, Healthcare, IT, Telecommunications), By Component (Software, Services) and By Regional (North America, Europe, South America, Asia Pacific, Middle East and Africa) -...

    Share:
    Download PDF ×

    We do not share your information with anyone. However, we may send you emails based on your report interest from time to time. You may contact us at any time to opt-out.

    Procurement Analytics Market Infographic
    $ 4,950.0
    $ 5,950.0
    $ 7,250.0

    Market Analysis

    In-depth Analysis of Procurement Analytics Market Industry Landscape

    The procurement analytics market is influenced by a variety of market factors that shape its growth and trajectory. One significant factor is the increasing demand for data-driven decision-making in procurement processes across industries. As businesses strive to optimize their procurement strategies and reduce costs, the adoption of analytics solutions becomes essential. This demand is further fueled by the growing complexity of global supply chains and the need for greater transparency and efficiency.

    Technological advancements also play a crucial role in driving the procurement analytics market. The advent of big data analytics, artificial intelligence, and machine learning has enabled organizations to process and analyze large volumes of procurement data in real-time, uncovering valuable insights and opportunities for optimization. Additionally, the proliferation of cloud computing has made analytics solutions more accessible and scalable, empowering businesses of all sizes to leverage advanced analytics capabilities.

    Another market factor shaping the procurement analytics landscape is the increasing focus on risk management and compliance. With regulatory requirements becoming more stringent and supply chain risks on the rise, organizations are turning to analytics solutions to identify and mitigate potential risks such as supplier fraud, supply chain disruptions, and compliance violations. By leveraging predictive analytics and risk modeling techniques, businesses can proactively manage risks and ensure continuity in their procurement operations.

    The competitive landscape also exerts a significant influence on the procurement analytics market. As more players enter the market, competition intensifies, driving innovation and prompting vendors to differentiate themselves through advanced analytics capabilities, industry-specific solutions, and value-added services. This competitive pressure benefits buyers, as they gain access to a wider range of options and solutions tailored to their specific needs.

    Furthermore, the growing awareness of sustainability and corporate social responsibility (CSR) practices is shaping the procurement analytics market. Businesses are increasingly scrutinizing their supply chains to ensure ethical sourcing practices, minimize environmental impact, and support social initiatives. Analytics solutions play a crucial role in enabling organizations to track and measure their sustainability performance, identify areas for improvement, and drive positive change throughout the supply chain.

    Market dynamics such as mergers and acquisitions also influence the procurement analytics landscape. Consolidation among vendors can lead to shifts in market share, changes in pricing strategies, and the introduction of new capabilities and offerings. Additionally, partnerships and strategic alliances between vendors and other stakeholders such as consulting firms, technology providers, and industry associations can accelerate market growth and foster innovation.

    Moreover, economic factors such as fluctuating raw material prices, currency exchange rates, and geopolitical instability can impact procurement decisions and drive demand for analytics solutions. By providing visibility into cost drivers, market trends, and supplier performance, analytics solutions enable organizations to make informed decisions and navigate volatile market conditions more effectively.

    Market Summary

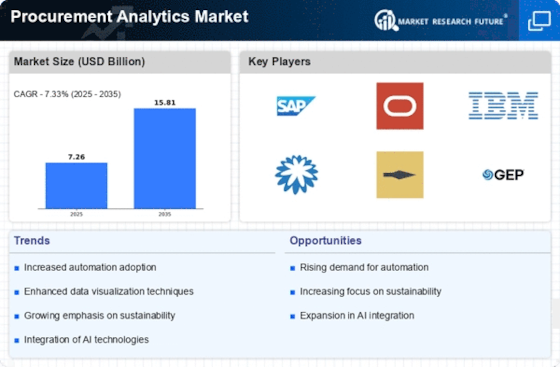
    As per Market Research Future Analysis, the Procurement Analytics Market was valued at 6.77 USD Billion in 2023 and is projected to grow to 15.8 USD Billion by 2035, with a CAGR of 7.32% from 2025 to 2035. The market is driven by the need for cost optimization, regulatory compliance, and technological advancements in analytics capabilities.

    Key Market Trends & Highlights

    The Global Procurement Analytics Market is undergoing significant transformation due to technological advancements and increasing demand for data-driven decision-making.

    • The market is expected to reach 7.26 USD Billion in 2024, growing to 15.8 USD Billion by 2035.
    • Cloud solutions are projected to grow from 3.0 USD Billion in 2024 to 6.8 USD Billion by 2035.
    • Retail and Manufacturing sectors are key end users, leveraging analytics for efficiency and cost reduction.

    Market Size & Forecast

    2023 Market Size USD 6.77 Billion
    2024 Market Size USD 7.26 Billion
    2035 Market Size USD 15.8 Billion
    CAGR (2025-2035) 7.32%
    Largest Regional Market Share in 2024 North America

    Major Players

    IBM, Ariba, SAP, Bain and Company, Procurify, InfoSys, Coupa Software, Jaggaer, Kinaxis, GEP Worldwide, Zycus, Icertis, Microsoft, SAS Institute, Oracle

    Market Trends

    The Procurement Analytics Market is witnessing significant growth due to several key market drivers. The increasing need for organizations to enhance their supply chain efficiencies and make data-driven decisions is pushing demand for procurement analytics tools. Companies are recognizing the necessity of leveraging big data and advanced analytics to optimize procurement strategies, identify cost-saving opportunities, and improve supplier relationships.

    Additionally, the rise of artificial intelligence and machine learning technologies is enabling more sophisticated analytical capabilities, allowing businesses to predict procurement trends and manage risks more effectively.

    Also, small and medium-sized businesses will be able to access procurement analytics tools more easily with the use of more advanced cloud solutions. This will make the market bigger. Recently, there has been a clear trend of companies putting digital transformation projects at the top of their lists of things to do. This has led to more money being spent on procurement analytics solutions.

    This trend is further accelerated by the ongoing challenges related to global supply chain disruptions, which force companies to re-evaluate their sourcing and procurement strategies. A focus on real-time analytics and the adoption of collaborative tools to improve communication between procurement teams and suppliers has also become prominent. As organizations strive for agility and responsiveness, the importance of procurement analytics will continue to rise globally, shaping the future of procurement practices.

    The increasing complexity of global supply chains necessitates enhanced procurement analytics capabilities to drive efficiency and informed decision-making.

    U.S. Department of Commerce

    Procurement Analytics Market Market Drivers

    Market Growth Projections

    The Global Procurement Analytics Market Industry is poised for substantial growth, with projections indicating a market size of 7.26 USD Billion in 2024 and an anticipated increase to 15.8 USD Billion by 2035. This growth trajectory suggests a compound annual growth rate of 7.33% from 2025 to 2035, reflecting the increasing adoption of analytics solutions across various industries. The rising demand for data-driven insights, coupled with advancements in technology, is likely to drive this market expansion. Organizations are expected to invest significantly in procurement analytics to enhance decision-making and improve operational efficiency.

    Global Supply Chain Resilience

    The need for global supply chain resilience is a significant driver in the Global Procurement Analytics Market Industry. Organizations are recognizing the importance of building resilient supply chains that can withstand disruptions and adapt to changing market conditions. Procurement analytics plays a vital role in enhancing supply chain visibility, enabling companies to identify vulnerabilities and develop contingency plans. As businesses strive to create more agile and responsive supply chains, the demand for analytics solutions is likely to increase. This focus on resilience is expected to shape the future of procurement analytics, fostering innovation and strategic planning.

    Integration of Advanced Technologies

    The integration of advanced technologies such as artificial intelligence and machine learning is transforming the Global Procurement Analytics Market Industry. These technologies enable organizations to analyze vast amounts of procurement data, identify patterns, and forecast future trends. As a result, companies can streamline their procurement processes, reduce costs, and enhance supplier performance. The anticipated growth of the market to 15.8 USD Billion by 2035 underscores the potential of these technologies in driving efficiency and innovation within procurement functions. Organizations that adopt these advanced analytics solutions are likely to achieve significant improvements in their procurement outcomes.

    Focus on Cost Reduction and Efficiency

    Cost reduction remains a primary focus for organizations within the Global Procurement Analytics Market Industry. As businesses face increasing pressure to optimize their budgets, procurement analytics provides valuable insights into spending patterns and supplier performance. By utilizing analytics tools, organizations can identify areas for cost savings, negotiate better contracts, and enhance supplier collaboration. The projected compound annual growth rate of 7.33% from 2025 to 2035 indicates a sustained commitment to leveraging analytics for cost efficiency. This focus on reducing procurement costs while maintaining quality is likely to drive further adoption of analytics solutions.

    Regulatory Compliance and Risk Management

    Regulatory compliance and risk management are critical drivers in the Global Procurement Analytics Market Industry. Organizations are increasingly required to adhere to stringent regulations and standards, necessitating robust analytics solutions to monitor compliance and mitigate risks. Procurement analytics enables companies to assess supplier risks, track compliance metrics, and ensure adherence to industry regulations. As the market evolves, the emphasis on risk management is expected to grow, prompting organizations to invest in analytics tools that provide real-time insights into compliance and risk factors. This trend highlights the importance of analytics in maintaining operational integrity.

    Rising Demand for Data-Driven Decision Making

    The Global Procurement Analytics Market Industry experiences a notable surge in demand for data-driven decision-making processes. Organizations increasingly recognize the value of leveraging analytics to enhance procurement strategies, optimize supplier relationships, and improve overall operational efficiency. In 2024, the market is projected to reach 7.26 USD Billion, reflecting a growing trend among businesses to utilize data insights for informed purchasing decisions. This shift towards analytics-driven procurement is likely to continue, as companies seek to gain competitive advantages through enhanced visibility and predictive capabilities in their supply chains.

    Market Segment Insights

    Procurement Analytics Market Deployment Type Insights

    The Procurement Analytics Market is experiencing notable expansion, particularly within the Deployment Type segment, which comprises Cloud, On-premises, and Hybrid categories. By 2024, the Cloud deployment segment is expected to reach a valuation of 3.0 USD Billion, indicating a significant shift toward cloud-based solutions due to their scalability and cost-effectiveness. This sub-segment is projected to grow to 6.5 USD billion by 2035, reflecting the trend where organizations favor cloud options for improved accessibility and collaboration across global teams.

    Meanwhile, the On-premises segment is valued at 2.5 USD Billion in 2024, with growth expected to elevate it to 5.5 USD Billion in 2035. This deployment option remains crucial for organizations prioritizing data security and regulatory compliance, thus holding a considerable share in the market. Additionally, the Hybrid deployment model is valued at 1.76 USD billion in 2024, expected to grow to 3.8 USD billion by 2035, catering to businesses that require both on-premises stability and cloud flexibility. The Hybrid approach appeals to organizations looking for a balanced solution, combining the benefits of both cloud and on-premises deployments.

    The rise in cloud-first strategies and digital transformation initiatives globally has reinforced the importance of these deployment types. Moreover, the continuous evolution of procurement practices, driven by increasing data requirements and a need for effective supplier management, presents significant opportunities for providers in this space. Challenges such as data integration and security remain, but the demand for procurement analytics tools that can operate across multiple deployment types continues to grow. The segment dynamics reflect broader market trends, showcasing how technology advancements and changing business needs are shaping deployment preferences within the Procurement Analytics Market landscape.

    Source: Primary Research, Secondary Research, Market Research Future Database, and Analyst Review

    Procurement Analytics Market Application Insights

    The Procurement Analytics Market is projected to reach approximately 7.26 USD Billion in 2024, showcasing significant growth within the Application domain. This segment is pivotal in enhancing procurement processes by leveraging data analytics to improve efficiency and decision-making. Within this domain, Spend Analysis plays a crucial role as it helps organizations scrutinize expenditure and identify cost-saving opportunities, leading to optimization. Supplier Performance Analysis is another key aspect, enabling businesses to evaluate suppliers based on various metrics, ensuring high standards and reliability in the supply chain.

    Contract Management stands out for streamlining procurement agreements, facilitating adherence to terms, and minimizing risks associated with non-compliance. Meanwhile, Risk Management is essential for identifying and mitigating potential supply chain vulnerabilities, thereby safeguarding organizational interests. The market reflects a growing emphasis on data-driven decision-making across these applications, underscoring the significance of effective procurement strategies in a globalized economy. As organizations increasingly adopt advanced analytics, the Procurement Analytics Market data indicates robust growth potential driven by the necessity for efficiency and risk mitigation in procurement operations.

    Procurement Analytics Market End User Insights

    The Procurement Analytics Market, focusing on the End User segment, is poised for growth as businesses increasingly recognize the value of data-driven decision-making. By 2024, the market is expected to reach 7.26 USD Billion, reflecting a robust demand across various sectors. Within this landscape, the Retail and Manufacturing industries play a crucial role as they seek efficient supply chain management and cost reduction strategies. Healthcare organizations leverage procurement analytics to optimize resource allocation and improve patient care outcomes.

    The IT sector benefits from enhanced vendor management, while Telecommunications companies utilize analytics for improved service delivery. Collectively, these areas contribute to the market dynamics, with organizations adopting advanced analytical tools to gain insights into procurement processes. The Procurement Analytics Market data showcases varied growth drivers, such as the rise in digital transformation initiatives and increasing demand for efficiency. However, challenges like data integration and cybersecurity concerns remain pertinent.

    Overall, the trends indicate a shift toward smart procurement practices across all sectors, offering significant opportunities for innovative solutions in the market.

    Procurement Analytics Market Component Insights

    The Component segment of the Procurement Analytics Market includes crucial categories such as Software and Services, which play a pivotal role in driving efficiency and strategic decision-making in procurement processes. As the market is projected to reach a valuation of USD 7.26 billion in 2024 and continue to grow significantly, these components are essential in managing procurement data effectively. Software solutions are becoming increasingly important as organizations recognize the need for advanced analytics to gain insights from their supplier relationships and purchasing behaviors.

    This segment generally garners a majority holding in terms of market revenue, as businesses invest heavily in technologies that enhance visibility and control over procurement activities. Services, on the other hand, encompass critical functions such as consulting, implementation, and support, which enable companies to maximize the benefits of procurement analytics tools. The growing trend towards automation and digitization in procurement strategies further underlines the importance of these components, presenting opportunities for innovative solutions and improved resource management in a highly competitive global market.

    Get more detailed insights about Procurement Analytics Market Research Report-Forecast to 2035

    Regional Insights

    The Regional segment of the Procurement Analytics Market exhibits notable diversity in valuations and growth trajectories. In 2024, North America leads this segment with an expected value of 2.2 USD Billion, growing to 4.7 USD billion by 2035, largely driven by the strong technological adoption and a mature market for analytics solutions. Europe follows closely with a valuation of 1.8 USD Billion in 2024, anticipated to reach 3.9 USD billion in 2035, underscoring its importance in the analytics landscape.

    The Asia Pacific region, valued at 2.0 USD Billion in 2024 and projected to attain 4.3 USD billion by 2035, demonstrates significant growth potential due to increasing digital transformation and investment in procurement strategies.

    South America and the Middle East, and Africa represent smaller segments, with values of 0.6 USD Billion and 0.66 USD billion in 2024, respectively, yet both are poised for gradual growth as awareness of procurement analytics expands. These figures reflect the Procurement Analytics Market segmentation, highlighting the contributions from different regions, which are crucial for understanding market dynamics and the overall industry landscape. The increasing adoption of data-driven decision-making in procurement practices signifies the importance of these regional markets, driving their respective valuations forward.

    Procurement Analytics Market Regional Insights

    Source: Primary Research, Secondary Research, Market Research Future Database, and Analyst Review

    Key Players and Competitive Insights

    The Procurement Analytics Market has been witnessing significant growth as organizations increasingly recognize the value of data-driven insights in improving procurement processes and decision-making. This market is characterized by a rapidly evolving landscape where numerous key players are striving to leverage advanced technologies such as artificial intelligence, machine learning, and big data analytics. Competitive insights reveal that market participants are not only focused on enhancing their product offerings but are also actively seeking to establish strategic partnerships and collaborations to strengthen their market positions.

    As more companies adopt procurement analytics solutions, the focus on innovative features, capabilities, and customer service is becoming increasingly important to differentiate one offering from another in this growing market.

    Basware has positioned itself as a strong player in the Procurement Analytics Market, with a robust portfolio of solutions designed to enhance procurement efficiency and decision-making. The company's strengths lie in its comprehensive analytics tools that offer insights into procurement processes, supplier performance, and spending patterns. Basware caters to a diverse range of industries, which reinforces its presence in the global market. The company has made substantial investments in research and development, continuously innovating to ensure that its offerings remain at the forefront of technological advancements.

    This commitment to innovation, combined with a strong reputation for reliability and client support, has solidified Basware's standing as a trusted provider in procurement analytics.

    Tealbook is another notable entity within the Procurement Analytics Market, known for its unique approach to supplier data and insights. The company focuses on providing a comprehensive platform that centralizes supplier information, thereby improving procurement agility and transparency. Tealbook’s key products and services include its robust supplier data management tools and advanced analytics capabilities, enabling organizations to make informed procurement decisions. With a strong emphasis on integrating artificial intelligence into its offerings, Tealbook enhances the accuracy of supplier evaluations and market insights.

    The company has been proactive in forging strategic partnerships and collaborations to expand its market presence, and its commitment to innovation is evident in its continuous efforts to enhance its product functionality. Overall, Tealbook stands out in the global procurement analytics landscape due to its focus on data-driven insights that empower organizations to optimize their supplier relationships and procurement strategies.

    Key Companies in the Procurement Analytics Market market include

    Industry Developments

    There have been a lot of changes in the Procurement Analytics Market lately, especially from big companies like Basware, Tealbook, Coupa, Oracle, and GEP. GEP QUANTUM, GEP's AI-first platform, was launched in October 2023. Its goal is to provide more information about procurement, supply chains, and sustainability initiatives. This was a major breakthrough in how artificial intelligence can be used in platforms for procurement analytics.

    Thoma Bravo bought Coupa in February 2023, and the company has continued to improve its data capabilities through its unified spend platform. But, despite what was said, Coupa did not announce the purchase of a dedicated analytics company in September 2023.

    IBM is still improving its procurement-related products, but there was no announcement of a new procurement intelligence suite in July 2023. Ivalua is said to have grown its user base, which shows that there is a growing need for strong procurement analytics tools. However, the exact number of 20% growth has not been confirmed in public sources.

    In general, the procurement analytics market has grown steadily. This is because more money is being spent on digital transformation, supplier risk management, and data-driven decision-making, especially since companies have had to deal with problems in the global supply chain since 2020. Companies like SAP, Zycus, Jaggaer, and SpendHQ are always coming up with new ways to help businesses better manage their costs and work with suppliers by using real-time analytics.

    Future Outlook

    Procurement Analytics Market Future Outlook

    The Procurement Analytics Market is projected to grow at a 7.33% CAGR from 2024 to 2035, driven by digital transformation, data-driven decision-making, and supply chain optimization.

    New opportunities lie in:

    • Leverage AI-driven analytics to enhance supplier performance evaluation.
    • Develop cloud-based procurement solutions for real-time data access.
    • Implement predictive analytics to optimize inventory management strategies.

    By 2035, the Procurement Analytics Market is expected to achieve substantial growth, reflecting evolving business needs and technological advancements.

    Market Segmentation

    Procurement Analytics Market End User Outlook

    • Retail
    • Manufacturing
    • Healthcare
    • IT
    • Telecommunications

    Procurement Analytics Market Regional Outlook

    • North America
    • Europe
    • South America
    • Asia Pacific
    • Middle East and Africa

    Procurement Analytics Market Component Outlook

    • Software
    • Services

    Procurement Analytics Market Application Outlook

    • Spend Analysis
    • Supplier Performance Analysis
    • Contract Management
    • Risk Management

    Procurement Analytics Market Deployment Type Outlook

    • Cloud
    • On-premises
    • Hybrid

    Report Scope

    Report Attribute/Metric

    Details

    Market Size 2023

    6.77 (USD Billion)

    Market Size 2024

    7.26 (USD Billion)

    Market Size 2035

    15.8 (USD Billion)

    Compound Annual Growth Rate (CAGR)

    7.33% (2025 - 2035)

    Report Coverage

    Revenue Forecast, Competitive Landscape, Growth Factors, and Trends

    Base Year

    2024

    Market Forecast Period

    2025 - 2035

    Historical Data

    2019 - 2024

    Market Forecast Units

    USD Billion

    Key Companies Profiled

    Basware, Tealbook, Coupa, Determine, Oracle, GEP, Ivalua, IBM, SpendHQ, Jaggaer, SynerTrade, Zycus, SAP, Procurify, ProcurementIQ

    Segments Covered

    Deployment Type, Application, End User, Component, Regional

    Key Market Opportunities

    AI and machine learning integration, Real-time data analysis demand, Increased focus on cost reduction, Supplier risk management enhancement, Cloud-based solutions adoption

    Key Market Dynamics

    Increasing data-driven decision making, Rising demand for cost efficiency, Integration of AI technologies, Need for supplier risk management, and Growing adoption of cloud solutions.

    Countries Covered

    North America, Europe, APAC, South America, MEA

    Market Highlights

    Author

    Aarti Dhapte
    Team Lead - Research

    She holds an experience of about 6+ years in market research and business consulting, working under the spectrum of information communication technology, telecommunications and semiconductor domains. aarti conceptualizes and implements a scalable business strategy and provides strategic leadership to the clients. her expertise lies in market estimation, competitive intelligence, pipeline analysis, customer assessment, etc.

    Leave a Comment

    Latest Comments

    John Doe
    john@example.com

    This is a great article! Really helped me understand the topic better.

    Posted on July 23, 2025, 10:15 AM
    Jane Smith
    jane@domain.com

    Thanks for sharing this. I’ve bookmarked it for later reference.

    Posted on July 22, 2025, 7:45 PM

    FAQs

    What is the expected market size of the Procurement Analytics Market in 2024?

    The Procurement Analytics Market is expected to be valued at 7.26 USD billion in 2024.

    What is the projected market growth rate for the Procurement Analytics Market from 2025 to 2035?

    The market is expected to grow at a CAGR of 7.33% from 2025 to 2035.

    How much is the North American segment of the Procurement Analytics Market expected to be worth in 2035?

    The North American segment is projected to reach a value of 4.7 USD billion by 2035.

    What is the market value of the Cloud deployment type in the Procurement Analytics Market for 2024?

    The Cloud deployment type is expected to be valued at 3.0 USD Billion in 2024.

    Who are the key players in the Procurement Analytics Market?

    Major players include Basware, Coupa, Oracle, GEP, and SAP, among others.

    What is the expected market size of the Procurement Analytics Market in Asia Pacific for 2035?

    The Asia Pacific region is expected to reach a market size of 4.3 USD billion by 2035.

    What is the projected market size for the On-premises deployment type in 2035?

    The On-premises deployment type is projected to be valued at 5.5 USD Billion in 2035.

    How much is the South American segment expected to grow by 2035?

    The South American segment is expected to grow to 1.3 USD billion by 2035.

    What are the growth drivers for the Procurement Analytics Market?

    Increasing need for data-driven decision-making and cost reduction initiatives are key growth drivers.

    What is the projected market value for the Hybrid deployment type in 2035?

    The Hybrid deployment type is expected to be valued at 3.8 USD billion by 2035.

    1. FACTOR ANALYSIS
      1. \r\n\r\n\r\nValue chain Analysis
      2. \r\n\r\n\r\nPorter's Five Forces
      3. Analysis
      4. \r\n\r\n\r\nBargaining Power of Suppliers
      5. \r\n\r\n\r\nBargaining Power of Buyers
      6. \r\n\r\n\r\nThreat of New Entrants
      7. \r\n\r\n\r\nThreat of Substitutes
      8. \r\n\r\n\r\nIntensity of Rivalry
      9. \r\n\r\n\r\n\r\n\r\nCOVID-19 Impact
      10. Analysis
      11. \r\n\r\n\r\nMarket Impact Analysis
      12. \r\n\r\n\r\nRegional Impact
      13. \r\n\r\n\r\nOpportunity and
      14. Threat Analysis
      15. \r\n\r\n\r\n\r\n\r\n\r\n\r\n
      16. \r\n
    2. \r\n\r\n\r\nPROCUREMENT ANALYTICS MARKET, BY Deployment Type (USD
      1. Billion)
      2. \r\n\r\n\r\nCloud
      3. \r\n\r\n\r\nOn-premises
      4. \r\n\r\n\r\nHybrid
      5. \r\n\r\n\r\n\r\n\r\nPROCUREMENT
    3. ANALYTICS MARKET, BY Application (USD Billion)
      1. \r\n\r\n\r\nSpend Analysis
      2. \r\n\r\n\r\nSupplier Performance
      3. Analysis
      4. \r\n\r\n\r\nContract Management
      5. \r\n\r\n\r\nRisk Management
      6. \r\n\r\n\r\n\r\n\r\nPROCUREMENT ANALYTICS MARKET, BY
      7. End User (USD Billion)
      8. \r\n\r\n\r\nRetail
      9. \r\n\r\n\r\nManufacturing
      10. \r\n\r\n\r\nHealthcare
      11. \r\n\r\n\r\nIT
      12. \r\n\r\n\r\nTelecommunications
      13. \r\n\r\n\r\n\r\n\r\nPROCUREMENT ANALYTICS MARKET, BY
      14. Component (USD Billion)
      15. \r\n\r\n\r\nSoftware
      16. \r\n\r\n\r\nServices
      17. \r\n\r\n\r\n\r\n\r\nPROCUREMENT
    4. ANALYTICS MARKET, BY Regional (USD Billion)
      1. \r\n\r\n\r\nNorth America
      2. \r\n\r\n\r\nUS
      3. \r\n\r\n\r\nCanada
      4. \r\n\r\n\r\n\r\n\r\nEurope
      5. \r\n\r\n\r\nGermany
      6. \r\n\r\n\r\nUK
      7. \r\n\r\n\r\nFrance
      8. \r\n\r\n\r\nRussia
      9. \r\n\r\n\r\nItaly
      10. \r\n\r\n\r\nSpain
      11. \r\n\r\n\r\nRest of Europe
      12. \r\n\r\n\r\n\r\n\r\nAPAC
      13. \r\n\r\n\r\nChina
      14. \r\n\r\n\r\nIndia
      15. \r\n\r\n\r\nJapan
      16. \r\n\r\n\r\nSouth Korea
      17. \r\n\r\n\r\nMalaysia
      18. \r\n\r\n\r\nThailand
      19. \r\n\r\n\r\nIndonesia
      20. \r\n\r\n\r\nRest of APAC
      21. \r\n\r\n\r\n\r\n\r\nSouth America
      22. \r\n\r\n\r\nBrazil
      23. \r\n\r\n\r\nMexico
      24. \r\n\r\n\r\nArgentina
      25. \r\n\r\n\r\nRest of South America
      26. \r\n\r\n\r\n\r\n\r\nMEA
      27. \r\n\r\n\r\nGCC Countries
      28. \r\n\r\n\r\nSouth Africa
      29. \r\n\r\n\r\nRest of MEA
      30. \r\n\r\n\r\n\r\n\r\n\r\n\r\n\r\n\r\nCompetitive Landscape
      31. \r\n\r\n\r\nOverview
      32. \r\n\r\n\r\nCompetitive Analysis
      33. \r\n\r\n\r\nMarket share Analysis
      34. \r\n\r\n\r\nMajor Growth Strategy in the PROCUREMENT
    5. ANALYTICS MARKET
      1. \r\n\r\n\r\nCompetitive Benchmarking
      2. \r\n\r\n\r\nLeading Players
      3. in Terms of Number of Developments in the PROCUREMENT ANALYTICS MARKET
      4. \r\n\r\n\r\nKey developments
      5. and growth strategies
      6. \r\n\r\n\r\nNew Product Launch/Service Deployment
      7. \r\n\r\n\r\nMerger & Acquisitions
      8. \r\n\r\n\r\nJoint Ventures
      9. \r\n\r\n\r\n\r\n\r\nMajor Players Financial Matrix
      10. \r\n\r\n\r\nSales and Operating Income
      11. \r\n\r\n\r\nMajor Players R&D Expenditure.
      12. \r\n\r\n\r\n\r\n\r\n\r\n\r\nCompany Profiles
      13. \r\n\r\n\r\nBasware
      14. \r\n\r\n\r\nFinancial Overview
      15. \r\n\r\n\r\nProducts Offered
      16. \r\n\r\n\r\nKey Developments
      17. \r\n\r\n\r\nSWOT Analysis
      18. \r\n\r\n\r\nKey Strategies
      19. \r\n\r\n\r\n\r\n\r\nTealbook
      20. \r\n\r\n\r\nFinancial Overview
      21. \r\n\r\n\r\nProducts Offered
      22. \r\n\r\n\r\nKey Developments
      23. \r\n\r\n\r\nSWOT Analysis
      24. \r\n\r\n\r\nKey Strategies
      25. \r\n\r\n\r\n\r\n\r\nCoupa
      26. \r\n\r\n\r\nFinancial Overview
      27. \r\n\r\n\r\nProducts Offered
      28. \r\n\r\n\r\nKey Developments
      29. \r\n\r\n\r\nSWOT Analysis
      30. \r\n\r\n\r\nKey Strategies
      31. \r\n\r\n\r\n\r\n\r\nDetermine
      32. \r\n\r\n\r\nFinancial Overview
      33. \r\n\r\n\r\nProducts Offered
      34. \r\n\r\n\r\nKey Developments
      35. \r\n\r\n\r\nSWOT Analysis
      36. \r\n\r\n\r\nKey Strategies
      37. \r\n\r\n\r\n\r\n\r\nOracle
      38. \r\n\r\n\r\nFinancial Overview
      39. \r\n\r\n\r\nProducts Offered
      40. \r\n\r\n\r\nKey Developments
      41. \r\n\r\n\r\nSWOT Analysis
      42. \r\n\r\n\r\nKey Strategies
      43. \r\n\r\n\r\n\r\n\r\nGEP
      44. \r\n\r\n\r\nFinancial Overview
      45. \r\n\r\n\r\nProducts Offered
      46. \r\n\r\n\r\nKey Developments
      47. \r\n\r\n\r\nSWOT Analysis
      48. \r\n\r\n\r\nKey Strategies
      49. \r\n\r\n\r\n\r\n\r\nIvalua
      50. \r\n\r\n\r\nFinancial Overview
      51. \r\n\r\n\r\nProducts Offered
      52. \r\n\r\n\r\nKey Developments
      53. \r\n\r\n\r\nSWOT Analysis
      54. \r\n\r\n\r\nKey Strategies
      55. \r\n\r\n\r\n\r\n\r\nIBM
      56. \r\n\r\n\r\nFinancial Overview
      57. \r\n\r\n\r\nProducts Offered
      58. \r\n\r\n\r\nKey Developments
      59. \r\n\r\n\r\nSWOT Analysis
      60. \r\n\r\n\r\nKey Strategies
      61. \r\n\r\n\r\n\r\n\r\nSpendHQ
      62. \r\n\r\n\r\nFinancial Overview
      63. \r\n\r\n\r\nProducts Offered
      64. \r\n\r\n\r\nKey Developments
      65. \r\n\r\n\r\nSWOT Analysis
      66. \r\n\r\n\r\nKey Strategies
      67. \r\n\r\n\r\n\r\n\r\nJaggaer
      68. \r\n\r\n\r\nFinancial Overview
      69. \r\n\r\n\r\nProducts Offered
      70. \r\n\r\n\r\nKey Developments
      71. \r\n\r\n\r\nSWOT Analysis
      72. \r\n\r\n\r\nKey Strategies
      73. \r\n\r\n\r\n\r\n\r\nSynerTrade
      74. \r\n\r\n\r\nFinancial Overview
      75. \r\n\r\n\r\nProducts Offered
      76. \r\n\r\n\r\nKey Developments
      77. \r\n\r\n\r\nSWOT Analysis
      78. \r\n\r\n\r\nKey Strategies
      79. \r\n\r\n\r\n\r\n\r\nZycus
      80. \r\n\r\n\r\nFinancial Overview
      81. \r\n\r\n\r\nProducts Offered
      82. \r\n\r\n\r\nKey Developments
      83. \r\n\r\n\r\nSWOT Analysis
      84. \r\n\r\n\r\nKey Strategies
      85. \r\n\r\n\r\n\r\n\r\nSAP
      86. \r\n\r\n\r\nFinancial Overview
      87. \r\n\r\n\r\nProducts Offered
      88. \r\n\r\n\r\nKey Developments
      89. \r\n\r\n\r\nSWOT Analysis
      90. \r\n\r\n\r\nKey Strategies
      91. \r\n\r\n\r\n\r\n\r\nProcurify
      92. \r\n\r\n\r\nFinancial Overview
      93. \r\n\r\n\r\nProducts Offered
      94. \r\n\r\n\r\nKey Developments
      95. \r\n\r\n\r\nSWOT Analysis
      96. \r\n\r\n\r\nKey Strategies
      97. \r\n\r\n\r\n\r\n\r\nProcurementIQ
      98. \r\n\r\n\r\nFinancial Overview
      99. \r\n\r\n\r\nProducts Offered
      100. \r\n\r\n\r\nKey Developments
      101. \r\n\r\n\r\nSWOT Analysis
      102. \r\n\r\n\r\nKey Strategies
      103. \r\n\r\n\r\n\r\n\r\n\r\n\r\nAppendix
      104. \r\n\r\n\r\nReferences
      105. \r\n\r\n\r\nRelated Reports
      106. \r\n\r\n\r\n\r\n\r\n
      107. \r\nLIST Of tables
      108. \r\n
      109. \r\n\r\n\r\nLIST OF ASSUMPTIONS
    6. \r\n\r\n\r\nNorth America Market SIZE ESTIMATES & FORECAST, BY DEPLOYMENT
      1. TYPE, 2019-2035 (USD Billions)
      2. \r\n\r\n\r\nNorth
    7. America Market SIZE ESTIMATES & FORECAST, BY APPLICATION, 2019-2035 (USD Billions)
    8. \r\n\r\n\r\nNorth America Market SIZE ESTIMATES & FORECAST, BY END USER,
      1. \r\n\r\n\r\nNorth America
    9. Market SIZE ESTIMATES & FORECAST, BY COMPONENT, 2019-2035 (USD Billions)
    10. \r\n\r\n\r\nNorth America Market SIZE ESTIMATES & FORECAST, BY REGIONAL,
      1. \r\n\r\n\r\nUS Market
      2. SIZE ESTIMATES & FORECAST, BY DEPLOYMENT TYPE, 2019-2035 (USD Billions)
    11. \r\n\r\n\r\nUS Market SIZE ESTIMATES & FORECAST, BY APPLICATION, 2019-2035
      1. (USD Billions)
      2. \r\n\r\n\r\nUS Market SIZE ESTIMATES & FORECAST, BY
      3. END USER, 2019-2035 (USD Billions)
      4. \r\n\r\n\r\nUS
    12. Market SIZE ESTIMATES & FORECAST, BY COMPONENT, 2019-2035 (USD Billions)
    13. \r\n\r\n\r\nUS Market SIZE ESTIMATES & FORECAST, BY REGIONAL, 2019-2035
      1. (USD Billions)
      2. \r\n\r\n\r\nCanada Market SIZE ESTIMATES & FORECAST,
      3. BY DEPLOYMENT TYPE, 2019-2035 (USD Billions)
      4. \r\n\r\n\r\nCanada
    14. Market SIZE ESTIMATES & FORECAST, BY APPLICATION, 2019-2035 (USD Billions)
    15. \r\n\r\n\r\nCanada Market SIZE ESTIMATES & FORECAST, BY END USER, 2019-2035
      1. (USD Billions)
      2. \r\n\r\n\r\nCanada Market SIZE ESTIMATES & FORECAST,
      3. BY COMPONENT, 2019-2035 (USD Billions)
      4. \r\n\r\n\r\nCanada
    16. Market SIZE ESTIMATES & FORECAST, BY REGIONAL, 2019-2035 (USD Billions)
    17. \r\n\r\n\r\nEurope Market SIZE ESTIMATES & FORECAST, BY DEPLOYMENT TYPE,
      1. \r\n\r\n\r\nEurope Market
      2. SIZE ESTIMATES & FORECAST, BY APPLICATION, 2019-2035 (USD Billions)
      3. \r\n\r\n\r\nEurope
    18. Market SIZE ESTIMATES & FORECAST, BY END USER, 2019-2035 (USD Billions)
    19. \r\n\r\n\r\nEurope Market SIZE ESTIMATES & FORECAST, BY COMPONENT, 2019-2035
      1. (USD Billions)
      2. \r\n\r\n\r\nEurope Market SIZE ESTIMATES & FORECAST,
      3. BY REGIONAL, 2019-2035 (USD Billions)
      4. \r\n\r\n\r\nGermany
    20. Market SIZE ESTIMATES & FORECAST, BY DEPLOYMENT TYPE, 2019-2035 (USD Billions)
    21. \r\n\r\n\r\nGermany Market SIZE ESTIMATES & FORECAST, BY APPLICATION, 2019-2035
      1. (USD Billions)
      2. \r\n\r\n\r\nGermany Market SIZE ESTIMATES & FORECAST,
      3. BY END USER, 2019-2035 (USD Billions)
      4. \r\n\r\n\r\nGermany
    22. Market SIZE ESTIMATES & FORECAST, BY COMPONENT, 2019-2035 (USD Billions)
    23. \r\n\r\n\r\nGermany Market SIZE ESTIMATES & FORECAST, BY REGIONAL, 2019-2035
      1. (USD Billions)
      2. \r\n\r\n\r\nUK Market SIZE ESTIMATES & FORECAST, BY
      3. DEPLOYMENT TYPE, 2019-2035 (USD Billions)
      4. \r\n\r\n\r\nUK
    24. Market SIZE ESTIMATES & FORECAST, BY APPLICATION, 2019-2035 (USD Billions)
    25. \r\n\r\n\r\nUK Market SIZE ESTIMATES & FORECAST, BY END USER, 2019-2035
      1. (USD Billions)
      2. \r\n\r\n\r\nUK Market SIZE ESTIMATES & FORECAST, BY
      3. COMPONENT, 2019-2035 (USD Billions)
      4. \r\n\r\n\r\nUK
    26. Market SIZE ESTIMATES & FORECAST, BY REGIONAL, 2019-2035 (USD Billions)
    27. \r\n\r\n\r\nFrance Market SIZE ESTIMATES & FORECAST, BY DEPLOYMENT TYPE,
      1. \r\n\r\n\r\nFrance Market
      2. SIZE ESTIMATES & FORECAST, BY APPLICATION, 2019-2035 (USD Billions)
      3. \r\n\r\n\r\nFrance
    28. Market SIZE ESTIMATES & FORECAST, BY END USER, 2019-2035 (USD Billions)
    29. \r\n\r\n\r\nFrance Market SIZE ESTIMATES & FORECAST, BY COMPONENT, 2019-2035
      1. (USD Billions)
      2. \r\n\r\n\r\nFrance Market SIZE ESTIMATES & FORECAST,
      3. BY REGIONAL, 2019-2035 (USD Billions)
      4. \r\n\r\n\r\nRussia
    30. Market SIZE ESTIMATES & FORECAST, BY DEPLOYMENT TYPE, 2019-2035 (USD Billions)
    31. \r\n\r\n\r\nRussia Market SIZE ESTIMATES & FORECAST, BY APPLICATION, 2019-2035
      1. (USD Billions)
      2. \r\n\r\n\r\nRussia Market SIZE ESTIMATES & FORECAST,
      3. BY END USER, 2019-2035 (USD Billions)
      4. \r\n\r\n\r\nRussia
    32. Market SIZE ESTIMATES & FORECAST, BY COMPONENT, 2019-2035 (USD Billions)
    33. \r\n\r\n\r\nRussia Market SIZE ESTIMATES & FORECAST, BY REGIONAL, 2019-2035
      1. (USD Billions)
      2. \r\n\r\n\r\nItaly Market SIZE ESTIMATES & FORECAST,
      3. BY DEPLOYMENT TYPE, 2019-2035 (USD Billions)
      4. \r\n\r\n\r\nItaly
    34. Market SIZE ESTIMATES & FORECAST, BY APPLICATION, 2019-2035 (USD Billions)
    35. \r\n\r\n\r\nItaly Market SIZE ESTIMATES & FORECAST, BY END USER, 2019-2035
      1. (USD Billions)
      2. \r\n\r\n\r\nItaly Market SIZE ESTIMATES & FORECAST,
      3. BY COMPONENT, 2019-2035 (USD Billions)
      4. \r\n\r\n\r\nItaly
    36. Market SIZE ESTIMATES & FORECAST, BY REGIONAL, 2019-2035 (USD Billions)
    37. \r\n\r\n\r\nSpain Market SIZE ESTIMATES & FORECAST, BY DEPLOYMENT TYPE,
      1. \r\n\r\n\r\nSpain Market
      2. SIZE ESTIMATES & FORECAST, BY APPLICATION, 2019-2035 (USD Billions)
      3. \r\n\r\n\r\nSpain
    38. Market SIZE ESTIMATES & FORECAST, BY END USER, 2019-2035 (USD Billions)
    39. \r\n\r\n\r\nSpain Market SIZE ESTIMATES & FORECAST, BY COMPONENT, 2019-2035
      1. (USD Billions)
      2. \r\n\r\n\r\nSpain Market SIZE ESTIMATES & FORECAST,
      3. BY REGIONAL, 2019-2035 (USD Billions)
      4. \r\n\r\n\r\nRest
    40. of Europe Market SIZE ESTIMATES & FORECAST, BY DEPLOYMENT TYPE, 2019-2035 (USD
      1. Billions)
      2. \r\n\r\n\r\nRest of Europe Market SIZE ESTIMATES &
      3. FORECAST, BY APPLICATION, 2019-2035 (USD Billions)
      4. \r\n\r\n\r\nRest
    41. of Europe Market SIZE ESTIMATES & FORECAST, BY END USER, 2019-2035 (USD Billions)
    42. \r\n\r\n\r\nRest of Europe Market SIZE ESTIMATES & FORECAST, BY COMPONENT,
      1. \r\n\r\n\r\nRest of Europe
    43. Market SIZE ESTIMATES & FORECAST, BY REGIONAL, 2019-2035 (USD Billions)
    44. \r\n\r\n\r\nAPAC Market SIZE ESTIMATES & FORECAST, BY DEPLOYMENT TYPE, 2019-2035
      1. (USD Billions)
      2. \r\n\r\n\r\nAPAC Market SIZE ESTIMATES & FORECAST,
      3. BY APPLICATION, 2019-2035 (USD Billions)
      4. \r\n\r\n\r\nAPAC
    45. Market SIZE ESTIMATES & FORECAST, BY END USER, 2019-2035 (USD Billions)
    46. \r\n\r\n\r\nAPAC Market SIZE ESTIMATES & FORECAST, BY COMPONENT, 2019-2035
      1. (USD Billions)
      2. \r\n\r\n\r\nAPAC Market SIZE ESTIMATES & FORECAST,
      3. BY REGIONAL, 2019-2035 (USD Billions)
      4. \r\n\r\n\r\nChina
    47. Market SIZE ESTIMATES & FORECAST, BY DEPLOYMENT TYPE, 2019-2035 (USD Billions)
    48. \r\n\r\n\r\nChina Market SIZE ESTIMATES & FORECAST, BY APPLICATION, 2019-2035
      1. (USD Billions)
      2. \r\n\r\n\r\nChina Market SIZE ESTIMATES & FORECAST,
      3. BY END USER, 2019-2035 (USD Billions)
      4. \r\n\r\n\r\nChina
    49. Market SIZE ESTIMATES & FORECAST, BY COMPONENT, 2019-2035 (USD Billions)
    50. \r\n\r\n\r\nChina Market SIZE ESTIMATES & FORECAST, BY REGIONAL, 2019-2035
      1. (USD Billions)
      2. \r\n\r\n\r\nIndia Market SIZE ESTIMATES & FORECAST,
      3. BY DEPLOYMENT TYPE, 2019-2035 (USD Billions)
      4. \r\n\r\n\r\nIndia
    51. Market SIZE ESTIMATES & FORECAST, BY APPLICATION, 2019-2035 (USD Billions)
    52. \r\n\r\n\r\nIndia Market SIZE ESTIMATES & FORECAST, BY END USER, 2019-2035
      1. (USD Billions)
      2. \r\n\r\n\r\nIndia Market SIZE ESTIMATES & FORECAST,
      3. BY COMPONENT, 2019-2035 (USD Billions)
      4. \r\n\r\n\r\nIndia
    53. Market SIZE ESTIMATES & FORECAST, BY REGIONAL, 2019-2035 (USD Billions)
    54. \r\n\r\n\r\nJapan Market SIZE ESTIMATES & FORECAST, BY DEPLOYMENT TYPE,
      1. \r\n\r\n\r\nJapan Market
      2. SIZE ESTIMATES & FORECAST, BY APPLICATION, 2019-2035 (USD Billions)
      3. \r\n\r\n\r\nJapan
    55. Market SIZE ESTIMATES & FORECAST, BY END USER, 2019-2035 (USD Billions)
    56. \r\n\r\n\r\nJapan Market SIZE ESTIMATES & FORECAST, BY COMPONENT, 2019-2035
      1. (USD Billions)
      2. \r\n\r\n\r\nJapan Market SIZE ESTIMATES & FORECAST,
      3. BY REGIONAL, 2019-2035 (USD Billions)
      4. \r\n\r\n\r\nSouth
    57. Korea Market SIZE ESTIMATES & FORECAST, BY DEPLOYMENT TYPE, 2019-2035 (USD Billions)
    58. \r\n\r\n\r\nSouth Korea Market SIZE ESTIMATES & FORECAST, BY APPLICATION,
      1. \r\n\r\n\r\nSouth Korea
    59. Market SIZE ESTIMATES & FORECAST, BY END USER, 2019-2035 (USD Billions)
    60. \r\n\r\n\r\nSouth Korea Market SIZE ESTIMATES & FORECAST, BY COMPONENT,
      1. \r\n\r\n\r\nSouth Korea
    61. Market SIZE ESTIMATES & FORECAST, BY REGIONAL, 2019-2035 (USD Billions)
    62. \r\n\r\n\r\nMalaysia Market SIZE ESTIMATES & FORECAST, BY DEPLOYMENT TYPE,
      1. \r\n\r\n\r\nMalaysia
    63. Market SIZE ESTIMATES & FORECAST, BY APPLICATION, 2019-2035 (USD Billions)
    64. \r\n\r\n\r\nMalaysia Market SIZE ESTIMATES & FORECAST, BY END USER, 2019-2035
      1. (USD Billions)
      2. \r\n\r\n\r\nMalaysia Market SIZE ESTIMATES & FORECAST,
      3. BY COMPONENT, 2019-2035 (USD Billions)
      4. \r\n\r\n\r\nMalaysia
    65. Market SIZE ESTIMATES & FORECAST, BY REGIONAL, 2019-2035 (USD Billions)
    66. \r\n\r\n\r\nThailand Market SIZE ESTIMATES & FORECAST, BY DEPLOYMENT TYPE,
      1. \r\n\r\n\r\nThailand
    67. Market SIZE ESTIMATES & FORECAST, BY APPLICATION, 2019-2035 (USD Billions)
    68. \r\n\r\n\r\nThailand Market SIZE ESTIMATES & FORECAST, BY END USER, 2019-2035
      1. (USD Billions)
      2. \r\n\r\n\r\nThailand Market SIZE ESTIMATES & FORECAST,
      3. BY COMPONENT, 2019-2035 (USD Billions)
      4. \r\n\r\n\r\nThailand
    69. Market SIZE ESTIMATES & FORECAST, BY REGIONAL, 2019-2035 (USD Billions)
    70. \r\n\r\n\r\nIndonesia Market SIZE ESTIMATES & FORECAST, BY DEPLOYMENT TYPE,
      1. \r\n\r\n\r\nIndonesia
    71. Market SIZE ESTIMATES & FORECAST, BY APPLICATION, 2019-2035 (USD Billions)
    72. \r\n\r\n\r\nIndonesia Market SIZE ESTIMATES & FORECAST, BY END USER, 2019-2035
      1. (USD Billions)
      2. \r\n\r\n\r\nIndonesia Market SIZE ESTIMATES & FORECAST,
      3. BY COMPONENT, 2019-2035 (USD Billions)
      4. \r\n\r\n\r\nIndonesia
    73. Market SIZE ESTIMATES & FORECAST, BY REGIONAL, 2019-2035 (USD Billions)
    74. \r\n\r\n\r\nRest of APAC Market SIZE ESTIMATES & FORECAST, BY DEPLOYMENT
      1. TYPE, 2019-2035 (USD Billions)
      2. \r\n\r\n\r\nRest
    75. of APAC Market SIZE ESTIMATES & FORECAST, BY APPLICATION, 2019-2035 (USD Billions)
    76. \r\n\r\n\r\nRest of APAC Market SIZE ESTIMATES & FORECAST, BY END USER,
      1. \r\n\r\n\r\nRest of APAC
    77. Market SIZE ESTIMATES & FORECAST, BY COMPONENT, 2019-2035 (USD Billions)
    78. \r\n\r\n\r\nRest of APAC Market SIZE ESTIMATES & FORECAST, BY REGIONAL,
      1. \r\n\r\n\r\nSouth America
    79. Market SIZE ESTIMATES & FORECAST, BY DEPLOYMENT TYPE, 2019-2035 (USD Billions)
    80. \r\n\r\n\r\nSouth America Market SIZE ESTIMATES & FORECAST, BY APPLICATION,
      1. \r\n\r\n\r\nSouth America
    81. Market SIZE ESTIMATES & FORECAST, BY END USER, 2019-2035 (USD Billions)
    82. \r\n\r\n\r\nSouth America Market SIZE ESTIMATES & FORECAST, BY COMPONENT,
      1. \r\n\r\n\r\nSouth America
    83. Market SIZE ESTIMATES & FORECAST, BY REGIONAL, 2019-2035 (USD Billions)
    84. \r\n\r\n\r\nBrazil Market SIZE ESTIMATES & FORECAST, BY DEPLOYMENT TYPE,
      1. \r\n\r\n\r\nBrazil Market
      2. SIZE ESTIMATES & FORECAST, BY APPLICATION, 2019-2035 (USD Billions)
      3. \r\n\r\n\r\nBrazil
    85. Market SIZE ESTIMATES & FORECAST, BY END USER, 2019-2035 (USD Billions)
    86. \r\n\r\n\r\nBrazil Market SIZE ESTIMATES & FORECAST, BY COMPONENT, 2019-2035
      1. (USD Billions)
      2. \r\n\r\n\r\nBrazil Market SIZE ESTIMATES & FORECAST,
      3. BY REGIONAL, 2019-2035 (USD Billions)
      4. \r\n\r\n\r\nMexico
    87. Market SIZE ESTIMATES & FORECAST, BY DEPLOYMENT TYPE, 2019-2035 (USD Billions)
    88. \r\n\r\n\r\nMexico Market SIZE ESTIMATES & FORECAST, BY APPLICATION, 2019-2035
      1. (USD Billions)
      2. \r\n\r\n\r\nMexico Market SIZE ESTIMATES & FORECAST,
      3. BY END USER, 2019-2035 (USD Billions)
      4. \r\n\r\n\r\nMexico
    89. Market SIZE ESTIMATES & FORECAST, BY COMPONENT, 2019-2035 (USD Billions)
    90. \r\n\r\n\r\nMexico Market SIZE ESTIMATES & FORECAST, BY REGIONAL, 2019-2035
      1. (USD Billions)
      2. \r\n\r\n\r\nArgentina Market SIZE ESTIMATES & FORECAST,
      3. BY DEPLOYMENT TYPE, 2019-2035 (USD Billions)
      4. \r\n\r\n\r\nArgentina
    91. Market SIZE ESTIMATES & FORECAST, BY APPLICATION, 2019-2035 (USD Billions)
    92. \r\n\r\n\r\nArgentina Market SIZE ESTIMATES & FORECAST, BY END USER, 2019-2035
      1. (USD Billions)
      2. \r\n\r\n\r\nArgentina Market SIZE ESTIMATES & FORECAST,
      3. BY COMPONENT, 2019-2035 (USD Billions)
      4. \r\n\r\n\r\nArgentina
    93. Market SIZE ESTIMATES & FORECAST, BY REGIONAL, 2019-2035 (USD Billions)
    94. \r\n\r\n\r\nRest of South America Market SIZE ESTIMATES & FORECAST, BY DEPLOYMENT
      1. TYPE, 2019-2035 (USD Billions)
      2. \r\n\r\n\r\nRest
    95. of South America Market SIZE ESTIMATES & FORECAST, BY APPLICATION, 2019-2035
      1. (USD Billions)
      2. \r\n\r\n\r\nRest of South America Market SIZE ESTIMATES
      3. & FORECAST, BY END USER, 2019-2035 (USD Billions)
      4. \r\n\r\n\r\nRest
    96. of South America Market SIZE ESTIMATES & FORECAST, BY COMPONENT, 2019-2035 (USD
      1. Billions)
      2. \r\n\r\n\r\nRest of South America Market SIZE ESTIMATES
      3. & FORECAST, BY REGIONAL, 2019-2035 (USD Billions)
      4. \r\n\r\n\r\nMEA
    97. Market SIZE ESTIMATES & FORECAST, BY DEPLOYMENT TYPE, 2019-2035 (USD Billions)
    98. \r\n\r\n\r\nMEA Market SIZE ESTIMATES & FORECAST, BY APPLICATION, 2019-2035
      1. (USD Billions)
      2. \r\n\r\n\r\nMEA Market SIZE ESTIMATES & FORECAST, BY
      3. END USER, 2019-2035 (USD Billions)
      4. \r\n\r\n\r\nMEA
    99. Market SIZE ESTIMATES & FORECAST, BY COMPONENT, 2019-2035 (USD Billions)
    100. \r\n\r\n\r\nMEA Market SIZE ESTIMATES & FORECAST, BY REGIONAL, 2019-2035
      1. (USD Billions)
      2. \r\n\r\n\r\nGCC Countries Market SIZE ESTIMATES & FORECAST,
      3. BY DEPLOYMENT TYPE, 2019-2035 (USD Billions)
      4. \r\n\r\n\r\nGCC
    101. Countries Market SIZE ESTIMATES & FORECAST, BY APPLICATION, 2019-2035 (USD Billions)
    102. \r\n\r\n\r\nGCC Countries Market SIZE ESTIMATES & FORECAST, BY END USER,
      1. \r\n\r\n\r\nGCC Countries
    103. Market SIZE ESTIMATES & FORECAST, BY COMPONENT, 2019-2035 (USD Billions)
    104. \r\n\r\n\r\nGCC Countries Market SIZE ESTIMATES & FORECAST, BY REGIONAL,
      1. \r\n\r\n\r\nSouth Africa
    105. Market SIZE ESTIMATES & FORECAST, BY DEPLOYMENT TYPE, 2019-2035 (USD Billions)
    106. \r\n\r\n\r\nSouth Africa Market SIZE ESTIMATES & FORECAST, BY APPLICATION,
      1. \r\n\r\n\r\nSouth Africa
    107. Market SIZE ESTIMATES & FORECAST, BY END USER, 2019-2035 (USD Billions)
    108. \r\n\r\n\r\nSouth Africa Market SIZE ESTIMATES & FORECAST, BY COMPONENT,
      1. \r\n\r\n\r\nSouth Africa
    109. Market SIZE ESTIMATES & FORECAST, BY REGIONAL, 2019-2035 (USD Billions)
    110. \r\n\r\n\r\nRest of MEA Market SIZE ESTIMATES & FORECAST, BY DEPLOYMENT
      1. TYPE, 2019-2035 (USD Billions)
      2. \r\n\r\n\r\nRest
    111. of MEA Market SIZE ESTIMATES & FORECAST, BY APPLICATION, 2019-2035 (USD Billions)
    112. \r\n\r\n\r\nRest of MEA Market SIZE ESTIMATES & FORECAST, BY END USER, 2019-2035
      1. (USD Billions)
      2. \r\n\r\n\r\nRest of MEA Market SIZE ESTIMATES & FORECAST,
      3. BY COMPONENT, 2019-2035 (USD Billions)
      4. \r\n\r\n\r\nRest
    113. of MEA Market SIZE ESTIMATES & FORECAST, BY REGIONAL, 2019-2035 (USD Billions)
      1. \r\n\r\n\r\nPRODUCT LAUNCH/PRODUCT DEVELOPMENT/APPROVAL
      2. \r\n\r\n\r\nACQUISITION/PARTNERSHIP
      3. \r\n\r\n\r\n
      4. \r\nLIST Of figures
      5. \r\n
      6. \r\n\r\n\r\nMARKET SYNOPSIS
      7. \r\n\r\n\r\nNORTH AMERICA MARKET ANALYSIS
      8. \r\n\r\n\r\nUS MARKET ANALYSIS BY DEPLOYMENT TYPE
      9. \r\n\r\n\r\nUS MARKET ANALYSIS
      10. BY APPLICATION
      11. \r\n\r\n\r\nUS
      12. MARKET ANALYSIS BY END USER
      13. \r\n\r\n\r\nUS MARKET ANALYSIS BY COMPONENT
      14. \r\n\r\n\r\nUS MARKET ANALYSIS BY REGIONAL
      15. \r\n\r\n\r\nCANADA MARKET ANALYSIS BY DEPLOYMENT
      16. TYPE
      17. \r\n\r\n\r\nCANADA
      18. MARKET ANALYSIS BY APPLICATION
      19. \r\n\r\n\r\nCANADA MARKET ANALYSIS BY END USER
      20. \r\n\r\n\r\nCANADA MARKET ANALYSIS BY COMPONENT
      21. \r\n\r\n\r\nCANADA MARKET ANALYSIS BY REGIONAL
      22. \r\n\r\n\r\nEUROPE MARKET ANALYSIS
      23. \r\n\r\n\r\nGERMANY MARKET ANALYSIS BY DEPLOYMENT
      24. TYPE
      25. \r\n\r\n\r\nGERMANY
      26. MARKET ANALYSIS BY APPLICATION
      27. \r\n\r\n\r\nGERMANY MARKET ANALYSIS BY END USER
      28. \r\n\r\n\r\nGERMANY MARKET ANALYSIS BY COMPONENT
      29. \r\n\r\n\r\nGERMANY MARKET
      30. ANALYSIS BY REGIONAL
      31. \r\n\r\n\r\nUK
      32. MARKET ANALYSIS BY DEPLOYMENT TYPE
      33. \r\n\r\n\r\nUK MARKET ANALYSIS BY APPLICATION
      34. \r\n\r\n\r\nUK MARKET ANALYSIS BY END USER
      35. \r\n\r\n\r\nUK MARKET ANALYSIS BY COMPONENT
      36. \r\n\r\n\r\nUK MARKET ANALYSIS BY REGIONAL
      37. \r\n\r\n\r\nFRANCE MARKET ANALYSIS BY DEPLOYMENT
      38. TYPE
      39. \r\n\r\n\r\nFRANCE
      40. MARKET ANALYSIS BY APPLICATION
      41. \r\n\r\n\r\nFRANCE MARKET ANALYSIS BY END USER
      42. \r\n\r\n\r\nFRANCE MARKET ANALYSIS BY COMPONENT
      43. \r\n\r\n\r\nFRANCE MARKET ANALYSIS BY REGIONAL
      44. \r\n\r\n\r\nRUSSIA MARKET ANALYSIS BY DEPLOYMENT
      45. TYPE
      46. \r\n\r\n\r\nRUSSIA
      47. MARKET ANALYSIS BY APPLICATION
      48. \r\n\r\n\r\nRUSSIA MARKET ANALYSIS BY END USER
      49. \r\n\r\n\r\nRUSSIA MARKET ANALYSIS BY COMPONENT
      50. \r\n\r\n\r\nRUSSIA MARKET ANALYSIS BY REGIONAL
      51. \r\n\r\n\r\nITALY MARKET ANALYSIS BY DEPLOYMENT TYPE
      52. \r\n\r\n\r\nITALY MARKET
      53. ANALYSIS BY APPLICATION
      54. \r\n\r\n\r\nITALY MARKET ANALYSIS BY END USER
      55. \r\n\r\n\r\nITALY MARKET ANALYSIS BY COMPONENT
      56. \r\n\r\n\r\nITALY MARKET ANALYSIS BY REGIONAL
      57. \r\n\r\n\r\nSPAIN MARKET ANALYSIS BY DEPLOYMENT TYPE
      58. \r\n\r\n\r\nSPAIN MARKET
      59. ANALYSIS BY APPLICATION
      60. \r\n\r\n\r\nSPAIN MARKET ANALYSIS BY END USER
      61. \r\n\r\n\r\nSPAIN MARKET ANALYSIS BY COMPONENT
      62. \r\n\r\n\r\nSPAIN MARKET ANALYSIS BY REGIONAL
      63. \r\n\r\n\r\nREST OF EUROPE MARKET ANALYSIS BY DEPLOYMENT
      64. TYPE
      65. \r\n\r\n\r\nREST
      66. OF EUROPE MARKET ANALYSIS BY APPLICATION
      67. \r\n\r\n\r\nREST OF EUROPE MARKET ANALYSIS BY END
      68. USER
      69. \r\n\r\n\r\nREST
      70. OF EUROPE MARKET ANALYSIS BY COMPONENT
      71. \r\n\r\n\r\nREST OF EUROPE MARKET ANALYSIS BY REGIONAL
      72. \r\n\r\n\r\nAPAC MARKET ANALYSIS
      73. \r\n\r\n\r\nCHINA MARKET
      74. ANALYSIS BY DEPLOYMENT TYPE
      75. \r\n\r\n\r\nCHINA MARKET ANALYSIS BY APPLICATION
      76. \r\n\r\n\r\nCHINA MARKET ANALYSIS BY END USER
      77. \r\n\r\n\r\nCHINA MARKET ANALYSIS BY COMPONENT
      78. \r\n\r\n\r\nCHINA MARKET ANALYSIS BY REGIONAL
      79. \r\n\r\n\r\nINDIA MARKET ANALYSIS BY DEPLOYMENT TYPE
      80. \r\n\r\n\r\nINDIA MARKET
      81. ANALYSIS BY APPLICATION
      82. \r\n\r\n\r\nINDIA MARKET ANALYSIS BY END USER
      83. \r\n\r\n\r\nINDIA MARKET ANALYSIS BY COMPONENT
      84. \r\n\r\n\r\nINDIA MARKET ANALYSIS BY REGIONAL
      85. \r\n\r\n\r\nJAPAN MARKET ANALYSIS BY DEPLOYMENT TYPE
      86. \r\n\r\n\r\nJAPAN MARKET
      87. ANALYSIS BY APPLICATION
      88. \r\n\r\n\r\nJAPAN MARKET ANALYSIS BY END USER
      89. \r\n\r\n\r\nJAPAN MARKET ANALYSIS BY COMPONENT
      90. \r\n\r\n\r\nJAPAN MARKET ANALYSIS BY REGIONAL
      91. \r\n\r\n\r\nSOUTH KOREA MARKET ANALYSIS BY DEPLOYMENT
      92. TYPE
      93. \r\n\r\n\r\nSOUTH
      94. KOREA MARKET ANALYSIS BY APPLICATION
      95. \r\n\r\n\r\nSOUTH KOREA MARKET ANALYSIS BY END USER
      96. \r\n\r\n\r\nSOUTH KOREA MARKET ANALYSIS BY COMPONENT
      97. \r\n\r\n\r\nSOUTH KOREA MARKET
      98. ANALYSIS BY REGIONAL
      99. \r\n\r\n\r\nMALAYSIA
      100. MARKET ANALYSIS BY DEPLOYMENT TYPE
      101. \r\n\r\n\r\nMALAYSIA MARKET ANALYSIS BY APPLICATION
      102. \r\n\r\n\r\nMALAYSIA MARKET ANALYSIS BY END USER
      103. \r\n\r\n\r\nMALAYSIA MARKET
      104. ANALYSIS BY COMPONENT
      105. \r\n\r\n\r\nMALAYSIA
      106. MARKET ANALYSIS BY REGIONAL
      107. \r\n\r\n\r\nTHAILAND MARKET ANALYSIS BY DEPLOYMENT TYPE
      108. \r\n\r\n\r\nTHAILAND MARKET ANALYSIS BY APPLICATION
      109. \r\n\r\n\r\nTHAILAND MARKET
      110. ANALYSIS BY END USER
      111. \r\n\r\n\r\nTHAILAND
      112. MARKET ANALYSIS BY COMPONENT
      113. \r\n\r\n\r\nTHAILAND MARKET ANALYSIS BY REGIONAL
      114. \r\n\r\n\r\nINDONESIA MARKET ANALYSIS BY DEPLOYMENT
      115. TYPE
      116. \r\n\r\n\r\nINDONESIA
      117. MARKET ANALYSIS BY APPLICATION
      118. \r\n\r\n\r\nINDONESIA MARKET ANALYSIS BY END USER
      119. \r\n\r\n\r\nINDONESIA MARKET ANALYSIS BY COMPONENT
      120. \r\n\r\n\r\nINDONESIA MARKET
      121. ANALYSIS BY REGIONAL
      122. \r\n\r\n\r\nREST
      123. OF APAC MARKET ANALYSIS BY DEPLOYMENT TYPE
      124. \r\n\r\n\r\nREST OF APAC MARKET ANALYSIS BY APPLICATION
      125. \r\n\r\n\r\nREST OF APAC
      126. MARKET ANALYSIS BY END USER
      127. \r\n\r\n\r\nREST OF APAC MARKET ANALYSIS BY COMPONENT
      128. \r\n\r\n\r\nREST OF APAC MARKET ANALYSIS BY REGIONAL
      129. \r\n\r\n\r\nSOUTH AMERICA
    114. MARKET ANALYSIS
      1. \r\n\r\n\r\nBRAZIL
      2. MARKET ANALYSIS BY DEPLOYMENT TYPE
      3. \r\n\r\n\r\nBRAZIL MARKET ANALYSIS BY APPLICATION
      4. \r\n\r\n\r\nBRAZIL MARKET ANALYSIS BY END USER
      5. \r\n\r\n\r\nBRAZIL MARKET ANALYSIS BY COMPONENT
      6. \r\n\r\n\r\nBRAZIL MARKET ANALYSIS BY REGIONAL
      7. \r\n\r\n\r\nMEXICO MARKET ANALYSIS BY DEPLOYMENT
      8. TYPE
      9. \r\n\r\n\r\nMEXICO
      10. MARKET ANALYSIS BY APPLICATION
      11. \r\n\r\n\r\nMEXICO MARKET ANALYSIS BY END USER
      12. \r\n\r\n\r\nMEXICO MARKET ANALYSIS BY COMPONENT
      13. \r\n\r\n\r\nMEXICO MARKET ANALYSIS BY REGIONAL
      14. \r\n\r\n\r\nARGENTINA MARKET ANALYSIS BY DEPLOYMENT
      15. TYPE
      16. \r\n\r\n\r\nARGENTINA
      17. MARKET ANALYSIS BY APPLICATION
      18. \r\n\r\n\r\nARGENTINA MARKET ANALYSIS BY END USER
      19. \r\n\r\n\r\nARGENTINA MARKET ANALYSIS BY COMPONENT
      20. \r\n\r\n\r\nARGENTINA MARKET
      21. ANALYSIS BY REGIONAL
      22. \r\n\r\n\r\nREST
      23. OF SOUTH AMERICA MARKET ANALYSIS BY DEPLOYMENT TYPE
      24. \r\n\r\n\r\nREST OF SOUTH AMERICA MARKET ANALYSIS
      25. BY APPLICATION
      26. \r\n\r\n\r\nREST
      27. OF SOUTH AMERICA MARKET ANALYSIS BY END USER
      28. \r\n\r\n\r\nREST OF SOUTH AMERICA MARKET ANALYSIS
      29. BY COMPONENT
      30. \r\n\r\n\r\nREST
      31. OF SOUTH AMERICA MARKET ANALYSIS BY REGIONAL
      32. \r\n\r\n\r\nMEA MARKET ANALYSIS
      33. \r\n\r\n\r\nGCC COUNTRIES MARKET ANALYSIS BY DEPLOYMENT
      34. TYPE
      35. \r\n\r\n\r\nGCC
      36. COUNTRIES MARKET ANALYSIS BY APPLICATION
      37. \r\n\r\n\r\nGCC COUNTRIES MARKET ANALYSIS BY END
      38. USER
      39. \r\n\r\n\r\nGCC
      40. COUNTRIES MARKET ANALYSIS BY COMPONENT
      41. \r\n\r\n\r\nGCC COUNTRIES MARKET ANALYSIS BY REGIONAL
      42. \r\n\r\n\r\nSOUTH AFRICA
      43. MARKET ANALYSIS BY DEPLOYMENT TYPE
      44. \r\n\r\n\r\nSOUTH AFRICA MARKET ANALYSIS BY APPLICATION
      45. \r\n\r\n\r\nSOUTH AFRICA MARKET ANALYSIS BY END USER
      46. \r\n\r\n\r\nSOUTH AFRICA
      47. MARKET ANALYSIS BY COMPONENT
      48. \r\n\r\n\r\nSOUTH AFRICA MARKET ANALYSIS BY REGIONAL
      49. \r\n\r\n\r\nREST OF MEA MARKET ANALYSIS BY DEPLOYMENT
      50. TYPE
      51. \r\n\r\n\r\nREST
      52. OF MEA MARKET ANALYSIS BY APPLICATION
      53. \r\n\r\n\r\nREST OF MEA MARKET ANALYSIS BY END USER
      54. \r\n\r\n\r\nREST OF MEA MARKET
      55. ANALYSIS BY COMPONENT
      56. \r\n\r\n\r\nREST
      57. OF MEA MARKET ANALYSIS BY REGIONAL
      58. \r\n\r\n\r\nKEY BUYING CRITERIA OF PROCUREMENT ANALYTICS MARKET
      59. \r\n\r\n\r\nRESEARCH PROCESS
      60. OF MRFR
      61. \r\n\r\n\r\nDRO
    115. ANALYSIS OF PROCUREMENT ANALYTICS MARKET
      1. \r\n\r\n\r\nDRIVERS IMPACT ANALYSIS: PROCUREMENT
    116. ANALYTICS MARKET
      1. \r\n\r\n\r\nRESTRAINTS
      2. IMPACT ANALYSIS: PROCUREMENT ANALYTICS MARKET
      3. \r\n\r\n\r\nSUPPLY / VALUE CHAIN: PROCUREMENT ANALYTICS
      4. MARKET
      5. \r\n\r\n\r\nPROCUREMENT
    117. ANALYTICS MARKET, BY DEPLOYMENT TYPE, 2025 (% SHARE)
    118. \r\n\r\n\r\nPROCUREMENT ANALYTICS MARKET, BY DEPLOYMENT
      1. TYPE, 2019 TO 2035 (USD Billions)
    119. \r\n\r\n\r\nPROCUREMENT ANALYTICS MARKET, BY APPLICATION, 2025 (%
      1. SHARE)
      2. \r\n\r\n\r\nPROCUREMENT
    120. ANALYTICS MARKET, BY APPLICATION, 2019 TO 2035 (USD Billions)
    121. \r\n\r\n\r\nPROCUREMENT ANALYTICS MARKET, BY END
      1. USER, 2025 (% SHARE)
      2. \r\n\r\n\r\nPROCUREMENT
    122. ANALYTICS MARKET, BY END USER, 2019 TO 2035 (USD Billions)
    123. \r\n\r\n\r\nPROCUREMENT ANALYTICS MARKET, BY COMPONENT,
      1. \r\n\r\n\r\nPROCUREMENT
    124. ANALYTICS MARKET, BY COMPONENT, 2019 TO 2035 (USD Billions)
    125. \r\n\r\n\r\nPROCUREMENT ANALYTICS MARKET, BY REGIONAL,
      1. \r\n\r\n\r\nPROCUREMENT
    126. ANALYTICS MARKET, BY REGIONAL, 2019 TO 2035 (USD Billions)
      1. \r\n\r\n\r\nBENCHMARKING OF MAJOR COMPETITORS
      2. \r\n\r\n

    Procurement Analytics Market Segmentation

    • Procurement Analytics Market By Deployment Type (USD Billion, 2019-2035)
      • Cloud
      • On-premises
      • Hybrid


    • Procurement Analytics Market By Application (USD Billion, 2019-2035)
      • Spend Analysis
      • Supplier Performance Analysis
      • Contract Management
      • Risk Management


    • Procurement Analytics Market By End User (USD Billion, 2019-2035)
      • Retail
      • Manufacturing
      • Healthcare
      • IT
      • Telecommunications


    • Procurement Analytics Market By Component (USD Billion, 2019-2035)
      • Software
      • Services


    • Procurement Analytics Market By Regional (USD Billion, 2019-2035)
      • North America
      • Europe
      • South America
      • Asia Pacific
      • Middle East and Africa


    Procurement Analytics Market Regional Outlook (USD Billion, 2019-2035)


    • North America Outlook (USD Billion, 2019-2035)
      • North America Market by Deployment Type
        • Cloud
        • On-premises
        • Hybrid
      • North America Market by Application Type
        • Spend Analysis
        • Supplier Performance Analysis
        • Contract Management
        • Risk Management
      • North America Market by End User Type
        • Retail
        • Manufacturing
        • Healthcare
        • IT
        • Telecommunications
      • North America Market by Component Type
        • Software
        • Services
      • North America Market by Regional Type
        • US
        • Canada
      • US Outlook (USD Billion, 2019-2035)
      • US Market by Deployment Type
        • Cloud
        • On-premises
        • Hybrid
      • US Market by Application Type
        • Spend Analysis
        • Supplier Performance Analysis
        • Contract Management
        • Risk Management
      • US Market by End User Type
        • Retail
        • Manufacturing
        • Healthcare
        • IT
        • Telecommunications
      • US Market by Component Type
        • Software
        • Services
      • CANADA Outlook (USD Billion, 2019-2035)
      • CANADA Market by Deployment Type
        • Cloud
        • On-premises
        • Hybrid
      • CANADA Market by Application Type
        • Spend Analysis
        • Supplier Performance Analysis
        • Contract Management
        • Risk Management
      • CANADA Market by End User Type
        • Retail
        • Manufacturing
        • Healthcare
        • IT
        • Telecommunications
      • CANADA Market by Component Type
        • Software
        • Services
      • Europe Outlook (USD Billion, 2019-2035)
        • Europe Market by Deployment Type
          • Cloud
          • On-premises
          • Hybrid
        • Europe Market by Application Type
          • Spend Analysis
          • Supplier Performance Analysis
          • Contract Management
          • Risk Management
        • Europe Market by End User Type
          • Retail
          • Manufacturing
          • Healthcare
          • IT
          • Telecommunications
        • Europe Market by Component Type
          • Software
          • Services
        • Europe Market by Regional Type
          • Germany
          • UK
          • France
          • Russia
          • Italy
          • Spain
          • Rest of Europe
        • GERMANY Outlook (USD Billion, 2019-2035)
        • GERMANY Market by Deployment Type
          • Cloud
          • On-premises
          • Hybrid
        • GERMANY Market by Application Type
          • Spend Analysis
          • Supplier Performance Analysis
          • Contract Management
          • Risk Management
        • GERMANY Market by End User Type
          • Retail
          • Manufacturing
          • Healthcare
          • IT
          • Telecommunications
        • GERMANY Market by Component Type
          • Software
          • Services
        • UK Outlook (USD Billion, 2019-2035)
        • UK Market by Deployment Type
          • Cloud
          • On-premises
          • Hybrid
        • UK Market by Application Type
          • Spend Analysis
          • Supplier Performance Analysis
          • Contract Management
          • Risk Management
        • UK Market by End User Type
          • Retail
          • Manufacturing
          • Healthcare
          • IT
          • Telecommunications
        • UK Market by Component Type
          • Software
          • Services
        • FRANCE Outlook (USD Billion, 2019-2035)
        • FRANCE Market by Deployment Type
          • Cloud
          • On-premises
          • Hybrid
        • FRANCE Market by Application Type
          • Spend Analysis
          • Supplier Performance Analysis
          • Contract Management
          • Risk Management
        • FRANCE Market by End User Type
          • Retail
          • Manufacturing
          • Healthcare
          • IT
          • Telecommunications
        • FRANCE Market by Component Type
          • Software
          • Services
        • RUSSIA Outlook (USD Billion, 2019-2035)
        • RUSSIA Market by Deployment Type
          • Cloud
          • On-premises
          • Hybrid
        • RUSSIA Market by Application Type
          • Spend Analysis
          • Supplier Performance Analysis
          • Contract Management
          • Risk Management
        • RUSSIA Market by End User Type
          • Retail
          • Manufacturing
          • Healthcare
          • IT
          • Telecommunications
        • RUSSIA Market by Component Type
          • Software
          • Services
        • ITALY Outlook (USD Billion, 2019-2035)
        • ITALY Market by Deployment Type
          • Cloud
          • On-premises
          • Hybrid
        • ITALY Market by Application Type
          • Spend Analysis
          • Supplier Performance Analysis
          • Contract Management
          • Risk Management
        • ITALY Market by End User Type
          • Retail
          • Manufacturing
          • Healthcare
          • IT
          • Telecommunications
        • ITALY Market by Component Type
          • Software
          • Services
        • SPAIN Outlook (USD Billion, 2019-2035)
        • SPAIN Market by Deployment Type
          • Cloud
          • On-premises
          • Hybrid
        • SPAIN Market by Application Type
          • Spend Analysis
          • Supplier Performance Analysis
          • Contract Management
          • Risk Management
        • SPAIN Market by End User Type
          • Retail
          • Manufacturing
          • Healthcare
          • IT
          • Telecommunications
        • SPAIN Market by Component Type
          • Software
          • Services
        • REST OF EUROPE Outlook (USD Billion, 2019-2035)
        • REST OF EUROPE Market by Deployment Type
          • Cloud
          • On-premises
          • Hybrid
        • REST OF EUROPE Market by Application Type
          • Spend Analysis
          • Supplier Performance Analysis
          • Contract Management
          • Risk Management
        • REST OF EUROPE Market by End User Type
          • Retail
          • Manufacturing
          • Healthcare
          • IT
          • Telecommunications
        • REST OF EUROPE Market by Component Type
          • Software
          • Services
        • APAC Outlook (USD Billion, 2019-2035)
          • APAC Market by Deployment Type
            • Cloud
            • On-premises
            • Hybrid
          • APAC Market by Application Type
            • Spend Analysis
            • Supplier Performance Analysis
            • Contract Management
            • Risk Management
          • APAC Market by End User Type
            • Retail
            • Manufacturing
            • Healthcare
            • IT
            • Telecommunications
          • APAC Market by Component Type
            • Software
            • Services
          • APAC Market by Regional Type
            • China
            • India
            • Japan
            • South Korea
            • Malaysia
            • Thailand
            • Indonesia
            • Rest of APAC
          • CHINA Outlook (USD Billion, 2019-2035)
          • CHINA Market by Deployment Type
            • Cloud
            • On-premises
            • Hybrid
          • CHINA Market by Application Type
            • Spend Analysis
            • Supplier Performance Analysis
            • Contract Management
            • Risk Management
          • CHINA Market by End User Type
            • Retail
            • Manufacturing
            • Healthcare
            • IT
            • Telecommunications
          • CHINA Market by Component Type
            • Software
            • Services
          • INDIA Outlook (USD Billion, 2019-2035)
          • INDIA Market by Deployment Type
            • Cloud
            • On-premises
            • Hybrid
          • INDIA Market by Application Type
            • Spend Analysis
            • Supplier Performance Analysis
            • Contract Management
            • Risk Management
          • INDIA Market by End User Type
            • Retail
            • Manufacturing
            • Healthcare
            • IT
            • Telecommunications
          • INDIA Market by Component Type
            • Software
            • Services
          • JAPAN Outlook (USD Billion, 2019-2035)
          • JAPAN Market by Deployment Type
            • Cloud
            • On-premises
            • Hybrid
          • JAPAN Market by Application Type
            • Spend Analysis
            • Supplier Performance Analysis
            • Contract Management
            • Risk Management
          • JAPAN Market by End User Type
            • Retail
            • Manufacturing
            • Healthcare
            • IT
            • Telecommunications
          • JAPAN Market by Component Type
            • Software
            • Services
          • SOUTH KOREA Outlook (USD Billion, 2019-2035)
          • SOUTH KOREA Market by Deployment Type
            • Cloud
            • On-premises
            • Hybrid
          • SOUTH KOREA Market by Application Type
            • Spend Analysis
            • Supplier Performance Analysis
            • Contract Management
            • Risk Management
          • SOUTH KOREA Market by End User Type
            • Retail
            • Manufacturing
            • Healthcare
            • IT
            • Telecommunications
          • SOUTH KOREA Market by Component Type
            • Software
            • Services
          • MALAYSIA Outlook (USD Billion, 2019-2035)
          • MALAYSIA Market by Deployment Type
            • Cloud
            • On-premises
            • Hybrid
          • MALAYSIA Market by Application Type
            • Spend Analysis
            • Supplier Performance Analysis
            • Contract Management
            • Risk Management
          • MALAYSIA Market by End User Type
            • Retail
            • Manufacturing
            • Healthcare
            • IT
            • Telecommunications
          • MALAYSIA Market by Component Type
            • Software
            • Services
          • THAILAND Outlook (USD Billion, 2019-2035)
          • THAILAND Market by Deployment Type
            • Cloud
            • On-premises
            • Hybrid
          • THAILAND Market by Application Type
            • Spend Analysis
            • Supplier Performance Analysis
            • Contract Management
            • Risk Management
          • THAILAND Market by End User Type
            • Retail
            • Manufacturing
            • Healthcare
            • IT
            • Telecommunications
          • THAILAND Market by Component Type
            • Software
            • Services
          • INDONESIA Outlook (USD Billion, 2019-2035)
          • INDONESIA Market by Deployment Type
            • Cloud
            • On-premises
            • Hybrid
          • INDONESIA Market by Application Type
            • Spend Analysis
            • Supplier Performance Analysis
            • Contract Management
            • Risk Management
          • INDONESIA Market by End User Type
            • Retail
            • Manufacturing
            • Healthcare
            • IT
            • Telecommunications
          • INDONESIA Market by Component Type
            • Software
            • Services
          • REST OF APAC Outlook (USD Billion, 2019-2035)
          • REST OF APAC Market by Deployment Type
            • Cloud
            • On-premises
            • Hybrid
          • REST OF APAC Market by Application Type
            • Spend Analysis
            • Supplier Performance Analysis
            • Contract Management
            • Risk Management
          • REST OF APAC Market by End User Type
            • Retail
            • Manufacturing
            • Healthcare
            • IT
            • Telecommunications
          • REST OF APAC Market by Component Type
            • Software
            • Services
          • South America Outlook (USD Billion, 2019-2035)
            • South America Market by Deployment Type
              • Cloud
              • On-premises
              • Hybrid
            • South America Market by Application Type
              • Spend Analysis
              • Supplier Performance Analysis
              • Contract Management
              • Risk Management
            • South America Market by End User Type
              • Retail
              • Manufacturing
              • Healthcare
              • IT
              • Telecommunications
            • South America Market by Component Type
              • Software
              • Services
            • South America Market by Regional Type
              • Brazil
              • Mexico
              • Argentina
              • Rest of South America
            • BRAZIL Outlook (USD Billion, 2019-2035)
            • BRAZIL Market by Deployment Type
              • Cloud
              • On-premises
              • Hybrid
            • BRAZIL Market by Application Type
              • Spend Analysis
              • Supplier Performance Analysis
              • Contract Management
              • Risk Management
            • BRAZIL Market by End User Type
              • Retail
              • Manufacturing
              • Healthcare
              • IT
              • Telecommunications
            • BRAZIL Market by Component Type
              • Software
              • Services
            • MEXICO Outlook (USD Billion, 2019-2035)
            • MEXICO Market by Deployment Type
              • Cloud
              • On-premises
              • Hybrid
            • MEXICO Market by Application Type
              • Spend Analysis
              • Supplier Performance Analysis
              • Contract Management
              • Risk Management
            • MEXICO Market by End User Type
              • Retail
              • Manufacturing
              • Healthcare
              • IT
              • Telecommunications
            • MEXICO Market by Component Type
              • Software
              • Services
            • ARGENTINA Outlook (USD Billion, 2019-2035)
            • ARGENTINA Market by Deployment Type
              • Cloud
              • On-premises
              • Hybrid
            • ARGENTINA Market by Application Type
              • Spend Analysis
              • Supplier Performance Analysis
              • Contract Management
              • Risk Management
            • ARGENTINA Market by End User Type
              • Retail
              • Manufacturing
              • Healthcare
              • IT
              • Telecommunications
            • ARGENTINA Market by Component Type
              • Software
              • Services
            • REST OF SOUTH AMERICA Outlook (USD Billion, 2019-2035)
            • REST OF SOUTH AMERICA Market by Deployment Type
              • Cloud
              • On-premises
              • Hybrid
            • REST OF SOUTH AMERICA Market by Application Type
              • Spend Analysis
              • Supplier Performance Analysis
              • Contract Management
              • Risk Management
            • REST OF SOUTH AMERICA Market by End User Type
              • Retail
              • Manufacturing
              • Healthcare
              • IT
              • Telecommunications
            • REST OF SOUTH AMERICA Market by Component Type
              • Software
              • Services
            • MEA Outlook (USD Billion, 2019-2035)
              • MEA Market by Deployment Type
                • Cloud
                • On-premises
                • Hybrid
              • MEA Market by Application Type
                • Spend Analysis
                • Supplier Performance Analysis
                • Contract Management
                • Risk Management
              • MEA Market by End User Type
                • Retail
                • Manufacturing
                • Healthcare
                • IT
                • Telecommunications
              • MEA Market by Component Type
                • Software
                • Services
              • MEA Market by Regional Type
                • GCC Countries
                • South Africa
                • Rest of MEA
              • GCC COUNTRIES Outlook (USD Billion, 2019-2035)
              • GCC COUNTRIES Market by Deployment Type
                • Cloud
                • On-premises
                • Hybrid
              • GCC COUNTRIES Market by Application Type
                • Spend Analysis
                • Supplier Performance Analysis
                • Contract Management
                • Risk Management
              • GCC COUNTRIES Market by End User Type
                • Retail
                • Manufacturing
                • Healthcare
                • IT
                • Telecommunications
              • GCC COUNTRIES Market by Component Type
                • Software
                • Services
              • SOUTH AFRICA Outlook (USD Billion, 2019-2035)
              • SOUTH AFRICA Market by Deployment Type
                • Cloud
                • On-premises
                • Hybrid
              • SOUTH AFRICA Market by Application Type
                • Spend Analysis
                • Supplier Performance Analysis
                • Contract Management
                • Risk Management
              • SOUTH AFRICA Market by End User Type
                • Retail
                • Manufacturing
                • Healthcare
                • IT
                • Telecommunications
              • SOUTH AFRICA Market by Component Type
                • Software
                • Services
              • REST OF MEA Outlook (USD Billion, 2019-2035)
              • REST OF MEA Market by Deployment Type
                • Cloud
                • On-premises
                • Hybrid
              • REST OF MEA Market by Application Type
                • Spend Analysis
                • Supplier Performance Analysis
                • Contract Management
                • Risk Management
              • REST OF MEA Market by End User Type
                • Retail
                • Manufacturing
                • Healthcare
                • IT
                • Telecommunications
              • REST OF MEA Market by Component Type
                • Software
                • Services


    Infographic

    Free Sample Request

    Kindly complete the form below to receive a free sample of this Report

    Get Free Sample

    Customer Strories

    “I am very pleased with how market segments have been defined in a relevant way for my purposes (such as "Portable Freezers & refrigerators" and "last-mile"). In general the report is well structured. Thanks very much for your efforts.”

    Victoria Milne

    Founder
    Case Study
    Chemicals and Materials