Precision Viticulture Market (2026 - 2035)

ID: MRFR/Agri/29561-HCR 100 Pages Snehal Singh Last Updated: September 17, 2026

Precision Viticulture Market Size, Share, Industry Trend & Analysis Research Report: By Component (Hardware, Software, Services), By Technology (Guidance, Remote Sensing, Variable-Rate Technology, Robotics & Automation), By Application (Yield Monitoring, Disease & Pest Management, Irrigation Management, Variable-Rate Application, Others), By End User (Large Vineyards, Medium Vineyards, Small Vineyards), By Deployment Mode (On-Premise, Cloud-Based), By Geography (North America, Europe, Asia-Pacific, South America, Middle East & Africa) - Forecast to 2035

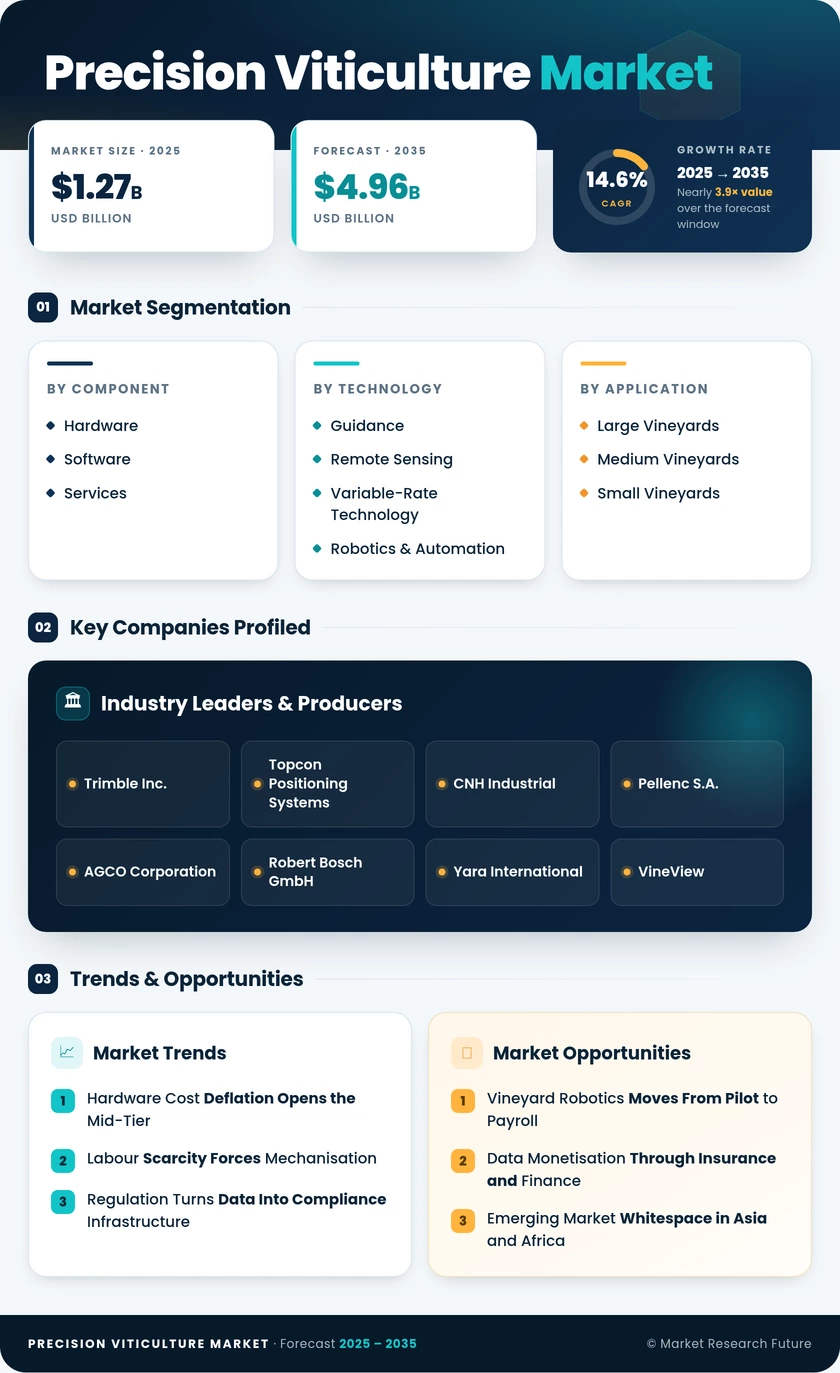
Precision Viticulture Market
Market Size
Forecast Period2026-2035
CAGR (2026-2035)14.6%
2025 Market SizeUSD 1.27 Billion
2035 Market SizeUSD 4.96 Billion
Key Players
Trimble Inc.
Topcon Positioning Systems
CNH Industrial
Pellenc S.A.
AGCO Corporation
Robert Bosch GmbH
Opportunities
  • Vineyard Robotics Moves From Pilot to Payroll
  • Data Monetisation Through Insurance and Finance
  • Emerging Market Whitespace in Asia and Africa
  1. 1 Market Summary |
    1. 1.1 Study Assumptions & Market Definition |
    2. 1.2 Scope of the Study |
    3. 1.3 Research Methodology
  2. 2 Key Report Takeaways |
    1. 2.1 By Technology |
    2. 2.2 By Sector |
    3. 2.3 By Geography
  3. 3 Market Size & Forecast (2021–2035) |
    1. 3.1 Historical Market Size (2021–2025) |
    2. 3.2 Current & Forecast Market Size (2026–2035) |
    3. 3.3 Year-over-Year Growth Analysis
  4. 4 Driver Impact Analysis |
    1. 4.1 Hardware Cost Deflation Opens the Mid-Tier |
    2. 4.2 Labour Scarcity Forces Mechanisation |
    3. 4.3 Regulation Turns Data Into Compliance Infrastructure |
    4. 4.4 Adaptation Funding Underwrites Experimentation
  5. 5 Restraints Impact Analysis |
    1. 5.1 Capital Intensity Excludes the Long Tail |
    2. 5.2 Interoperability Remains an Unsolved Tax |
    3. 5.3 Connectivity Constraints in Off-Grid Regions
  6. 6 Opportunities |
    1. 6.1 Vineyard Robotics Moves From Pilot to Payroll |
    2. 6.2 Data Monetisation Through Insurance and Finance |
    3. 6.3 Emerging Market Whitespace in Asia and Africa |
    4. 6.4 Subscription Agronomy for Small Growers |
    5. 6.5 Provenance Verification for Premium Export Channels
  7. 7 Regional Market Share & Country-Level Analysis |
    1. 7.1 North America | |
      1. 7.1.1 US | |
      2. 7.1.2 Canada | |
      3. 7.1.3 Mexico |
    2. 7.2 Europe | |
      1. 7.2.1 Germany | |
      2. 7.2.2 UK | |
      3. 7.2.3 France | |
      4. 7.2.4 Italy | |
      5. 7.2.5 Spain | |
      6. 7.2.6 Nordic Countries | |
      7. 7.2.7 Russia | |
      8. 7.2.8 Rest of Europe |
    3. 7.3 Asia-Pacific | |
      1. 7.3.1 China | |
      2. 7.3.2 India | |
      3. 7.3.3 Japan | |
      4. 7.3.4 South Korea | |
      5. 7.3.5 ASEAN | |
      6. 7.3.6 Rest of Asia-Pacific |
    4. 7.4 South America | |
      1. 7.4.1 Brazil | |
      2. 7.4.2 Argentina | |
      3. 7.4.3 Rest of South America |
    5. 7.5 Middle East & Africa | |
      1. 7.5.1 Saudi Arabia | |
      2. 7.5.2 UAE | |
      3. 7.5.3 South Africa | |
      4. 7.5.4 Egypt | |
      5. 7.5.5 Rest of Middle East & Africa
  8. 8 Future Outlook (2026–2035) |
    1. 8.1 Autonomy Becomes Ordinary |
    2. 8.2 Platform Economics Reshape Vendor Revenue |
    3. 8.3 Electrification and Energy Discipline |
    4. 8.4 Sustainability Reporting Becomes a Data Problem
  9. 9 Market Segmentation Analysis |
    1. 9.1 By Component | |
      1. 9.1.1 Hardware | |
      2. 9.1.2 Software | |
      3. 9.1.3 Services |
    2. 9.2 By Technology | |
      1. 9.2.1 Guidance | |
      2. 9.2.2 Remote Sensing | |
      3. 9.2.3 Variable-Rate Technology | |
      4. 9.2.4 Robotics & Automation |
    3. 9.3 By Application | |
      1. 9.3.1 Yield Monitoring | |
      2. 9.3.2 Disease & Pest Management | |
      3. 9.3.3 Irrigation Management | |
      4. 9.3.4 Variable-Rate Application | |
      5. 9.3.5 Others |
    4. 9.4 By End User | |
      1. 9.4.1 Large Vineyards | |
      2. 9.4.2 Medium Vineyards | |
      3. 9.4.3 Small Vineyards |
    5. 9.5 By Deployment Mode | |
      1. 9.5.1 On-Premise | |
      2. 9.5.2 Cloud-Based
  10. 10 Competitive Landscape |
    1. 10.1 Market Concentration Analysis |
    2. 10.2 Competitive Benchmarking Matrix |
    3. 10.3 Company Profiles | |
      1. 10.3.1 Trimble Inc. | |
      2. 10.3.2 Deere & Company | |
      3. 10.3.3 Topcon Positioning Systems | |
      4. 10.3.4 CNH Industrial | |
      5. 10.3.5 Pellenc S.A. | |
      6. 10.3.6 AGCO Corporation | |
      7. 10.3.7 Robert Bosch GmbH | |
      8. 10.3.8 Yara International | |
      9. 10.3.9 VineView | |
      10. 10.3.10 Semios | |
      11. 10.3.11 Fruition Sciences | |
      12. 10.3.12 Agrivi
  11. 11 Recent News & Developments
  12. 12 Report Scope & Methodology |
    1. 12.1 Study Period & Base Year |
    2. 12.2 Data Sources & Triangulation |
    3. 12.3 Abbreviations
  13. 13 Detailed Sources & Citations
  14. 14 Frequently Asked Questions
  15. 15 LIST OF TABLES |
  16. TABLE 1 Global Precision Viticulture Market Size & Forecast, by Revenue (USD Billion), 2021–2035 |
  17. TABLE 2 Global Precision Viticulture Market – Year-over-Year Growth Analysis, 2021–2035 |
  18. TABLE 3 Driver Impact Analysis Matrix, 2026–2035 |
  19. TABLE 4 Restraint Impact Analysis Matrix, 2026–2035 |
  20. TABLE 5 Global Market Size, by Region (USD Billion), 2021–2035 |
  21. TABLE 6 North America Market Size, by Country (USD Billion), 2021–2035 |
  22. TABLE 7 Europe Market Size, by Country (USD Billion), 2021–2035 |
  23. TABLE 8 Asia-Pacific Market Size, by Country (USD Billion), 2021–2035 |
  24. TABLE 9 South America Market Size, by Country (USD Billion), 2021–2035 |
  25. TABLE 10 Middle East & Africa Market Size, by Country (USD Billion), 2021–2035 |
  26. TABLE 11 Global Market Size, by Component (USD Billion), 2021–2035 |
  27. TABLE 12 Global Market Size, by Technology (USD Billion), 2021–2035 |
  28. TABLE 13 Global Market Size, by Application (USD Billion), 2021–2035 |
  29. TABLE 14 Global Market Size, by End User (USD Billion), 2021–2035 |
  30. TABLE 15 Global Market Size, by Deployment Mode (USD Billion), 2021–2035 |
  31. TABLE 16 North America Market Size, by Component and Application, 2021–2035 |
  32. TABLE 17 Europe Market Size, by Component and Application, 2021–2035 |
  33. TABLE 18 Asia-Pacific Market Size, by Component and Application, 2021–2035 |
  34. TABLE 19 South America Market Size, by Component and Application, 2021–2035 |
  35. TABLE 20 Middle East & Africa Market Size, by Component and Application, 2021–2035 |
  36. TABLE 21 Competitive Benchmarking Matrix, 2026 |
  37. TABLE 22 Company Profiles – Key Players |
  38. TABLE 23 Recent Developments & Strategic Announcements, 2023–2025 |
  39. TABLE 24 Report Scope & Methodology Summary |
  40. TABLE 25 Detailed Sources & Citations Index
  41. 16 LIST OF FIGURES |
  42. FIGURE 1 Market Dynamics – Drivers, Restraints and Opportunities Snapshot |
  43. FIGURE 2 Industry Value Chain Analysis |
  44. FIGURE 3 Porter's Five Forces Analysis |
  45. FIGURE 4 Global Market Size Trend and Forecast (USD Billion), 2021–2035 |
  46. FIGURE 5 Year-over-Year Growth Curve, 2022–2035 |
  47. FIGURE 6 Revenue Share by Component, 2025 vs 2035 |
  48. FIGURE 7 Revenue Share by Technology, 2025 vs 2035 |
  49. FIGURE 8 Revenue Share by Application, 2025 vs 2035 |
  50. FIGURE 9 Revenue Share by End User, 2025 vs 2035 |
  51. FIGURE 10 Revenue Share by Deployment Mode, 2025 vs 2035 |
  52. FIGURE 11 Regional Revenue Share, 2025 |
  53. FIGURE 12 Regional CAGR Comparison, 2026–2035 |
  54. FIGURE 13 Country-Level Adoption Heat Map |
  55. FIGURE 14 Competitive Landscape – Estimated Revenue Share Bands, 2026 |
  56. FIGURE 15 Vendor Positioning Matrix – Platform Breadth vs Domain Depth

Segmentation Quick Reference

DimensionSub-SegmentsDominant SegmentFastest Growing Segment
By ComponentHardware, Software, ServicesHardwareSoftware
By TechnologyGuidance, Remote Sensing, Variable-Rate Technology, Robotics & AutomationGuidanceVariable-Rate Technology
By ApplicationYield Monitoring, Disease & Pest Management, Irrigation Management, Variable-Rate Application, OthersYield MonitoringVariable-Rate Application
By End UserLarge Vineyards, Medium Vineyards, Small VineyardsLarge VineyardsMedium Vineyards
By Deployment ModeOn-Premise, Cloud-BasedOn-PremiseCloud-Based
By GeographyNorth America, Europe, Asia-Pacific, South America, Middle East & AfricaNorth AmericaAsia-Pacific


Market Segmentation Overview

By Component

Sub-SegmentKey Trend
HardwareSensor and airframe price deflation broadens the addressable buyer base
SoftwarePer-hectare subscription pricing converts one-time sales into annuity revenue
ServicesContractor-flown imagery and advisory retainers serve growers below the capex threshold


Component economics are inverting. Hardware still opens the account, but the durable margin is migrating to software and the advisory services wrapped around it, which is why every major supplier now leads with platform messaging rather than specifications.

By Technology

Sub-SegmentKey Trend
GuidanceRetrofit GNSS steering remains the lowest-friction entry point for conventional fleets
Remote SensingSatellite and aerial imagery converge into blended, subscription-delivered data layers
Variable-Rate TechnologyRunoff regulation and input costs push prescription execution into mainstream use
Robotics & AutomationSupervised autonomy scales first in high-wage, high-value production regions


Adoption follows a consistent ladder — steer, then see, then act. Estates rarely leapfrog stages successfully, because prescription accuracy depends on at least two seasons of block-level observation before actuation delivers reliable returns.

By Application

Sub-SegmentKey Trend
Yield MonitoringTonnage forecasting drives winery capacity and contract-grape planning
Disease & Pest ManagementForecast models cut fungicide passes without measurable efficacy loss
Irrigation ManagementGroundwater metering and allocation trading create direct financial returns
Variable-Rate ApplicationDocumented input reductions strengthen both margin and compliance positions
OthersFrost protection and harvest-date prediction emerge as high-value niches


Application priorities track avoidable loss. Growers fund the tool that prevents the most expensive failure in their specific climate, which explains why Mediterranean estates buy disease models first while Argentine and Californian operations buy irrigation analytics.

By End User

Sub-SegmentKey Trend
Large VineyardsIn-house agronomy teams pursue full-stack, multi-site deployments
Medium VineyardsCost declines finally clear investment hurdles for 20–100 hectare operations
Small VineyardsCooperative purchasing and shared contractor models substitute for ownership


Growth has moved down-market. Large estates built the reference cases, but the medium tier now supplies the incremental volume, and vendors that cannot serve a 40-hectare buyer profitably will forfeit the fastest-expanding pool of demand.

By Deployment Mode

Sub-SegmentKey Trend
On-PremisePersists where rural connectivity is unreliable, or data custody is contested
Cloud-BasedMulti-estate portfolio management and lower IT overhead accelerate migration


Deployment preference is a proxy for infrastructure quality. As low-earth-orbit backhaul and rural cellular coverage improve, the practical argument for on-premise architecture weakens, leaving data-sovereignty preferences as the main remaining constraint.




Download PDF ×

We do not share your information with anyone. However, we may send you emails based on your report interest from time to time. You may contact us at any time to opt-out.