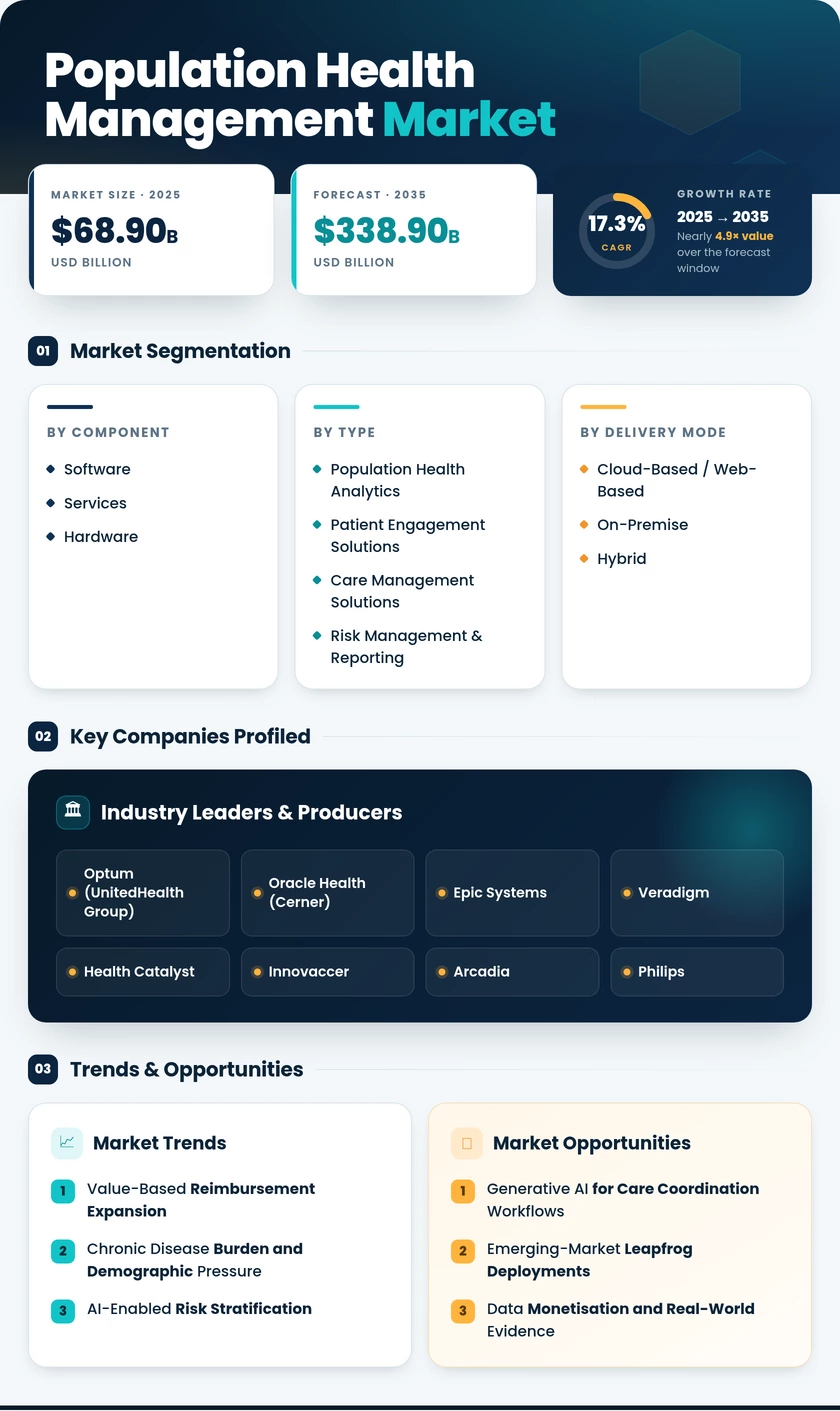
Population Health Management Market (2026 - 2035)

Population health management Market Research Report: Size, Share, Trend Analysis - Growth & Industry Forecast 2025 To 2035

Forecast Period
2026-2035
CAGR
17.3%
2025 Market Size
USD 68.9 Billion
2035 Market Size
USD 338.9 Billion
Healthcare Services ● Updated August 2026 Report ID: MRFR/HS/2250-HCR | Pages: 200 | Author: Satyendra Maurya, Rahul Gotadki
  1. 1 Market Overview |
    1. 1.1 Study Assumptions & Market Definition |
    2. 1.2 Scope of the Study |
    3. 1.3 Research Methodology
  2. 2 Market Summary & Key Takeaways |
    1. 2.1 Takeaways by Technology |
    2. 2.2 Takeaways by Sector |
    3. 2.3 Takeaways by Geography
  3. 3 Global Market Size & Forecast (2021–2035) |
    1. 3.1 Historical Market Size (2021–2025) |
    2. 3.2 Current & Forecast Market Size (2026–2035) |
    3. 3.3 Market Size by Revenue (USD Billion) |
    4. 3.4 Year-over-Year Growth Analysis
  4. 4 Market Drivers Analysis |
    1. 4.1 Value-Based Reimbursement Expansion |
    2. 4.2 Chronic Disease Burden & Demographic Pressure |
    3. 4.3 AI-Enabled Risk Stratification |
    4. 4.4 Interoperability Mandates & FHIR APIs
  5. 5 Market Restraints Analysis |
    1. 5.1 Privacy & Consent Architecture |
    2. 5.2 Legacy Integration Economics |
    3. 5.3 Return-on-Investment Ambiguity for Smaller Buyers
  6. 6 Market Opportunity Analysis |
    1. 6.1 Generative AI for Care Coordination Workflows |
    2. 6.2 Emerging-Market Leapfrog Deployments |
    3. 6.3 Data Monetisation & Real-World Evidence |
    4. 6.4 Social Determinants & Community Referral Networks |
    5. 6.5 Payer-Provider Convergence Platforms |
    6. 6.6 Industry Value Chain Analysis |
    7. 6.7 Porter's Five Forces Analysis
  7. 7 Regional Analysis |
    1. 7.1 North America | |
      1. 7.1.1 US | |
      2. 7.1.2 Canada | |
      3. 7.1.3 Mexico |
    2. 7.2 Europe | |
      1. 7.2.1 Germany | |
      2. 7.2.2 UK | |
      3. 7.2.3 France | |
      4. 7.2.4 Italy | |
      5. 7.2.5 Spain | |
      6. 7.2.6 Nordic Countries | |
      7. 7.2.7 Russia | |
      8. 7.2.8 Rest of Europe |
    3. 7.3 Asia-Pacific | |
      1. 7.3.1 China | |
      2. 7.3.2 India | |
      3. 7.3.3 Japan | |
      4. 7.3.4 South Korea | |
      5. 7.3.5 ASEAN | |
      6. 7.3.6 Rest of Asia-Pacific |
    4. 7.4 South America | |
      1. 7.4.1 Brazil | |
      2. 7.4.2 Argentina | |
      3. 7.4.3 Rest of South America |
    5. 7.5 Middle East & Africa | |
      1. 7.5.1 Saudi Arabia | |
      2. 7.5.2 UAE | |
      3. 7.5.3 South Africa | |
      4. 7.5.4 Egypt | |
      5. 7.5.5 Rest of Middle East & Africa
  8. 8 Future Outlook (2026–2035) |
    1. 8.1 Autonomous Care Operations |
    2. 8.2 Platform Economics & Consolidation |
    3. 8.3 Genomics & Precision Population Stratification |
    4. 8.4 Climate, Equity & Non-Clinical Determinants
  9. 9 Segmentation Analysis |
    1. 9.1 By Component | |
      1. 9.1.1 Software | |
      2. 9.1.2 Services | |
      3. 9.1.3 Hardware |
    2. 9.2 By Solution Type | |
      1. 9.2.1 Population Health Analytics | |
      2. 9.2.2 Patient Engagement Solutions | |
      3. 9.2.3 Care Management Solutions | |
      4. 9.2.4 Risk Management & Reporting |
    3. 9.3 By Delivery Mode | |
      1. 9.3.1 On-Premise | |
      2. 9.3.2 Cloud-Based / Web-Based | |
      3. 9.3.3 Hybrid |
    4. 9.4 By End User | |
      1. 9.4.1 Healthcare Providers | |
      2. 9.4.2 Payers | |
      3. 9.4.3 Employer Groups & Government Agencies
  10. 10 Competitive Landscape |
    1. 10.1 Market Share Analysis (2026) |
    2. 10.2 Competitive Benchmarking Matrix |
    3. 10.3 Company Profiles | |
      1. 10.3.1 Optum (UnitedHealth Group) | |
      2. 10.3.2 Oracle Health (Cerner) | |
      3. 10.3.3 Epic Systems | |
      4. 10.3.4 Veradigm | |
      5. 10.3.5 Health Catalyst | |
      6. 10.3.6 Innovaccer | |
      7. 10.3.7 Arcadia | |
      8. 10.3.8 Philips | |
      9. 10.3.9 Cotiviti | |
      10. 10.3.10 NextGen Healthcare | |
      11. 10.3.11 Medecision
  11. 11 Recent Developments & News
  12. 12 Report Scope & Methodology |
    1. 12.1 Study Period & Base Year |
    2. 12.2 Data Sources & Citations |
    3. 12.3 Abbreviations
  13. 13 Detailed Sources & Citations
  14. 14 Frequently Asked Questions (FAQs)
  15. 15 LIST OF TABLES |
  16. TABLE 1 Global Population Health Management Market Size & Forecast, by Revenue (USD Billion), 2021–2035 |
  17. TABLE 2 Global Market – Year-over-Year Growth Analysis, 2021–2035 |
  18. TABLE 3 Driver Impact Analysis Matrix, 2026–2035 |
  19. TABLE 4 Restraint Impact Analysis Matrix, 2026–2035 |
  20. TABLE 5 Global Market Size, by Component, 2021–2035 (USD Billion) |
  21. TABLE 6 Global Market Size, by Solution Type, 2021–2035 (USD Billion) |
  22. TABLE 7 Global Market Size, by Delivery Mode, 2021–2035 (USD Billion) |
  23. TABLE 8 Global Market Size, by End User, 2021–2035 (USD Billion) |
  24. TABLE 9 Global Market Size, by Region, 2021–2035 (USD Billion) |
  25. TABLE 10 North America Market Size, by Country, 2021–2035 (USD Billion) |
  26. TABLE 11 Europe Market Size, by Country, 2021–2035 (USD Billion) |
  27. TABLE 12 Asia-Pacific Market Size, by Country, 2021–2035 (USD Billion) |
  28. TABLE 13 South America Market Size, by Country, 2021–2035 (USD Billion) |
  29. TABLE 14 Middle East & Africa Market Size, by Country, 2021–2035 (USD Billion) |
  30. TABLE 15 North America Market Size, by Component, 2021–2035 (USD Billion) |
  31. TABLE 16 North America Market Size, by Solution Type, 2021–2035 (USD Billion) |
  32. TABLE 17 North America Market Size, by Delivery Mode, 2021–2035 (USD Billion) |
  33. TABLE 18 North America Market Size, by End User, 2021–2035 (USD Billion) |
  34. TABLE 19 Europe Market Size, by Component, 2021–2035 (USD Billion) |
  35. TABLE 20 Europe Market Size, by Solution Type, 2021–2035 (USD Billion) |
  36. TABLE 21 Europe Market Size, by Delivery Mode, 2021–2035 (USD Billion) |
  37. TABLE 22 Europe Market Size, by End User, 2021–2035 (USD Billion) |
  38. TABLE 23 Asia-Pacific Market Size, by Component, 2021–2035 (USD Billion) |
  39. TABLE 24 Asia-Pacific Market Size, by Solution Type, 2021–2035 (USD Billion) |
  40. TABLE 25 Asia-Pacific Market Size, by Delivery Mode, 2021–2035 (USD Billion) |
  41. TABLE 26 Asia-Pacific Market Size, by End User, 2021–2035 (USD Billion) |
  42. TABLE 27 South America Market Size, by Component, 2021–2035 (USD Billion) |
  43. TABLE 28 South America Market Size, by Solution Type, 2021–2035 (USD Billion) |
  44. TABLE 29 South America Market Size, by Delivery Mode, 2021–2035 (USD Billion) |
  45. TABLE 30 South America Market Size, by End User, 2021–2035 (USD Billion) |
  46. TABLE 31 Middle East & Africa Market Size, by Component, 2021–2035 (USD Billion) |
  47. TABLE 32 Middle East & Africa Market Size, by Solution Type, 2021–2035 (USD Billion) |
  48. TABLE 33 Middle East & Africa Market Size, by Delivery Mode, 2021–2035 (USD Billion) |
  49. TABLE 34 Middle East & Africa Market Size, by End User, 2021–2035 (USD Billion) |
  50. TABLE 35 US Market Size, by Component & End User, 2021–2035 (USD Billion) |
  51. TABLE 36 Germany Market Size, by Component & End User, 2021–2035 (USD Billion) |
  52. TABLE 37 China Market Size, by Component & End User, 2021–2035 (USD Billion) |
  53. TABLE 38 India Market Size, by Component & End User, 2021–2035 (USD Billion) |
  54. TABLE 39 Brazil Market Size, by Component & End User, 2021–2035 (USD Billion) |
  55. TABLE 40 Saudi Arabia Market Size, by Component & End User, 2021–2035 (USD Billion) |
  56. TABLE 41 Competitive Benchmarking Matrix, 2026 |
  57. TABLE 42 Company Profiles – Key Players |
  58. TABLE 43 Recent Developments & Strategic Announcements, 2023–2025 |
  59. TABLE 44 Report Scope & Methodology Summary |
  60. TABLE 45 Detailed Sources & Citations Index
  61. 16 LIST OF FIGURES |
  62. FIGURE 1 Market Dynamics – Drivers, Restraints & Opportunities Overview |
  63. FIGURE 2 Industry Value Chain Analysis |
  64. FIGURE 3 Porter's Five Forces Analysis |
  65. FIGURE 4 Global Market Size Trend & Forecast, 2021–2035 (USD Billion) |
  66. FIGURE 5 Year-over-Year Growth Rate Curve, 2022–2035 (%) |
  67. FIGURE 6 Market Share by Component, 2025 vs 2035 (%) |
  68. FIGURE 7 Market Share by Solution Type, 2025 vs 2035 (%) |
  69. FIGURE 8 Market Share by Delivery Mode, 2025 vs 2035 (%) |
  70. FIGURE 9 Market Share by End User, 2025 vs 2035 (%) |
  71. FIGURE 10 Regional Revenue Share Distribution, 2025 (%) |
  72. FIGURE 11 Regional CAGR Comparison, 2026–2035 (%) |
  73. FIGURE 12 North America Country-Level Share Breakdown, 2025 (%) |
  74. FIGURE 13 Europe Country-Level Share Breakdown, 2025 (%) |
  75. FIGURE 14 Asia-Pacific Country-Level Share Breakdown, 2025 (%) |
  76. FIGURE 15 Competitive Landscape – Vendor Positioning Quadrant, 2026 |
  77. FIGURE 16 Top-Five Vendor Revenue Share Concentration, 2025–2032 (%) |
  78. FIGURE 17 Driver Impact Weighting Chart |
  79. FIGURE 18 Restraint Impact Weighting Chart
Share::
Request Free Sample

Segmentation Quick Reference

DimensionSub-SegmentsDominant SegmentFastest Growing Segment
By ComponentSoftware; Services; HardwareSoftwareServices
By Solution TypePopulation Health Analytics; Patient Engagement Solutions; Care Management Solutions; Risk Management & ReportingPopulation Health AnalyticsPatient Engagement Solutions
By Delivery ModeOn-Premise; Cloud-Based / Web-Based; HybridCloud-Based / Web-BasedHybrid
By End UserHealthcare Providers; Payers; Employer Groups & Government AgenciesHealthcare ProvidersPayers
By GeographyNorth America; Europe; Asia-Pacific; South America; Middle East & AfricaNorth AmericaAsia-Pacific


Market Segmentation Overview

By Component

Sub-SegmentKey Trend
SoftwareVendor-neutral analytics overlays decoupled from the core record system
ServicesOutsourced data normalisation and quality-measure abstraction contracts
HardwareRemote monitoring endpoints feeding continuous physiological streams


Component mix is shifting toward recurring revenue. Software retains the largest share, but services attach rates now exceed 70% on enterprise deals because data readiness — not licensing — determines time to value.

By Solution Type

Sub-SegmentKey Trend
Population Health AnalyticsPredictive stratification replacing retrospective registry reporting
Patient Engagement SolutionsConversational AI outreach at panel scale
Care Management SolutionsClosed-loop referral tracking across community organisations
Risk Management & ReportingAutomated quality-measure submission and audit defence


Analytics remains the anchor purchase, yet engagement is where differentiation is emerging. Vendors that can prove contact-to-closure conversion — not just risk-score accuracy — command renewal pricing power.

By Delivery Mode

Sub-SegmentKey Trend
On-PremiseDeclining to sovereignty-constrained and legacy-contract deployments
Cloud-Based / Web-BasedDefault architecture for multi-site provider networks
HybridLocal data residency paired with shared model infrastructure


Delivery preference has effectively resolved in favour of cloud. Hybrid persists as the compliance-driven middle path in Europe and the Gulf, growing faster than either pure option.

By End User

Sub-SegmentKey Trend
Healthcare ProvidersDownside-risk contracts forcing enterprise-wide attribution capability
PayersRisk-adjustment accuracy and Star Ratings optimisation
Employer Groups & Government AgenciesSelf-funded plans and public schemes professionalising vendor selection


Buyer sophistication is rising across all three groups. Providers still drive volume, but payers set the pace of feature demand because their financial feedback loop from analytics investment is shorter and more measurable.

By Geography

Sub-SegmentKey Trend
North AmericaAccountable care expansion toward universal Medicare alignment
EuropeHealth data space regulation creating mandatory secondary-use infrastructure
Asia-PacificNational digital missions supplying public identity and consent layers
South AmericaSupplementary insurer margin pressure driving stratification adoption
Middle East & AfricaSovereign transformation programmes building population-scale platforms


Regional divergence is narrowing on capability but widening on procurement style. Mature markets buy replacement; emerging markets buy greenfield, and the second group increasingly sets deployment speed benchmarks.




Share::
Request Free Sample
Download PDF ×

We do not share your information with anyone. However, we may send you emails based on your report interest from time to time. You may contact us at any time to opt-out.