ID: MRFR/F-B & N/2441-HCR | February 2021 | Region: Global | 110 pages
Market Scenario
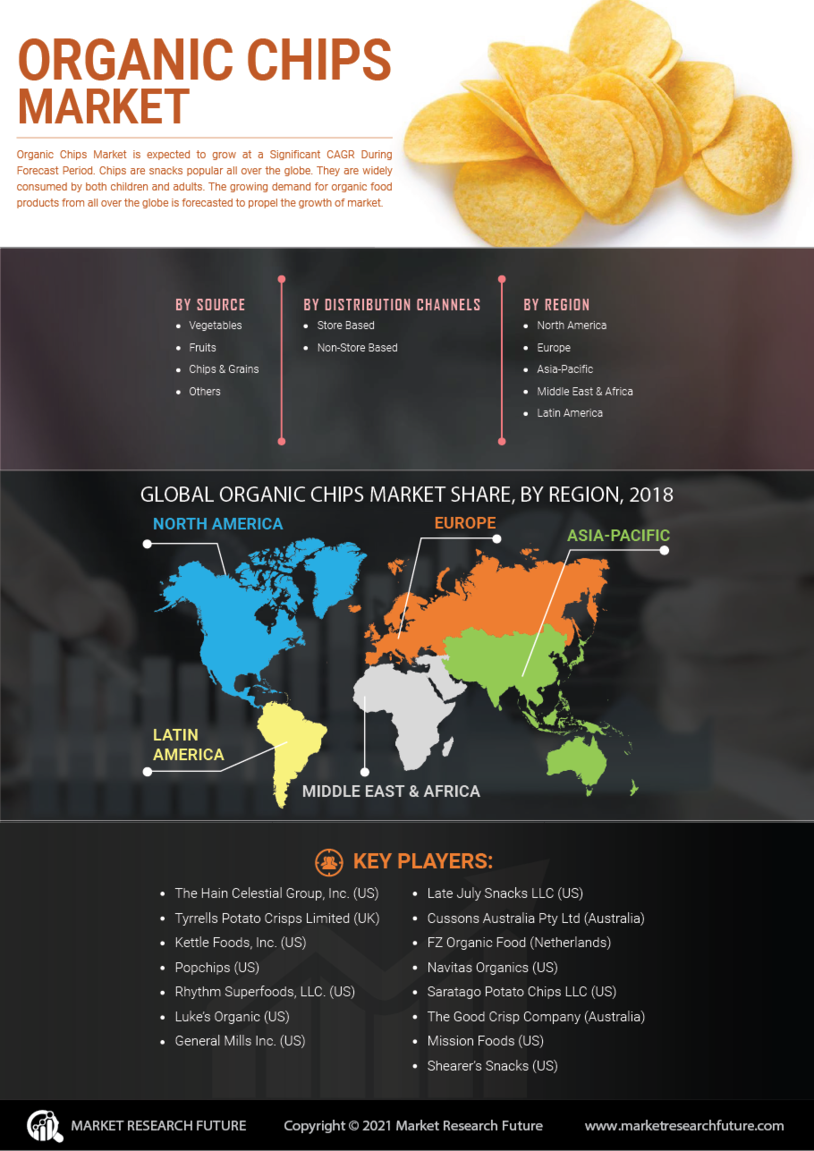
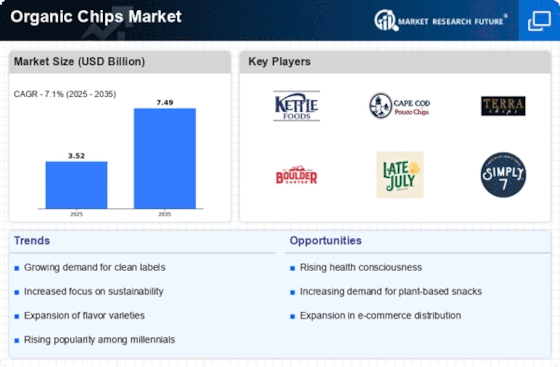
Organic Chips Market is expected to register a CAGR of 6.19% from 2019 to 2024 and reach USD 21.29 billion by the end of 2024. Chips are snacks popular all over the globe. They are widely consumed by both children and adults. The growing demand for organic food products from all over the globe is forecasted to propel the growth of global organic chips market. Growing health awareness among consumers coupled with increasing disposable income is expected to boost the growth of global organic chips market. Additionally, growing demand for nutritional snacks from health-conscious population is anticipated to fuel the growth of global organic chips market. The increasing need for convenient and readymade food products is driving the growth of the global organic chips market.
Segmentation
The global organic chips have been segmented based on source, distribution channels, and region.
The global organic chips have been classified, based on source, as vegetables, fruits, chips & grains, and others.
The global organic chips have been segmented, on the basis of distribution channel, into store-based and non-store-based. The store-based segment has been further sub-segmented into supermarkets & hypermarkets, convenience stores, and others.
The global organic chips have been analyzed for four key regions—North America, Europe, Asia-Pacific, and the rest of the world.
The North American organic chips have further been segmented into the US, Canada, and Mexico.
The European organic chips have been classified as the UK, Germany, France, Italy, Spain, and the rest of Europe.
The organic chips market in Asia-Pacific has been divided into China, India, Japan, Australia and New Zealand, and the rest of Asia-Pacific.
The organic chips, in the rest of the world, has been segmented into South America, the Middle East, and Africa.
Key Players
The Hain Celestial Group, Inc. (US), Tyrrells Potato Crisps Limited (UK), Kettle Foods, Inc. (US), Popchips (US), Rhythm Superfoods, LLC. (US), Luke’s Organic (US), General Mills Inc. (US), Late July Snacks LLC (US), Cussons Australia Pty Ltd (Australia), FZ Organic Food (Netherlands), Navitas Organics (US), Saratago Potato Chips LLC (US), The Good Crisp Company (Australia), Mission Foods (US), and Shearer’s Snacks (US) are some of the key players in the global organic chips.
Regional Market Summary
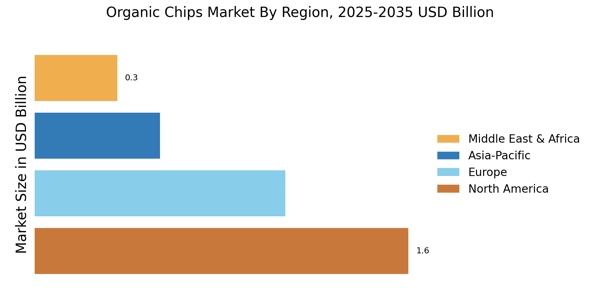
The market in North America is expected to dominate the global organic chips market due to the high demand for organic food. Moreover, the high disposable income of the population in the region and growing health awareness are expected to fuel the growth of global organic chips market.
The market in Asia-Pacific is projected to register the highest CAGR in the global organic chips market, due to increasing demand for nutritional food snacks. Moreover, the changing lifestyle and food habits of the consumers in the region is forecasted to boost the growth of global organic chips market.
The global organic chips market in the rest of the world is expected to grow at a steady rate due to rising demand for organic food products in many parts of the world.
Global Organic Chips, by Source
Frequently Asked Questions (FAQ) :
Organic chips market valuation would be USD 21.29 billion by 2024.
Organic chips market CAGR would be 6.19% during the forecast period.
Organic chips market players mentioned in the report are Tyrrells Potato Crisps Limited (UK), Kettle Foods, Inc. (US), The Hain Celestial Group, Inc. (US), Luke’s Organic (US), General Mills Inc. (US), Popchips (US), Rhythm Superfoods, LLC. (US), Cussons Australia Pty Ltd (Australia), Late July Snacks LLC (US), Navitas Organics (US), FZ Organic Food (Netherlands), The Good Crisp Company (Australia), Mission Foods (US), Saratago Potato Chips LLC (US), and Shearer’s Snacks (US).
North America would enjoy the organic chips market lead.
The forecast period would witness Asia Pacific registering the fastest CAGR in the organic chips market.
TABLE OF CONTENTS
1. 1 EXECUTIVE SUMMARY
1.1. Market Attractiveness Analysis
1.1.1. Global Organic Chips Market, by Source
1.1.2. Global Organic Chips Market, by Distribution Channel
1.1.3. Global Organic Chips Market, by Region
2. MARKET INTRODUCTION
2.1. Definition
2.2. Scope of the Study
2.3. Market Structure
2.4. Key Buying Criteria
2.5. Macro Factor Indicator Analysis
3. RESEARCH METHODOLOGY
3.1. Research Process
3.2. Primary Research
3.3. Secondary Research
3.4. Market Size Estimation
3.5. Forecast Model
3.6. List of Assumptions
4. MARKET DYNAMICS
4.1. Introduction
4.2. Drivers
4.3. Restraints
4.4. Opportunities
4.5. Challenges
5. MARKET FACTOR ANALYSIS
5.1. Value Chain Analysis
5.2. Supply Chain Analysis
5.3. Porter’s Five Forces Model
5.3.1. Bargaining Power of Suppliers
5.3.2. Bargaining Power of Buyers
5.3.3. Threat of New Entrants
5.3.4. Threat of Substitutes
5.3.5. Intensity of Rivalry
6. GLOBAL ORGANIC CHIPS MARKET, BY SOURCE
6.1. Introduction
6.2. Vegetables
6.2.1. Vegetables: Market Estimates & Forecast by Region/Country, 2019–2024
6.3. Fruits
6.3.1. Fruits: Market Estimates & Forecast by Region/Country, 2019–2024
6.4. Cereals & Grains
6.4.1. Cereals & Grains: Market Estimates & Forecast by Region/Country, 2019–2024
6.5. Others
6.5.1. Others: Market Estimates & Forecast by Region/Country, 2019–2024
7. GLOBAL ORGANIC CHIPS MARKET, BY DISTRIBUTION CHANNEL
7.1. Introduction
7.2. Store Based
7.2.1. Supermarkets & Hypermarkets
7.2.1.1. Supermarkets & Hypermarkets: Market Estimates & Forecast by Region/Country, 2019–2024
7.2.2. Convenience Stores
7.2.2.1. Convenience Stores: Market Estimates & Forecast by Region/Country, 2019–2024
7.2.3. Others
7.2.3.1. Others: Market Estimates & Forecast by Region/Country, 2019–2024
7.3. Non-Store Based
7.3.1.1. Non-Store Based: Market Estimates & Forecast by Region/Country, 2019–2024
8. GLOBAL ORGANIC CHIPS MARKET, BY REGION
8.1. Introduction
8.2. North America
8.2.1. Market Estimates & Forecast by Source, 2019–2024
8.2.2. Market Estimates & Forecast by Distribution Channel, 2019–2024
8.2.3. Market Estimates & Forecast by Country, 2019–2024
8.2.4. US
8.2.4.1. Market Estimates & Forecast by Source, 2019–2024
8.2.4.2. Market Estimates & Forecast by Distribution Channel, 2019–2024
8.2.5. Canada
8.2.5.1. Market Estimates & Forecast by Source, 2019–2024
8.2.5.2. Market Estimates & Forecast by Distribution Channel, 2019–2024
8.2.6. Mexico
8.2.6.1. Market Estimates & Forecast by Source, 2019–2024
8.2.6.2. Market Estimates & Forecast by Distribution Channel, 2019–2024
8.3. Europe
8.3.1. Market Estimates & Forecast by Source, 2019–2024
8.3.2. Market Estimates & Forecast by Distribution Channel, 2019–2024
8.3.3. Market Estimates & Forecast by Country, 2019–2024
8.3.4. Germany
8.3.4.1. Market Estimates & Forecast by Source, 2019–2024
8.3.4.2. Market Estimates & Forecast by Distribution Channel, 2019–2024
8.3.5. UK
8.3.5.1. Market Estimates & Forecast by Source, 2019–2024
8.3.5.2. Market Estimates & Forecast by Distribution Channel, 2019–2024
8.3.6. France
8.3.6.1. Market Estimates & Forecast by Source, 2019–2024
8.3.6.2. Market Estimates & Forecast by Distribution Channel, 2019–2024
8.3.7. Spain
8.3.7.1. Market Estimates & Forecast by Source, 2019–2024
8.3.7.2. Market Estimates & Forecast by Distribution Channel, 2019–2024
8.3.8. Italy
8.3.8.1. Market Estimates & Forecast by Source, 2019–2024
8.3.8.2. Market Estimates & Forecast by Distribution Channel, 2019–2024
8.3.9. Rest of Europe
8.3.9.1. Market Estimates & Forecast by Source, 2019–2024
8.3.9.2. Market Estimates & Forecast by Distribution Channel, 2019–2024
8.4. Asia-Pacific
8.4.1. Market Estimates & Forecast by Source, 2019–2024
8.4.2. Market Estimates & Forecast by Distribution Channel, 2019–2024
8.4.3. Market Estimates & Forecast by Country, 2019–2024
8.4.4. China
8.4.4.1. Market Estimates & Forecast by Source, 2019–2024
8.4.4.2. Market Estimates & Forecast by Distribution Channel, 2019–2024
8.4.5. Japan
8.4.5.1. Market Estimates & Forecast by Source, 2019–2024
8.4.5.2. Market Estimates & Forecast by Distribution Channel, 2019–2024
8.4.6. India
8.4.6.1. Market Estimates & Forecast by Source, 2019–2024
8.4.6.2. Market Estimates & Forecast by Distribution Channel, 2019–2024
8.4.7. Australia & New Zealand
8.4.7.1. Market Estimates & Forecast by Source, 2019–2024
8.4.7.2. Market Estimates & Forecast by Distribution Channel, 2019–2024
8.4.8. Rest of Asia-Pacific
8.4.8.1. Market Estimates & Forecast by Source, 2019–2024
8.4.8.2. Market Estimates & Forecast by Distribution Channel, 2019–2024
8.5. Rest of the World
8.5.1. Market Estimates & Forecast by Source, 2019–2024
8.5.2. Market Estimates & Forecast by Distribution Channel, 2019–2024
8.5.3. Market Estimates & Forecast by Region, 2019–2024
8.5.4. South America
8.5.4.1. Market Estimates & Forecast by Source, 2019–2024
8.5.4.2. Market Estimates & Forecast by Distribution Channel, 2019–2024
8.5.5. Middle East
8.5.5.1. Market Estimates & Forecast by Source, 2019–2024
8.5.5.2. Market Estimates & Forecast by Distribution Channel, 2019–2024
8.5.6. Africa
8.5.6.1. Market Estimates & Forecast by Source, 2019–2024
8.5.6.2. Market Estimates & Forecast by Distribution Channel, 2019–2024
9. COMPETITIVE LANDSCAPE
9.1. Introduction
9.2. Competitive Benchmarking
9.3. Development Share Analysis
9.4. Key Developments & Growth Strategies
10. COMPANY PROFILES
10.1. The Hain Celestial Group, Inc.
10.1.1. Company Overview
10.1.2. Financial Overview
10.1.3. Products Offered
10.1.4. Key Developments
10.1.5. SWOT Analysis
10.1.6. Key Strategies
10.2. Tyrrells Potato Crisps Limited
10.2.1. Company Overview
10.2.2. Financial Overview
10.2.3. Products Offered
10.2.4. Key Developments
10.2.5. SWOT Analysis
10.2.6. Key Strategies
10.3. Kettle Foods, Inc.
10.3.1. Company Overview
10.3.2. Financial Overview
10.3.3. Products Offered
10.3.4. Key Developments
10.3.5. SWOT Analysis
10.3.6. Key Strategies
10.4. Popchips
10.4.1. Company Overview
10.4.2. Financial Overview
10.4.3. Products Offered
10.4.4. Key Developments
10.4.5. SWOT Analysis
10.4.6. Key Strategies
10.5. Rhythm Superfoods LLC
10.5.1. Company Overview
10.5.2. Financial Overview
10.5.3. Products Offered
10.5.4. Key Developments
10.5.5. SWOT Analysis
10.5.6. Key Strategies
10.6. Luke’s Organic
10.6.1. Company Overview
10.6.2. Financial Overview
10.6.3. Products Offered
10.6.4. Key Developments
10.6.5. SWOT Analysis
10.6.6. Key Strategies
10.7. General Mills Inc.
10.7.1. Company Overview
10.7.2. Financial Overview
10.7.3. Products Offered
10.7.4. Key Developments
10.7.5. SWOT Analysis
10.7.6. Key Strategies
10.8. Late July Snacks LLC
10.8.1. Company Overview
10.8.2. Financial Overview
10.8.3. Products Offered
10.8.4. Key Developments
10.8.5. SWOT Analysis
10.8.6. Key Strategies
10.9. Cussons Australia Pty Ltd
10.9.1. Company Overview
10.9.2. Financial Overview
10.9.3. Products Offered
10.9.4. Key Developments
10.9.5. SWOT Analysis
10.9.6. Key Strategies
10.10. FZ Organic Food
10.10.1. Company Overview
10.10.2. Financial Overview
10.10.3. Products Offered
10.10.4. Key Developments
10.10.5. SWOT Analysis
10.10.6. Key Strategies
10.11. Navitas Organics
10.11.1. Company Overview
10.11.2. Financial Overview
10.11.3. Products Offered
10.11.4. Key Developments
10.11.5. SWOT Analysis
10.11.6. Key Strategies
10.12. Saratago Potato Chips LLC
10.12.1. Company Overview
10.12.2. Financial Overview
10.12.3. Products Offered
10.12.4. Key Developments
10.12.5. SWOT Analysis
10.12.6. Key Strategies
10.13. The Good Crisp Company
10.13.1. Company Overview
10.13.2. Financial Overview
10.13.3. Products Offered
10.13.4. Key Developments
10.13.5. SWOT Analysis
10.13.6. Key Strategies
10.14. Mission Foods
10.14.1. Company Overview
10.14.2. Financial Overview
10.14.3. Products Offered
10.14.4. Key Developments
10.14.5. SWOT Analysis
10.14.6. Key Strategies
10.15. Shearer’s Snacks
10.15.1. Company Overview
10.15.2. Financial Overview
10.15.3. Products Offered
10.15.4. Key Developments
10.15.5. SWOT Analysis
10.15.6. Key Strategies
11. APPENDIX
11.1. General Sources & References
11.2. List of Abbreviation
List of Tables
TABLE 1 Global Organic Chips Market, by Region, 2019–2024 (USD Million)
TABLE 2 Global Organic Chips Market, by Source, 2019–2024 (USD Million)
TABLE 3 Global Organic Chips Market, by Distribution Channel, 2019–2024 (USD Million)
TABLE 4 North America: Organic Chips Market, by Country, 2019–2024 (USD Million)
TABLE 5 North America: Organic Chips Market, by Source, 2019–2024 (USD Million)
TABLE 6 North America: Organic Chips Market, by Distribution Channel, 2019–2024 (USD Million)
TABLE 7 US: Organic Chips Market, by Source, 2019–2024 (USD Million)
TABLE 8 US: Organic Chips Market, by Distribution Channel, 2019–2024 (USD Million)
TABLE 9 Canada: Organic Chips Market, by Source, 2019–2024 (USD Million)
TABLE 10 Canada: Organic Chips Market, by Distribution Channel, 2019–2024 (USD Million)
TABLE 11 Mexico: Organic Chips Market, by Source, 2019–2024 (USD Million)
TABLE 12 Mexico: Organic Chips Market, by Distribution Channel, 2019–2024 (USD Million)
TABLE 13 Europe: Organic Chips Market, by Country, 2019–2024 (USD Million)
TABLE 14 Europe: Organic Chips Market, by Source, 2019–2024 (USD Million)
TABLE 15 Europe: Organic Chips Market, by Distribution Channel, 2019–2024 (USD Million)
TABLE 16 Germany: Organic Chips Market, by Source, 2019–2024 (USD Million)
TABLE 17 Germany: Organic Chips Market, by Distribution Channel, 2019–2024 (USD Million)
TABLE 18 France: Organic Chips Market, by Source, 2019–2024 (USD Million)
TABLE 19 France: Organic Chips Market, by Distribution Channel, 2019–2024 (USD Million)
TABLE 20 Italy: Organic Chips Market, by Source, 2019–2024 (USD Million)
TABLE 21 Italy: Organic Chips Market, by Distribution Channel, 2019–2024 (USD Million)
TABLE 22 Spain: Organic Chips Market, by Source, 2019–2024 (USD Million)
TABLE 23 Spain: Organic Chips Market, by Distribution Channel, 2019–2024 (USD Million)
TABLE 24 UK: Organic Chips Market, by Source, 2019–2024 (USD Million)
TABLE 25 UK: Organic Chips Market, by Distribution Channel, 2019–2024 (USD Million)
TABLE 26 Rest of Europe: Organic Chips Market, by Source, 2019–2024 (USD Million)
TABLE 27 Rest of Europe: Organic Chips Market, by Distribution Channel, 2019–2024 (USD Million)
TABLE 28 Asia-Pacific: Organic Chips Market, by Country, 2019–2024 (USD Million)
TABLE 29 Asia-Pacific: Organic Chips Market, by Source, 2019–2024 (USD Million)
TABLE 30 Asia-Pacific: Organic Chips Market, by Distribution Channel, 2019–2024 (USD Million)
TABLE 31 China: Organic Chips Market, by Source, 2019–2024 (USD Million)
TABLE 32 China: Organic Chips Market, by Distribution Channel, 2019–2024 (USD Million)
TABLE 33 India: Organic Chips Market, by Source, 2019–2024 (USD Million)
TABLE 34 India: Organic Chips Market, by Distribution Channel, 2019–2024 (USD Million)
TABLE 35 Japan: Organic Chips Market, by Source, 2019–2024 (USD Million)
TABLE 36 Japan: Organic Chips Market, by Distribution Channel, 2019–2024 (USD Million)
TABLE 37 Australia & New Zealand: Organic Chips Market, by Source, 2019–2024 (USD Million)
TABLE 38 Australia & New Zealand: Organic Chips Market, by Distribution Channel, 2019–2024 (USD Million)
TABLE 39 Rest of Asia-Pacific: Organic Chips Market, by Source, 2019–2024 (USD Million)
TABLE 40 Rest of Asia-Pacific: Organic Chips Market, by Distribution Channel, 2019–2024 (USD Million)
TABLE 41 Rest of the World (RoW): Organic Chips Market, by Country, 2019–2024 (USD Million)
TABLE 42 Rest of the World (RoW): Organic Chips Market, by Source, 2019–2024 (USD Million)
TABLE 43 Rest of the World (RoW): Organic Chips Market, by Distribution Channel, 2019–2024 (USD Million)
TABLE 44 South America: Organic Chips Market, by Source, 2019–2024 (USD Million)
TABLE 45 South America: Organic Chips Market, by Distribution Channel, 2019–2024 (USD Million)
TABLE 46 Middle East: Organic Chips Market, by Source, 2019–2024 (USD Million)
TABLE 47 Middle East: Organic Chips Market, by Distribution Channel, 2019–2024 (USD Million)
TABLE 48 Africa: Organic Chips Market, by Source, 2019–2024 (USD Million)
TABLE 49 Africa: Organic Chips Market, by Distribution Channel, 2019–2024 (USD Million)
LIST OF FIGURES
FIGURE 1 Global Organic Chips Market Segmentation
FIGURE 2 Forecast Research Methodology
FIGURE 3 Five Forces Analysis of the Global Organic Chips Market
FIGURE 4 Value Chain of the Global Organic Chips Market
FIGURE 5 Share of the Global Organic Chips Market in 2018, by Country (%)
FIGURE 6 Global Organic Chips Market, by Region, 2019–2024,
FIGURE 7 Global Organic Chips Market Size, by Source, 2018
FIGURE 8 Share of the Global Organic Chips Market, by Source, 2019–2024 (%)
FIGURE 9 Global Organic Chips Market Size, by Distribution Channel, 2018
FIGURE 10 Share of the Global Organic Chips Market, by Distribution Channel, 2019–2024 (%)