Request Free Sample ×

Kindly complete the form below to receive a free sample of this Report

* Please use a valid business email

Leading companies partner with us for data-driven Insights

clients tt-cursor
Hero Background
English
Chinese
French
Japanese
Korean
German
Spanish

Operational Amplifier Market Size

ID: MRFR/SEM/4568-HCR
100 Pages
Ankit Gupta
April 2026

Operational Amplifier (OP-AMP) Market Size, Share and Research Report By Type (General Purpose, High-Precision, Low Noise, Low-Power and Low Voltage Amplifier), By Application (Automatic Control System, Test & Measurement and Vehicle Electronics) And By Region (North America, Europe, Asia-Pacific, And Rest Of The World) –Industry Forecast Till 2035

Share:
Download PDF ×

We do not share your information with anyone. However, we may send you emails based on your report interest from time to time. You may contact us at any time to opt-out.

Operational Amplifier Market Infographic
Purchase Options

Operational Amplifier Size

Market Size Snapshot
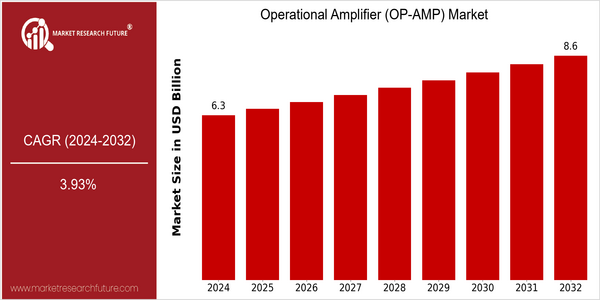
Year Value
2024 USD 6.3327 Billion
2032 USD 8.619 Billion
CAGR (2024-2032) 3.93 %

Note – Market size depicts the revenue generated over the financial year

OP-AMPS OP-AMPS OP-AMPS are a type of operational amplifier, and the market for these is estimated to grow steadily from $6.3 billion in 2024 to $8.5 billion by 2032. This represents a CAGR of 3.93%. In general, the demand for OP-AMPS is growing in a number of fields, such as in the field of digital communications, in the field of industrial automation, and in the field of home appliances. In addition, as the level of sophistication of integrated circuits increases, the OP-AMPS are more and more incorporated in the complex equipment. Among the most important factors for this growth are the rapid spread of IoT devices, which require the ability to process signals, and the automation of the process of manufacturing. Moreover, the development of OP-AMPS that are low-power and high-speed is expected to further increase their application. Major players in the OP-AMP market, such as TI, Analog Devices, and STMicroelectronics, are actively involved in strategic initiatives such as forming a partnership and launching a product to strengthen their market position and respond to the changing needs of consumers. These efforts are expected to have a major impact on the future growth of the market.

home-ubuntu-www-mrf_ne_design-batch-5-cp-op-amp-market size

Regional Market Size

Regional Deep Dive

Operational Amplifier (OP-AMP) Market is growing significantly across the globe, driven by technological advancements and increasing demand for electronic devices. In North America, the market is characterized by the presence of a strong player base and a robust manufacturing landscape. In Europe, innovations in the automotive and industrial applications are driving the market growth. Asia-Pacific is growing rapidly owing to the proliferation of smart devices and consumer electronics. The Middle East and Africa are slowly embracing the technology in the telecommunications and energy sectors. Latin America, though a small market, is showing tremendous growth potential, with industries in the region modernizing and investing in the component industry.

Europe

  • Europe is witnessing a surge in the adoption of OP-AMPs in automotive applications, particularly with the rise of electric vehicles, as companies like STMicroelectronics and Infineon Technologies develop specialized components for these markets.
  • The European Union's stringent regulations on electronic waste and energy consumption are pushing manufacturers to innovate and create more efficient OP-AMP solutions, fostering a competitive environment for technological advancements.

Asia Pacific

  • The Asia-Pacific region is the largest consumer of OP-AMPs, driven by the booming consumer electronics market, with companies like NXP Semiconductors and ON Semiconductor leading the charge in product development.
  • Government initiatives in countries like China and India to promote smart manufacturing and the Internet of Things (IoT) are significantly boosting the demand for OP-AMPs, as these technologies require advanced electronic components.

Latin America

  • Latin America is gradually embracing OP-AMP technology, with local manufacturers beginning to invest in modernizing their production capabilities to meet the growing demand for electronic components.
  • The region's economic recovery post-pandemic is leading to increased investments in technology and infrastructure, which is expected to drive the adoption of OP-AMPs in various sectors.

North America

  • The North American OP-AMP market is heavily influenced by the presence of major semiconductor companies such as Texas Instruments and Analog Devices, which are continuously innovating to enhance performance and reduce power consumption.
  • Recent regulatory changes aimed at promoting energy efficiency in electronic devices are driving demand for low-power OP-AMPs, aligning with the growing trend of sustainable technology in the region.

Middle East And Africa

  • In the Middle East and Africa, the OP-AMP market is being shaped by increasing investments in telecommunications infrastructure, with companies like STMicroelectronics expanding their operations to cater to this demand.
  • The region's focus on renewable energy projects is also creating opportunities for OP-AMP applications in energy management systems, as governments seek to diversify their energy sources.

Did You Know?

“Did you know that the first operational amplifier was invented in 1967 and was primarily used in analog computers? Today, OP-AMPs are integral to a wide range of applications, from audio equipment to medical devices.” — IEEE Spectrum

Segmental Market Size

Operational amplifiers (OP-AMPS) play a critical role in the market. They are the basic building blocks of all analog circuits. This market is currently experiencing a steady growth, mainly driven by increased demand from the areas of consumer electronics, automotive, and industrial automation. There are several reasons for this: the increasing demand for signal processing and the miniaturization of the equipment, which requires ever smaller and more efficient OP-AMPS. OP-AMPS are a mature technology, and the leaders, such as TI and Analog Devices, are in the process of developing new products and expanding their markets. These OP-AMPS are used in many applications, including in audio equipment, medical equipment, and sensors, where high accuracy and reliability are required. In addition, the trend towards smart technology and the integration of the Internet of Things, as well as the drive towards energy efficiency, will lead to a further increase in the market. OP-AMPS are evolving with the help of CMOS and BiCMOS technology. These OP-AMPS are becoming more and more powerful and their applications in next-generation equipment are expanding.

Future Outlook

Operational Amplifiers (OP-AMP) Market will be growing steadily from 2024 to 2032. The market is expected to rise from about $6.33 billion to $8.62 billion, at a compound annual growth rate (CAGR) of 3.93%. This is mainly due to the growing demand for OP-AMPs in various applications, such as consumer electronics, automotive systems and industrial automation. By 2032, the penetration rate of OP-AMPs into the Internet of Things (IoT) and smart sensors will exceed 60%. The miniaturization of electronic components and the complexity of the circuits will lead to a further increase in the demand for high-performance OP-AMPs. The trend towards energy efficiency and the growing importance of sustainable development in the electronics industry will also lead to innovation in OP-AMP design, resulting in the development of low-power and high-precision OP-AMPs. Artificial intelligence and machine learning are emerging trends that will also drive the OP-AMP market, as these applications require high-precision signal processing. The OP-AMP market will evolve significantly as a result of technological development and the diversification of applications. It will become a critical component in the future of the system.

Operational Amplifier Market Size Graph
Author
Author Profile
Ankit Gupta
Team Lead - Research

Ankit Gupta is a seasoned market intelligence and strategic research professional with over six plus years of experience in the ICT and Semiconductor industries. With academic roots in Telecom, Marketing, and Electronics, he blends technical insight with business strategy. Ankit has led 200+ projects, including work for Fortune 500 clients like Microsoft and Rio Tinto, covering market sizing, tech forecasting, and go-to-market strategies. Known for bridging engineering and enterprise decision-making, his insights support growth, innovation, and investment planning across diverse technology markets.

Leave a Comment

FAQs

What is the projected market valuation for the Operational Amplifier (OP-AMP) Market in 2035?

<p>The projected market valuation for the Operational Amplifier (OP-AMP) Market in 2035 is 9.679 USD Billion.</p>

What was the market valuation of the Operational Amplifier (OP-AMP) Market in 2024?

<p>The market valuation of the Operational Amplifier (OP-AMP) Market in 2024 was 6.333 USD Billion.</p>

What is the expected CAGR for the Operational Amplifier (OP-AMP) Market from 2025 to 2035?

<p>The expected CAGR for the Operational Amplifier (OP-AMP) Market during the forecast period 2025 - 2035 is 3.93%.</p>

Which companies are considered key players in the Operational Amplifier (OP-AMP) Market?

<p>Key players in the Operational Amplifier (OP-AMP) Market include Texas Instruments, Analog Devices, STMicroelectronics, and others.</p>

What segment of the Operational Amplifier (OP-AMP) Market had the highest valuation in 2024?

<p>The General Purpose segment of the Operational Amplifier (OP-AMP) Market had the highest valuation in 2024 at 2.5 USD Billion.</p>

How much is the Low Noise segment projected to grow by 2035?

<p>The Low Noise segment is projected to grow from 1.0 USD Billion in 2024 to 1.5 USD Billion by 2035.</p>

What application segment is expected to show significant growth in the Operational Amplifier (OP-AMP) Market?

The Automatic Control System application segment is expected to grow from 2.5 USD Billion in 2024 to 3.8 USD Billion by 2035.

What is the projected valuation for the Vehicle Electronics application segment by 2035?

The Vehicle Electronics application segment is projected to reach 3.149 USD Billion by 2035.

What was the valuation of the High-Precision segment in 2024?

The High-Precision segment was valued at 1.5 USD Billion in 2024.

How does the projected growth of the Operational Amplifier (OP-AMP) Market compare to its 2024 valuation?

The Operational Amplifier (OP-AMP) Market is expected to grow from 6.333 USD Billion in 2024 to 9.679 USD Billion by 2035.

Market Summary

As per Market Research Future analysis, the Operational Amplifier Market (OP-AMP) Market Size was estimated at 6.333 USD Billion in 2024. The OP-AMP industry is projected to grow from 6.582 USD Billion in 2025 to 9.679 USD Billion by 2035, exhibiting a compound annual growth rate (CAGR) of 3.93% during the forecast period 2025 - 2035

Key Market Trends & Highlights

The Operational Amplifier Market (OP-AMP) Market is poised for substantial growth driven by technological advancements and increasing applications across various sectors.

  • North America remains the largest market for operational amplifiers, driven by robust demand in consumer electronics and automotive applications. The Asia-Pacific region is currently the fastest-growing market, fueled by the rapid adoption of IoT devices and advancements in medical technology. The General Purpose segment continues to dominate the market, while the High-Precision segment is experiencing the fastest growth due to rising accuracy requirements. Key market drivers include the increasing demand in consumer electronics and the growth in automotive applications, particularly in vehicle electronics.

Market Size & Forecast

2024 Market Size 6.333 (USD Billion)
2035 Market Size 9.679 (USD Billion)
CAGR (2025 - 2035) 3.93%
Largest Regional Market Share in 2024 North America

Major Players

Texas Instruments (US), Analog Devices (US), STMicroelectronics (FR), Maxim Integrated (US), Infineon Technologies (DE), NXP Semiconductors (NL), ON Semiconductor (US), Microchip Technology (US), Renesas Electronics (JP)

Market Trends

The Operational Amplifier Market (OP-AMP) Market is currently experiencing a dynamic evolution, driven by advancements in technology and increasing demand across various sectors. The integration of OP-AMPs in consumer electronics, automotive applications, and industrial automation is becoming more pronounced. This trend suggests a growing reliance on these components for signal processing, amplification, and filtering tasks. As industries continue to innovate, the need for high-performance OP-AMPs that offer improved efficiency and reliability is likely to rise. Furthermore, the shift towards miniaturization in electronic devices may lead to the development of smaller, more efficient OP-AMP solutions, catering to the compact designs of modern technology. In addition, the Operational Amplifier Market (OP-AMP) Market appears to be influenced by the increasing focus on sustainability and energy efficiency. Manufacturers are exploring eco-friendly materials and production methods, which may enhance the appeal of OP-AMPs in environmentally conscious markets. The ongoing research and development efforts in this field indicate a potential for new applications and enhanced functionalities, which could further stimulate market growth. Overall, the Operational Amplifier Market (OP-AMP) Market is poised for continued expansion, driven by technological advancements and evolving consumer preferences.

Technological Advancements

The Operational Amplifier Market (OP-AMP) Market is witnessing rapid technological advancements, particularly in the areas of performance and integration. New designs are emerging that enhance speed, bandwidth, and power efficiency, making OP-AMPs more suitable for demanding applications. This trend indicates a shift towards more sophisticated electronic systems that require high-quality signal processing.

Miniaturization Trends

The trend towards miniaturization in electronic devices is significantly impacting the Operational Amplifier Market (OP-AMP) Market. As manufacturers strive to create smaller and more compact products, the demand for miniature OP-AMPs is likely to increase. This shift may lead to innovations in design and packaging, allowing for greater functionality in limited spaces.

Sustainability Initiatives

Sustainability initiatives are becoming increasingly relevant within the Operational Amplifier Market (OP-AMP) Market. Manufacturers are exploring eco-friendly materials and production processes to meet the growing demand for environmentally responsible products. This focus on sustainability may not only enhance brand reputation but also attract a new segment of environmentally conscious consumers.

Operational Amplifier Market Market Drivers

Emergence of IoT Devices

The Operational Amplifier Market (OP-AMP) Market is poised for growth due to the emergence of Internet of Things (IoT) devices. As IoT technology continues to evolve, the demand for efficient and reliable OP-AMPs is likely to increase. These components are essential for signal amplification and processing in various IoT applications, including smart home devices, industrial automation, and healthcare monitoring systems. Market forecasts suggest that the IoT market could reach a valuation of over 1 trillion dollars by 2025, which may drive the need for advanced OP-AMP solutions. This trend indicates that manufacturers will need to innovate and adapt their OP-AMP offerings to cater to the specific requirements of IoT applications, thereby shaping the future of the market.

Growth in Automotive Applications

The Operational Amplifier Market (OP-AMP) Market is significantly influenced by the expansion of automotive applications. With the automotive sector increasingly adopting advanced driver-assistance systems (ADAS) and electric vehicles (EVs), the demand for OP-AMPs is expected to rise. These components play a crucial role in various automotive functions, including sensor signal conditioning, motor control, and battery management systems. Recent market analyses suggest that the automotive electronics market is anticipated to grow at a CAGR of around 7% in the coming years, which could lead to a substantial increase in OP-AMP utilization. This growth indicates a shift towards more sophisticated electronic systems in vehicles, thereby enhancing the relevance of OP-AMPs in the automotive domain.

Advancements in Medical Technology

The Operational Amplifier Market (OP-AMP) Market is significantly impacted by advancements in medical technology. The healthcare sector is increasingly utilizing OP-AMPs in diagnostic equipment, imaging systems, and patient monitoring devices. These components are crucial for accurate signal processing and amplification in various medical applications. Market Research Future indicate that the medical device market is projected to grow at a CAGR of around 5% in the coming years, which could lead to heightened demand for OP-AMPs. This growth suggests that manufacturers may need to focus on developing specialized OP-AMP solutions that cater to the stringent requirements of medical applications, thereby enhancing their market position.

Increased Focus on Renewable Energy

The Operational Amplifier Market (OP-AMP) Market is also benefiting from the increased focus on renewable energy solutions. As countries strive to transition towards sustainable energy sources, the demand for OP-AMPs in solar inverters, wind turbine controllers, and energy management systems is likely to rise. These components are vital for efficient energy conversion and management, which are essential in renewable energy applications. Recent data indicates that the renewable energy market is expected to grow at a CAGR of approximately 8% over the next decade, suggesting a robust demand for OP-AMPs in this sector. This trend highlights the potential for OP-AMP manufacturers to align their products with the growing emphasis on sustainability and energy efficiency.

Rising Demand in Consumer Electronics

The Operational Amplifier Market (OP-AMP) Market is experiencing a notable surge in demand driven by the proliferation of consumer electronics. As devices such as smartphones, tablets, and wearables become increasingly sophisticated, the need for high-performance OP-AMPs is amplified. These components are integral in signal processing, audio amplification, and sensor interfacing, which are critical functionalities in modern electronics. Market data indicates that the consumer electronics sector is projected to grow at a compound annual growth rate (CAGR) of approximately 6% over the next five years, further propelling the demand for OP-AMPs. This trend suggests that manufacturers are likely to invest in advanced OP-AMP technologies to meet the evolving requirements of consumers, thereby enhancing the overall market landscape.

Market Segment Insights

By Type: General Purpose (Largest) vs. High-Precision (Fastest-Growing)

<p>The Operational Amplifier (OP-AMP) market is primarily dominated by the General Purpose segment, which holds the largest market share. This segment is widely adopted in various applications due to its versatility and cost-effectiveness. Additionally, Low-Noise and Low-Power amplifiers contribute significantly but hold smaller market shares in comparison. The High-Precision segment, while a smaller part of the market, is swiftly gaining ground as advanced applications demand greater accuracy and performance, leading to a shift in preference among manufacturers.</p>

<p>General Purpose (Dominant) vs. High-Precision (Emerging)</p>

<p>The General Purpose operational amplifier is the backbone of numerous electronic circuits, providing essential functionality in signal conditioning and processing. Its appeal lies in its balance of performance and affordability, making it ideal for widespread use in consumer electronics, automotive, and industrial applications. Conversely, High-Precision operational amplifiers are becoming increasingly crucial as sectors like instrumentation and medical devices push for enhanced accuracy and reduced offset errors. These amplifiers cater to specific, high-performance needs and are experiencing rapid development, driven by advances in technology and rising standards in various applications.</p>

By Application: Automatic Control System (Largest) vs. Vehicle Electronics (Fastest-Growing)

<p>In the Operational Amplifier (OP-AMP) Market, the 'Automatic Control System' segment commands a significant share, driven by its widespread application across various industrial domains. These systems extensively utilize OP-AMPs for accurate signal processing, control, and feedback mechanisms, leading to increased market prominence. On the other hand, the 'Vehicle Electronics' segment is rapidly gaining traction due to the rising demand for advanced driver-assistance systems (ADAS) and electric vehicles, which require efficient and precise amplifier solutions to enhance performance and safety features.</p>

<p>Automatic Control System (Dominant) vs. Vehicle Electronics (Emerging)</p>

<p>The 'Automatic Control System' segment is characterized by its stable demand across automation and manufacturing sectors, where OP-AMPs play a crucial role in enhancing system efficiency and reliability. This dominance is largely attributed to the maturity of control systems in industrial applications, ensuring a consistent requirement for operational amplifiers. In contrast, the 'Vehicle Electronics' segment represents an emerging area driven by continuous innovations in automotive technology. With the advent of smarter vehicles, the need for high-performance OP-AMPs in applications ranging from infotainment to crucial safety systems is rising, positioning this segment for significant growth as automotive electronics become more sophisticated.</p>

Get more detailed insights about Operational Amplifier (OP-AMP) Market Research Report – Forecast to 2035

Regional Insights

North America : Innovation and Demand Surge

North America is the largest market for operational amplifiers, holding approximately 40% of the global share. The region's growth is driven by advancements in consumer electronics, automotive applications, and the increasing demand for automation in industrial processes. Regulatory support for technology innovation and investment in research and development further catalyze market expansion. The United States is the dominant player, with major companies like Texas Instruments and Analog Devices leading the competitive landscape. Canada also contributes significantly, focusing on technology integration in various sectors. The presence of key players ensures a robust supply chain and innovation pipeline, making North America a critical hub for OP-AMP technology.

Europe : Regulatory Support and Growth

Europe is the second-largest market for operational amplifiers, accounting for around 30% of the global market share. The region benefits from stringent regulations promoting energy efficiency and sustainability, which drive demand for advanced electronic components. The European Union's initiatives to support technological innovation and reduce carbon footprints are significant growth catalysts. Germany and France are the leading countries in this market, with a strong presence of companies like STMicroelectronics and Infineon Technologies. The competitive landscape is characterized by a mix of established players and innovative startups, fostering a dynamic environment for OP-AMP development. The region's focus on automotive and industrial applications further enhances its market position.

Asia-Pacific : Rapid Growth and Adoption

Asia-Pacific is witnessing rapid growth in the operational amplifier market, holding approximately 25% of the global share. The region's expansion is fueled by increasing consumer electronics demand, automotive advancements, and the rise of smart technologies. Government initiatives to promote electronics manufacturing and innovation are also significant drivers of market growth. China and Japan are the leading countries in this region, with major players like Renesas Electronics and ON Semiconductor contributing to the competitive landscape. The presence of a robust manufacturing base and a growing focus on research and development make Asia-Pacific a vital area for OP-AMP technology. The region's dynamic market is characterized by both established companies and emerging startups, enhancing its competitive edge.

Middle East and Africa : Emerging Market Potential

The Middle East and Africa region is gradually emerging in the operational amplifier market, currently holding about 5% of the global share. The growth is driven by increasing investments in technology and infrastructure, particularly in sectors like telecommunications and renewable energy. Government initiatives aimed at diversifying economies and enhancing technological capabilities are also contributing to market development. Countries like South Africa and the UAE are leading the way, with a growing number of local and international players entering the market. The competitive landscape is evolving, with a focus on partnerships and collaborations to enhance technological offerings. As the region continues to invest in modernization, the demand for operational amplifiers is expected to rise significantly.

Key Players and Competitive Insights

Leading market players are investing heavily in research and development in order to expand their product lines, which will help the operational amplifier (OP-AMP) market, grow even more. Market participants are also undertaking a variety of strategic activities to expand their global footprint, with important market developments including new product launches, contractual agreements, mergers and acquisitions, higher investments, and collaboration with other organizations. To expand and survive in a more competitive and rising market climate, operational amplifier (OP-AMP) industry must offer cost-effective items.Manufacturing locally to minimize operational costs is one of the key business tactics used by manufacturers in the global operational amplifier (OP-AMP) industry to benefit clients and increase the market sector. In recent years, the operational amplifier (OP-AMP) industry has offered some of the most significant advantages to market. Major players in the operational amplifier (OP-AMP) market attempting to increase market demand by investing in research and development operations include Texas Instruments, Inc. (U.S.), STMicroelectronics (Switzerland), ON Semiconductor (U.S.), Analog Devices, Inc. (U.S.), NXP Semiconductors N.V. (The Netherlands), Cirrus Logic, Inc. (U.S.), Maxim Integrated (U.S.), Renesas Electronics (Japan), and Micrel (U.S.).A supplier of integrated analog and mixed-signal semiconductors is Maxim Integrated Products Inc. The company offers charge pumps, wireless, cables, supervisors, voltage radio frequencies (RFs), monitors, amplifiers, comparators, analog switches, sequencers, filters, microcontrollers, memory products, transceivers, switches and multiplexers, as well as voltage references. In addition, it provides solutions for managing power and batteries as well as video, T/E carrier and packetized communications, isolation and protection, real-time clocks, and powerline networking.The designer, producer, and provider of semiconductor goods and services is ON Semiconductor Corp (Onsemi). Power Solutions Group (PSG), Advanced Solutions Group (ASG), and Intelligent Sensing Group (ISG) are the product divisions of the corporation. Customers in the automotive, computer, medical, aerospace and defense, industrial, Internet of things (IoT), communications, 5G & cloud power, wireless, and networking sectors are served by this company. The business offers its goods directly to customers as well as to wholesalers.

Key Companies in the Operational Amplifier Market include

Industry Developments

  • Q1 2024: TI launches OPA2891 and OPA2892 high-speed op-amps at Embedded World 2024 Texas Instruments introduced the OPA2891 and OPA2892 high-speed operational amplifiers at Embedded World 2024, targeting communications and signal processing applications with bandwidths of 180 MHz and up to 2 GHz, supporting ultra-low distortion use cases.

Future Outlook

Operational Amplifier Market Future Outlook

The Operational Amplifier Market (OP-AMP) Market is projected to grow at a 3.93% CAGR from 2025 to 2035, driven by advancements in consumer electronics, automotive applications, and <a href="https://www.marketresearchfuture.com/reports/industrial-automation-spares-market-13908">industrial automation</a>.

New opportunities lie in:

  • Development of high-performance, low-power OP-AMPs for portable devices.</p><p>Expansion into emerging markets with tailored product offerings.</p><p>Integration of OP-AMPs in IoT devices for enhanced connectivity and functionality.

By 2035, the OP-AMP market is expected to achieve robust growth, reflecting evolving technological demands.

Market Segmentation

Operational Amplifier Market Type Outlook

  • General Purpose
  • High-Precision
  • Low Noise
  • Low-Power
  • Low Voltage Amplifier

Operational Amplifier Market Application Outlook

  • Automatic Control System
  • Test & Measurement
  • Vehicle Electronics

Report Scope

MARKET SIZE 2024 6.333(USD Billion)
MARKET SIZE 2025 6.582(USD Billion)
MARKET SIZE 2035 9.679(USD Billion)
COMPOUND ANNUAL GROWTH RATE (CAGR) 3.93% (2025 - 2035)
REPORT COVERAGE Revenue Forecast, Competitive Landscape, Growth Factors, and Trends
BASE YEAR 2024
Market Forecast Period 2025 - 2035
Historical Data 2019 - 2024
Market Forecast Units USD Billion
Key Companies Profiled Texas Instruments (US), Analog Devices (US), STMicroelectronics (FR), Maxim Integrated (US), Infineon Technologies (DE), NXP Semiconductors (NL), ON Semiconductor (US), Microchip Technology (US), Renesas Electronics (JP)
Segments Covered Type, Application, Region
Key Market Opportunities Integration of Operational Amplifier (OP-AMP) technology in advanced automotive and industrial applications.
Key Market Dynamics Technological advancements and increasing demand for miniaturization drive innovation in the Operational Amplifier market.
Countries Covered North America, Europe, APAC, South America, MEA

FAQs

What is the projected market valuation for the Operational Amplifier (OP-AMP) Market in 2035?

<p>The projected market valuation for the Operational Amplifier (OP-AMP) Market in 2035 is 9.679 USD Billion.</p>

What was the market valuation of the Operational Amplifier (OP-AMP) Market in 2024?

<p>The market valuation of the Operational Amplifier (OP-AMP) Market in 2024 was 6.333 USD Billion.</p>

What is the expected CAGR for the Operational Amplifier (OP-AMP) Market from 2025 to 2035?

<p>The expected CAGR for the Operational Amplifier (OP-AMP) Market during the forecast period 2025 - 2035 is 3.93%.</p>

Which companies are considered key players in the Operational Amplifier (OP-AMP) Market?

<p>Key players in the Operational Amplifier (OP-AMP) Market include Texas Instruments, Analog Devices, STMicroelectronics, and others.</p>

What segment of the Operational Amplifier (OP-AMP) Market had the highest valuation in 2024?

<p>The General Purpose segment of the Operational Amplifier (OP-AMP) Market had the highest valuation in 2024 at 2.5 USD Billion.</p>

How much is the Low Noise segment projected to grow by 2035?

<p>The Low Noise segment is projected to grow from 1.0 USD Billion in 2024 to 1.5 USD Billion by 2035.</p>

What application segment is expected to show significant growth in the Operational Amplifier (OP-AMP) Market?

The Automatic Control System application segment is expected to grow from 2.5 USD Billion in 2024 to 3.8 USD Billion by 2035.

What is the projected valuation for the Vehicle Electronics application segment by 2035?

The Vehicle Electronics application segment is projected to reach 3.149 USD Billion by 2035.

What was the valuation of the High-Precision segment in 2024?

The High-Precision segment was valued at 1.5 USD Billion in 2024.

How does the projected growth of the Operational Amplifier (OP-AMP) Market compare to its 2024 valuation?

The Operational Amplifier (OP-AMP) Market is expected to grow from 6.333 USD Billion in 2024 to 9.679 USD Billion by 2035.

  1. SECTION I: EXECUTIVE SUMMARY AND KEY HIGHLIGHTS
    1. | 1.1 EXECUTIVE SUMMARY
    2. | | 1.1.1 Market Overview
    3. | | 1.1.2 Key Findings
    4. | | 1.1.3 Market Segmentation
    5. | | 1.1.4 Competitive Landscape
    6. | | 1.1.5 Challenges and Opportunities
    7. | | 1.1.6 Future Outlook
  2. SECTION II: SCOPING, METHODOLOGY AND MARKET STRUCTURE
    1. | 2.1 MARKET INTRODUCTION
    2. | | 2.1.1 Definition
    3. | | 2.1.2 Scope of the study
    4. | | | 2.1.2.1 Research Objective
    5. | | | 2.1.2.2 Assumption
    6. | | | 2.1.2.3 Limitations
    7. | 2.2 RESEARCH METHODOLOGY
    8. | | 2.2.1 Overview
    9. | | 2.2.2 Data Mining
    10. | | 2.2.3 Secondary Research
    11. | | 2.2.4 Primary Research
    12. | | | 2.2.4.1 Primary Interviews and Information Gathering Process
    13. | | | 2.2.4.2 Breakdown of Primary Respondents
    14. | | 2.2.5 Forecasting Model
    15. | | 2.2.6 Market Size Estimation
    16. | | | 2.2.6.1 Bottom-Up Approach
    17. | | | 2.2.6.2 Top-Down Approach
    18. | | 2.2.7 Data Triangulation
    19. | | 2.2.8 Validation
  3. SECTION III: QUALITATIVE ANALYSIS
    1. | 3.1 MARKET DYNAMICS
    2. | | 3.1.1 Overview
    3. | | 3.1.2 Drivers
    4. | | 3.1.3 Restraints
    5. | | 3.1.4 Opportunities
    6. | 3.2 MARKET FACTOR ANALYSIS
    7. | | 3.2.1 Value chain Analysis
    8. | | 3.2.2 Porter's Five Forces Analysis
    9. | | | 3.2.2.1 Bargaining Power of Suppliers
    10. | | | 3.2.2.2 Bargaining Power of Buyers
    11. | | | 3.2.2.3 Threat of New Entrants
    12. | | | 3.2.2.4 Threat of Substitutes
    13. | | | 3.2.2.5 Intensity of Rivalry
    14. | | 3.2.3 COVID-19 Impact Analysis
    15. | | | 3.2.3.1 Market Impact Analysis
    16. | | | 3.2.3.2 Regional Impact
    17. | | | 3.2.3.3 Opportunity and Threat Analysis
  4. SECTION IV: QUANTITATIVE ANALYSIS
    1. | 4.1 Semiconductor & Electronics, BY Type (USD Billion)
    2. | | 4.1.1 General Purpose
    3. | | 4.1.2 High-Precision
    4. | | 4.1.3 Low Noise
    5. | | 4.1.4 Low-Power
    6. | | 4.1.5 Low Voltage Amplifier
    7. | 4.2 Semiconductor & Electronics, BY Application (USD Billion)
    8. | | 4.2.1 Automatic Control System
    9. | | 4.2.2 Test & Measurement
    10. | | 4.2.3 Vehicle Electronics
    11. | 4.3 Semiconductor & Electronics, BY Region (USD Billion)
    12. | | 4.3.1 North America
    13. | | | 4.3.1.1 US
    14. | | | 4.3.1.2 Canada
    15. | | 4.3.2 Europe
    16. | | | 4.3.2.1 Germany
    17. | | | 4.3.2.2 UK
    18. | | | 4.3.2.3 France
    19. | | | 4.3.2.4 Russia
    20. | | | 4.3.2.5 Italy
    21. | | | 4.3.2.6 Spain
    22. | | | 4.3.2.7 Rest of Europe
    23. | | 4.3.3 APAC
    24. | | | 4.3.3.1 China
    25. | | | 4.3.3.2 India
    26. | | | 4.3.3.3 Japan
    27. | | | 4.3.3.4 South Korea
    28. | | | 4.3.3.5 Malaysia
    29. | | | 4.3.3.6 Thailand
    30. | | | 4.3.3.7 Indonesia
    31. | | | 4.3.3.8 Rest of APAC
    32. | | 4.3.4 South America
    33. | | | 4.3.4.1 Brazil
    34. | | | 4.3.4.2 Mexico
    35. | | | 4.3.4.3 Argentina
    36. | | | 4.3.4.4 Rest of South America
    37. | | 4.3.5 MEA
    38. | | | 4.3.5.1 GCC Countries
    39. | | | 4.3.5.2 South Africa
    40. | | | 4.3.5.3 Rest of MEA
  5. SECTION V: COMPETITIVE ANALYSIS
    1. | 5.1 Competitive Landscape
    2. | | 5.1.1 Overview
    3. | | 5.1.2 Competitive Analysis
    4. | | 5.1.3 Market share Analysis
    5. | | 5.1.4 Major Growth Strategy in the Semiconductor & Electronics
    6. | | 5.1.5 Competitive Benchmarking
    7. | | 5.1.6 Leading Players in Terms of Number of Developments in the Semiconductor & Electronics
    8. | | 5.1.7 Key developments and growth strategies
    9. | | | 5.1.7.1 New Product Launch/Service Deployment
    10. | | | 5.1.7.2 Merger & Acquisitions
    11. | | | 5.1.7.3 Joint Ventures
    12. | | 5.1.8 Major Players Financial Matrix
    13. | | | 5.1.8.1 Sales and Operating Income
    14. | | | 5.1.8.2 Major Players R&D Expenditure. 2023
    15. | 5.2 Company Profiles
    16. | | 5.2.1 Texas Instruments (US)
    17. | | | 5.2.1.1 Financial Overview
    18. | | | 5.2.1.2 Products Offered
    19. | | | 5.2.1.3 Key Developments
    20. | | | 5.2.1.4 SWOT Analysis
    21. | | | 5.2.1.5 Key Strategies
    22. | | 5.2.2 Analog Devices (US)
    23. | | | 5.2.2.1 Financial Overview
    24. | | | 5.2.2.2 Products Offered
    25. | | | 5.2.2.3 Key Developments
    26. | | | 5.2.2.4 SWOT Analysis
    27. | | | 5.2.2.5 Key Strategies
    28. | | 5.2.3 STMicroelectronics (FR)
    29. | | | 5.2.3.1 Financial Overview
    30. | | | 5.2.3.2 Products Offered
    31. | | | 5.2.3.3 Key Developments
    32. | | | 5.2.3.4 SWOT Analysis
    33. | | | 5.2.3.5 Key Strategies
    34. | | 5.2.4 Maxim Integrated (US)
    35. | | | 5.2.4.1 Financial Overview
    36. | | | 5.2.4.2 Products Offered
    37. | | | 5.2.4.3 Key Developments
    38. | | | 5.2.4.4 SWOT Analysis
    39. | | | 5.2.4.5 Key Strategies
    40. | | 5.2.5 Infineon Technologies (DE)
    41. | | | 5.2.5.1 Financial Overview
    42. | | | 5.2.5.2 Products Offered
    43. | | | 5.2.5.3 Key Developments
    44. | | | 5.2.5.4 SWOT Analysis
    45. | | | 5.2.5.5 Key Strategies
    46. | | 5.2.6 NXP Semiconductors (NL)
    47. | | | 5.2.6.1 Financial Overview
    48. | | | 5.2.6.2 Products Offered
    49. | | | 5.2.6.3 Key Developments
    50. | | | 5.2.6.4 SWOT Analysis
    51. | | | 5.2.6.5 Key Strategies
    52. | | 5.2.7 ON Semiconductor (US)
    53. | | | 5.2.7.1 Financial Overview
    54. | | | 5.2.7.2 Products Offered
    55. | | | 5.2.7.3 Key Developments
    56. | | | 5.2.7.4 SWOT Analysis
    57. | | | 5.2.7.5 Key Strategies
    58. | | 5.2.8 Microchip Technology (US)
    59. | | | 5.2.8.1 Financial Overview
    60. | | | 5.2.8.2 Products Offered
    61. | | | 5.2.8.3 Key Developments
    62. | | | 5.2.8.4 SWOT Analysis
    63. | | | 5.2.8.5 Key Strategies
    64. | | 5.2.9 Renesas Electronics (JP)
    65. | | | 5.2.9.1 Financial Overview
    66. | | | 5.2.9.2 Products Offered
    67. | | | 5.2.9.3 Key Developments
    68. | | | 5.2.9.4 SWOT Analysis
    69. | | | 5.2.9.5 Key Strategies
    70. | 5.3 Appendix
    71. | | 5.3.1 References
    72. | | 5.3.2 Related Reports
  6. LIST OF FIGURES
    1. | 6.1 MARKET SYNOPSIS
    2. | 6.2 NORTH AMERICA MARKET ANALYSIS
    3. | 6.3 US MARKET ANALYSIS BY TYPE
    4. | 6.4 US MARKET ANALYSIS BY APPLICATION
    5. | 6.5 CANADA MARKET ANALYSIS BY TYPE
    6. | 6.6 CANADA MARKET ANALYSIS BY APPLICATION
    7. | 6.7 EUROPE MARKET ANALYSIS
    8. | 6.8 GERMANY MARKET ANALYSIS BY TYPE
    9. | 6.9 GERMANY MARKET ANALYSIS BY APPLICATION
    10. | 6.10 UK MARKET ANALYSIS BY TYPE
    11. | 6.11 UK MARKET ANALYSIS BY APPLICATION
    12. | 6.12 FRANCE MARKET ANALYSIS BY TYPE
    13. | 6.13 FRANCE MARKET ANALYSIS BY APPLICATION
    14. | 6.14 RUSSIA MARKET ANALYSIS BY TYPE
    15. | 6.15 RUSSIA MARKET ANALYSIS BY APPLICATION
    16. | 6.16 ITALY MARKET ANALYSIS BY TYPE
    17. | 6.17 ITALY MARKET ANALYSIS BY APPLICATION
    18. | 6.18 SPAIN MARKET ANALYSIS BY TYPE
    19. | 6.19 SPAIN MARKET ANALYSIS BY APPLICATION
    20. | 6.20 REST OF EUROPE MARKET ANALYSIS BY TYPE
    21. | 6.21 REST OF EUROPE MARKET ANALYSIS BY APPLICATION
    22. | 6.22 APAC MARKET ANALYSIS
    23. | 6.23 CHINA MARKET ANALYSIS BY TYPE
    24. | 6.24 CHINA MARKET ANALYSIS BY APPLICATION
    25. | 6.25 INDIA MARKET ANALYSIS BY TYPE
    26. | 6.26 INDIA MARKET ANALYSIS BY APPLICATION
    27. | 6.27 JAPAN MARKET ANALYSIS BY TYPE
    28. | 6.28 JAPAN MARKET ANALYSIS BY APPLICATION
    29. | 6.29 SOUTH KOREA MARKET ANALYSIS BY TYPE
    30. | 6.30 SOUTH KOREA MARKET ANALYSIS BY APPLICATION
    31. | 6.31 MALAYSIA MARKET ANALYSIS BY TYPE
    32. | 6.32 MALAYSIA MARKET ANALYSIS BY APPLICATION
    33. | 6.33 THAILAND MARKET ANALYSIS BY TYPE
    34. | 6.34 THAILAND MARKET ANALYSIS BY APPLICATION
    35. | 6.35 INDONESIA MARKET ANALYSIS BY TYPE
    36. | 6.36 INDONESIA MARKET ANALYSIS BY APPLICATION
    37. | 6.37 REST OF APAC MARKET ANALYSIS BY TYPE
    38. | 6.38 REST OF APAC MARKET ANALYSIS BY APPLICATION
    39. | 6.39 SOUTH AMERICA MARKET ANALYSIS
    40. | 6.40 BRAZIL MARKET ANALYSIS BY TYPE
    41. | 6.41 BRAZIL MARKET ANALYSIS BY APPLICATION
    42. | 6.42 MEXICO MARKET ANALYSIS BY TYPE
    43. | 6.43 MEXICO MARKET ANALYSIS BY APPLICATION
    44. | 6.44 ARGENTINA MARKET ANALYSIS BY TYPE
    45. | 6.45 ARGENTINA MARKET ANALYSIS BY APPLICATION
    46. | 6.46 REST OF SOUTH AMERICA MARKET ANALYSIS BY TYPE
    47. | 6.47 REST OF SOUTH AMERICA MARKET ANALYSIS BY APPLICATION
    48. | 6.48 MEA MARKET ANALYSIS
    49. | 6.49 GCC COUNTRIES MARKET ANALYSIS BY TYPE
    50. | 6.50 GCC COUNTRIES MARKET ANALYSIS BY APPLICATION
    51. | 6.51 SOUTH AFRICA MARKET ANALYSIS BY TYPE
    52. | 6.52 SOUTH AFRICA MARKET ANALYSIS BY APPLICATION
    53. | 6.53 REST OF MEA MARKET ANALYSIS BY TYPE
    54. | 6.54 REST OF MEA MARKET ANALYSIS BY APPLICATION
    55. | 6.55 KEY BUYING CRITERIA OF SEMICONDUCTOR & ELECTRONICS
    56. | 6.56 RESEARCH PROCESS OF MRFR
    57. | 6.57 DRO ANALYSIS OF SEMICONDUCTOR & ELECTRONICS
    58. | 6.58 DRIVERS IMPACT ANALYSIS: SEMICONDUCTOR & ELECTRONICS
    59. | 6.59 RESTRAINTS IMPACT ANALYSIS: SEMICONDUCTOR & ELECTRONICS
    60. | 6.60 SUPPLY / VALUE CHAIN: SEMICONDUCTOR & ELECTRONICS
    61. | 6.61 SEMICONDUCTOR & ELECTRONICS, BY TYPE, 2024 (% SHARE)
    62. | 6.62 SEMICONDUCTOR & ELECTRONICS, BY TYPE, 2024 TO 2035 (USD Billion)
    63. | 6.63 SEMICONDUCTOR & ELECTRONICS, BY APPLICATION, 2024 (% SHARE)
    64. | 6.64 SEMICONDUCTOR & ELECTRONICS, BY APPLICATION, 2024 TO 2035 (USD Billion)
    65. | 6.65 BENCHMARKING OF MAJOR COMPETITORS
  7. LIST OF TABLES
    1. | 7.1 LIST OF ASSUMPTIONS
    2. | | 7.1.1
    3. | 7.2 North America MARKET SIZE ESTIMATES; FORECAST
    4. | | 7.2.1 BY TYPE, 2025-2035 (USD Billion)
    5. | | 7.2.2 BY APPLICATION, 2025-2035 (USD Billion)
    6. | 7.3 US MARKET SIZE ESTIMATES; FORECAST
    7. | | 7.3.1 BY TYPE, 2025-2035 (USD Billion)
    8. | | 7.3.2 BY APPLICATION, 2025-2035 (USD Billion)
    9. | 7.4 Canada MARKET SIZE ESTIMATES; FORECAST
    10. | | 7.4.1 BY TYPE, 2025-2035 (USD Billion)
    11. | | 7.4.2 BY APPLICATION, 2025-2035 (USD Billion)
    12. | 7.5 Europe MARKET SIZE ESTIMATES; FORECAST
    13. | | 7.5.1 BY TYPE, 2025-2035 (USD Billion)
    14. | | 7.5.2 BY APPLICATION, 2025-2035 (USD Billion)
    15. | 7.6 Germany MARKET SIZE ESTIMATES; FORECAST
    16. | | 7.6.1 BY TYPE, 2025-2035 (USD Billion)
    17. | | 7.6.2 BY APPLICATION, 2025-2035 (USD Billion)
    18. | 7.7 UK MARKET SIZE ESTIMATES; FORECAST
    19. | | 7.7.1 BY TYPE, 2025-2035 (USD Billion)
    20. | | 7.7.2 BY APPLICATION, 2025-2035 (USD Billion)
    21. | 7.8 France MARKET SIZE ESTIMATES; FORECAST
    22. | | 7.8.1 BY TYPE, 2025-2035 (USD Billion)
    23. | | 7.8.2 BY APPLICATION, 2025-2035 (USD Billion)
    24. | 7.9 Russia MARKET SIZE ESTIMATES; FORECAST
    25. | | 7.9.1 BY TYPE, 2025-2035 (USD Billion)
    26. | | 7.9.2 BY APPLICATION, 2025-2035 (USD Billion)
    27. | 7.10 Italy MARKET SIZE ESTIMATES; FORECAST
    28. | | 7.10.1 BY TYPE, 2025-2035 (USD Billion)
    29. | | 7.10.2 BY APPLICATION, 2025-2035 (USD Billion)
    30. | 7.11 Spain MARKET SIZE ESTIMATES; FORECAST
    31. | | 7.11.1 BY TYPE, 2025-2035 (USD Billion)
    32. | | 7.11.2 BY APPLICATION, 2025-2035 (USD Billion)
    33. | 7.12 Rest of Europe MARKET SIZE ESTIMATES; FORECAST
    34. | | 7.12.1 BY TYPE, 2025-2035 (USD Billion)
    35. | | 7.12.2 BY APPLICATION, 2025-2035 (USD Billion)
    36. | 7.13 APAC MARKET SIZE ESTIMATES; FORECAST
    37. | | 7.13.1 BY TYPE, 2025-2035 (USD Billion)
    38. | | 7.13.2 BY APPLICATION, 2025-2035 (USD Billion)
    39. | 7.14 China MARKET SIZE ESTIMATES; FORECAST
    40. | | 7.14.1 BY TYPE, 2025-2035 (USD Billion)
    41. | | 7.14.2 BY APPLICATION, 2025-2035 (USD Billion)
    42. | 7.15 India MARKET SIZE ESTIMATES; FORECAST
    43. | | 7.15.1 BY TYPE, 2025-2035 (USD Billion)
    44. | | 7.15.2 BY APPLICATION, 2025-2035 (USD Billion)
    45. | 7.16 Japan MARKET SIZE ESTIMATES; FORECAST
    46. | | 7.16.1 BY TYPE, 2025-2035 (USD Billion)
    47. | | 7.16.2 BY APPLICATION, 2025-2035 (USD Billion)
    48. | 7.17 South Korea MARKET SIZE ESTIMATES; FORECAST
    49. | | 7.17.1 BY TYPE, 2025-2035 (USD Billion)
    50. | | 7.17.2 BY APPLICATION, 2025-2035 (USD Billion)
    51. | 7.18 Malaysia MARKET SIZE ESTIMATES; FORECAST
    52. | | 7.18.1 BY TYPE, 2025-2035 (USD Billion)
    53. | | 7.18.2 BY APPLICATION, 2025-2035 (USD Billion)
    54. | 7.19 Thailand MARKET SIZE ESTIMATES; FORECAST
    55. | | 7.19.1 BY TYPE, 2025-2035 (USD Billion)
    56. | | 7.19.2 BY APPLICATION, 2025-2035 (USD Billion)
    57. | 7.20 Indonesia MARKET SIZE ESTIMATES; FORECAST
    58. | | 7.20.1 BY TYPE, 2025-2035 (USD Billion)
    59. | | 7.20.2 BY APPLICATION, 2025-2035 (USD Billion)
    60. | 7.21 Rest of APAC MARKET SIZE ESTIMATES; FORECAST
    61. | | 7.21.1 BY TYPE, 2025-2035 (USD Billion)
    62. | | 7.21.2 BY APPLICATION, 2025-2035 (USD Billion)
    63. | 7.22 South America MARKET SIZE ESTIMATES; FORECAST
    64. | | 7.22.1 BY TYPE, 2025-2035 (USD Billion)
    65. | | 7.22.2 BY APPLICATION, 2025-2035 (USD Billion)
    66. | 7.23 Brazil MARKET SIZE ESTIMATES; FORECAST
    67. | | 7.23.1 BY TYPE, 2025-2035 (USD Billion)
    68. | | 7.23.2 BY APPLICATION, 2025-2035 (USD Billion)
    69. | 7.24 Mexico MARKET SIZE ESTIMATES; FORECAST
    70. | | 7.24.1 BY TYPE, 2025-2035 (USD Billion)
    71. | | 7.24.2 BY APPLICATION, 2025-2035 (USD Billion)
    72. | 7.25 Argentina MARKET SIZE ESTIMATES; FORECAST
    73. | | 7.25.1 BY TYPE, 2025-2035 (USD Billion)
    74. | | 7.25.2 BY APPLICATION, 2025-2035 (USD Billion)
    75. | 7.26 Rest of South America MARKET SIZE ESTIMATES; FORECAST
    76. | | 7.26.1 BY TYPE, 2025-2035 (USD Billion)
    77. | | 7.26.2 BY APPLICATION, 2025-2035 (USD Billion)
    78. | 7.27 MEA MARKET SIZE ESTIMATES; FORECAST
    79. | | 7.27.1 BY TYPE, 2025-2035 (USD Billion)
    80. | | 7.27.2 BY APPLICATION, 2025-2035 (USD Billion)
    81. | 7.28 GCC Countries MARKET SIZE ESTIMATES; FORECAST
    82. | | 7.28.1 BY TYPE, 2025-2035 (USD Billion)
    83. | | 7.28.2 BY APPLICATION, 2025-2035 (USD Billion)
    84. | 7.29 South Africa MARKET SIZE ESTIMATES; FORECAST
    85. | | 7.29.1 BY TYPE, 2025-2035 (USD Billion)
    86. | | 7.29.2 BY APPLICATION, 2025-2035 (USD Billion)
    87. | 7.30 Rest of MEA MARKET SIZE ESTIMATES; FORECAST
    88. | | 7.30.1 BY TYPE, 2025-2035 (USD Billion)
    89. | | 7.30.2 BY APPLICATION, 2025-2035 (USD Billion)
    90. | 7.31 PRODUCT LAUNCH/PRODUCT DEVELOPMENT/APPROVAL
    91. | | 7.31.1
    92. | 7.32 ACQUISITION/PARTNERSHIP
    93. | | 7.32.1

Semiconductor & Electronics Market Segmentation

Semiconductor & Electronics By Type (USD Billion, 2025-2035)

  • General Purpose
  • High-Precision
  • Low Noise
  • Low-Power
  • Low Voltage Amplifier

Semiconductor & Electronics By Application (USD Billion, 2025-2035)

  • Automatic Control System
  • Test & Measurement
  • Vehicle Electronics
Infographic

Free Sample Request

Kindly complete the form below to receive a free sample of this Report

Get Free Sample

Customer Strories

Compare Licence

×
Features License Type
Single User Multiuser License Enterprise User
Price $4,950 $5,950 $7,250
Maximum User Access Limit 1 User Upto 10 Users Unrestricted Access Throughout the Organization
Free Customization
Direct Access to Analyst
Deliverable Format
Platform Access
Discount on Next Purchase 10% 15% 15%
Printable Versions
%>