ID: MRFR/SEM/2727-CR | August 2018 | Region: Global | 100 Pages
1 Executive Summary
2 Market Introduction
2.1 Definition 14
2.2 Scope of the Study 14
2.3 List of Assumptions 14
2.4 Market Structure 15
3 Market Insights
4 Research Methodology
4.1 Research Process 20
4.2 Primary Research 20
4.3 Secondary Research 21
4.4 Market Size Estimation 22
4.5 Forecast Model 23
5 Market Dynamics
5.1 Introduction 25
5.2 Drivers 25
5.2.1 Rising demand for noise cancellation and data protection in Telecommunication 25
5.2.2 Increasing concerns for patient safety in hospitals and medical institutions 26
5.2.3 Drivers Impact Analysis 26
5.3 Opportunities 27
5.3.1 Wide adoption of isolated amplifier in optical isolation using fiber optic transmission 27
5.4 Challenges 27
5.4.1 High pricing of wide bandwidth 3-port isolation amplifier for various industrial applications 27
6 Market Factor Analysis
6.1 Value Chain Analysis 29
6.1.1 Original Equipment Manufacturers (OEMs) 29
6.1.2 System Integrators/ Assemblers 29
6.1.3 Distributors & Retailers 30
6.1.4 End-Users 30
6.2 Porterβs Five Forces Model 30
6.2.1 Threat of New Entrants 30
6.2.2 Bargaining Power of Suppliers 31
6.2.3 Bargaining Power of Buyers 31
6.2.4 Threat of Substitutes 31
6.2.5 Intensity of Rivalry 31
7 Global Isolation Amplifier Market, By Application
7.1 Overview 33
7.1.1 Medical 33
7.1.1.1 ECG 33
7.1.1.2 EEG 33
7.1.1.3 Others 33
7.1.2 Industrial 33
7.1.2.1 Industrial Process Control 33
7.1.2.2 Current Shunt Measurement 33
7.1.2.3 Others 34
7.1.3 Nuclear 34
7.1.4 Telecommunication 34
7.1.5 Others 34
8 Global Isolation Amplifier Market, By Type
8.1 Overview 38
8.1.1 Analog 38
8.1.2 Digital 38
9 Isolation Amplifier Market, By Region
9.1 Introduction 40
9.1.1 U.S. 44
9.1.2 Canada 46
9.1.3 Mexico 48
9.2 Europe 50
9.2.1 U.K 54
9.2.2 Germany 56
9.2.3 France 58
9.2.4 Italy 60
9.2.5 Rest of Europe 61
9.3 Asia Pacific 62
9.3.1 China 66
9.3.2 India 67
9.3.3 Japan 68
9.3.4 South Korea 69
9.3.5 Rest of Asia Pacific 70
9.4 Rest of the World 71
9.4.1 The Middle East & Africa 75
9.4.2 Latin America 76
10 Competitive Landscape
10.1 Competitive Landscape 79
11 Company Profiles
11.1 Texas Instruments Inc. 82
11.1.1 Company Overview 82
11.1.2 Financial Overview 82
11.1.3 Product Portfolio: 83
11.1.4 Key Developments 83
11.1.5 SWOT Analysis 84
11.1.6 Key Strategy 84
11.2 Eaton Corporation PLC 85
11.2.1 Company Overview 85
11.2.2 Financial Overview 85
11.2.3 Product Portfolio: 86
11.2.4 Key Developments 86
11.2.5 SWOT Analysis 86
11.2.6 Key Strategy 86
11.3 Silicon Laboratories, Inc. 87
11.3.1 Company Overview 87
11.3.2 Financial Overview 87
11.3.3 Product Portfolio: 88
11.3.4 Key Developments 88
11.3.5 SWOT Analysis 88
11.3.6 Key Strategy 88
11.4 Dewetron GmbH 89
11.4.1 Company Overview 89
11.4.2 Product Portfolio 89
11.4.3 Key Developments 89
11.4.4 Key Strategy 89
11.5 Wurth Elektronik 90
11.5.1 Company Overview 90
11.5.2 Financial Overview 90
11.5.3 Product Portfolio: 91
11.6 DRAGO Automation GmbH 92
11.6.1 Company Overview 92
11.6.2 Product Portfolio: 92
11.7 Toshiba Corporation 93
11.7.1 Company Overview 93
11.7.2 Financial Overview 93
11.7.3 Product Offerings 94
11.7.4 Key Developments 94
11.7.5 SWOT Analysis 94
11.7.6 Key Strategy 94
11.8 Broadcom Pte. Ltd. 95
11.8.1 Company Overview 95
11.8.2 Financial Overview 95
11.8.3 Product Offerings 96
11.8.4 Key Developments 96
11.8.5 SWOT Analysis 96
11.8.6 Key Strategy 96
11.9 Analog Devices, Inc. 97
11.9.1 Company Overview 97
11.9.2 Financial Overview 97
11.9.3 Product Offerings 98
11.9.4 Key Developments 98
β
12 List of Tables
TABLE 1 MARKET SYNOPSIS 12
TABLE 2 LIST OF ASSUMPTIONS 14
TABLE 3 GLOBAL ISOLATION AMPLIFIER MARKET, BY APPLICATION, 2020-2027 (USD MILLION) 35
TABLE 4 GLOBAL ISOLATION AMPLIFIER MARKET, BY MEDICAL APPLICATION, 2020-2027 (USD MILLION) 35
TABLE 5 GLOBAL ISOLATION AMPLIFIER MARKET, BY INDUSTRIAL APPLICATION, 2020-2027 (USD MILLION) 36
TABLE 6 GLOBAL ISOLATION AMPLIFIER MARKET, BY TYPE, 2020-2027 (USD MILLION) 38
TABLE 7 GLOBAL ISOLATION AMPLIFIER SMARKET, BY REGION, 2020-2027 (USD MILLION) 40
TABLE 8 NORTH AMERICA ISOLATION AMPLIFIER MARKET, BY COUNTRY, 2020-2027 (USD MILLION) 41
TABLE 9 NORTH AMERICA ISOLATION AMPLIFIER MARKET, BY APPLICATION, 2020-2027 (USD MILLION) 42
TABLE 10 NORTH AMERICA ISOLATION AMPLIFIER MARKET, BY MEDICAL APPLICATION, 2020-2027 (USD MILLION) 42
TABLE 11 NORTH AMERICA ISOLATION AMPLIFIER MARKET, BY INDUSTRIAL APPLICATION, 2020-2027(USD MILLION) 43
TABLE 12 NORTH AMERICA ISOLATION AMPLIFIER MARKET, BY TYPE, 2020-2027 (USD MILLION) 44
TABLE 13 U.S. ISOLATION AMPLIFIER MARKET, BY APPLICATION, 2020-2027 (USD MILLION) 44
TABLE 14 U.S. ISOLATION AMPLIFIER MARKET, BY MEDICAL APPLICATION, 2020-2027 (USD MILLION) 44
TABLE 15 U.S. ISOLATION AMPLIFIER MARKET, BY INDUSTRIAL APPLICATION, 2020-2027 (USD MILLION) 45
TABLE 16 U.S. ISOLATION AMPLIFIER MARKET, BY TYPE, 2020-2027 USD MILLION) 45
TABLE 17 CANADA ISOLATION AMPLIFIER MARKET, BY APPLICATION, 2020-2027 (USD MILLION) 46
TABLE 18 CANADA ISOLATION AMPLIFIER MARKET, BY MEDICAL APPLICATION, 2020-2027 (USD MILLION) 46
TABLE 19 CANADA ISOLATION AMPLIFIER MARKET, BY INDUSTRIAL APPLICATION, 2020-2027 (USD MILLION) 47
TABLE 20 CANADA ISOLATION AMPLIFIER MARKET, BY TYPE, 2020-2027 (USD MILLION) 47
TABLE 21 MEXICO ISOLATION AMPLIFIER MARKET, BY APPLICATION, 2020-2027 (USD MILLION) 48
TABLE 22 MEXICO ISOLATION AMPLIFIER MARKET, BY MEDICAL APPLICATION, 2020-2027 (USD MILLION) 48
TABLE 23 MEXICO ISOLATION AMPLIFIER MARKET, BY INDUSTRIAL APPLICATION, 2020-2027 (USD MILLION) 49
TABLE 24 MEXICO ISOLATION AMPLIFIER MARKET, BY TYPE, 2020-2027 (USD MILLION) 49
TABLE 25 EUROPE ISOLATION AMPLIFIER MARKET, BY COUNTRY, 2020-2027 (USD MILLION) 50
TABLE 26 EUROPE ISOLATION AMPLIFIER MARKET, BY APPLICATION, 2020-2027 (USD MILLION) 51
TABLE 27 EUROPE ISOLATION AMPLIFIER MARKET, BY MEDICAL APPLICATION, 2020-2027 (USD MILLION) 52
TABLE 28 EUROPE ISOLATION AMPLIFIER MARKET, BY INDUSTRIAL APPLICATION, 2020-2027 (USD MILLION) 52
TABLE 29 EUROPE ISOLATION AMPLIFIER MARKET, BY TYPE, 2020-2027 (USD MILLION) 53
TABLE 30 U.K ISOLATION AMPLIFIER MARKET, BY APPLICATION, 2020-2027 (USD MILLION) 54
TABLE 31 U.K ISOLATION AMPLIFIER MARKET, BY MEDICAL APPLICATION, 2020-2027 (USD MILLION) 54
TABLE 32 U.K ISOLATION AMPLIFIER MARKET, BY INDUSTRIAL APPLICATION, 2020-2027 (USD MILLION) 55
TABLE 33 U.K ISOLATION AMPLIFIER MARKET, BY TYPE, 2020-2027 (USD MILLION) 55
TABLE 34 GERMANY ISOLATION AMPLIFIER MARKET, BY APPLICATION, 2020-2027 (USD MILLION) 56
TABLE 35 GERMANY ISOLATION AMPLIFIER MARKET, BY MEDICAL APPLICATION, 2020-2027 (USD MILLION) 56
TABLE 36 GERMANY ISOLATION AMPLIFIER MARKET, BY INDUSTRIAL APPLICATION, 2020-2027 (USD MILLION) 57
TABLE 37 GERMANY ISOLATION AMPLIFIER MARKET, BY TYPE, 2020-2027 (USD MILLION) 57
TABLE 38 FRANCE ISOLATION AMPLIFIER MARKET, BY APPLICATION, 2020-2027 (USD MILLION) 58
TABLE 39 FRANCE ISOLATION AMPLIFIER MARKET, BY MEDICAL APPLICATION, 2020-2027 (USD MILLION) 58
TABLE 40 FRANCE ISOLATION AMPLIFIER MARKET, BY INDUSTRIAL APPLICATION, 2020-2027 (USD MILLION) 59
TABLE 41 FRANCE ISOLATION AMPLIFIER MARKET, BY TYPE, 2020-2027 (USD MILLION) 59
TABLE 42 ITALY ISOLATION AMPLIFIER MARKET, BY APPLICATION, 2020-2027 (USD MILLION) 60
TABLE 43 ITALY ISOLATION AMPLIFIER MARKET, BY MEDICAL APPLICATION, 2020-2027 (USD MILLION) 60
TABLE 44 ITALY ISOLATION AMPLIFIER MARKET, BY INDUSTRIAL APPLICATION, 2020-2027 (USD MILLION) 60
TABLE 45 ITALY ISOLATION AMPLIFIER MARKET, BY TYPE, 2020-2027 (USD MILLION) 60
TABLE 46 REST OF EUROPE ISOLATION AMPLIFIER MARKET, BY APPLICATION, 2020-2027 (USD MILLION) 61
TABLE 47 REST OF EUROPE ISOLATION AMPLIFIER MARKET, BY MEDICAL APPLICATION, 2020-2027 (USD MILLION) 61
TABLE 48 REST OF EUROPE ISOLATION AMPLIFIER MARKET, BY INDUSTRIAL APPLICATION, 2020-2027 (USD MILLION) 61
TABLE 49 REST OF EUROPE ISOLATION AMPLIFIER MARKET, BY TYPE, 2020-2027 (USD MILLION) 61
TABLE 50 ASIA PACIFIC ISOLATION AMPLIFIER MARKET, BY COUNTRY, 2020-2027 (USD MILLION) 62
TABLE 51 ASIA PACIFIC ISOLATION AMPLIFIER MARKET, BY APPLICATION, 2020-2027 (USD MILLION) 63
TABLE 52 ASIA PACIFIC ISOLATION AMPLIFIER MARKET, BY MEDICAL APPLICATION, 2020-2027 (USD MILLION) 64
TABLE 53 ASIA PACIFIC ISOLATION AMPLIFIER MARKET, BY INDUSTRIAL APPLICATION, 2020-2027 (USD MILLION) 64
TABLE 54 ASIA PACIFIC ISOLATION AMPLIFIER MARKET, BY TYPE, 2020-2027 (USD MILLION) 65
TABLE 55 CHINA ISOLATION AMPLIFIER MARKET, BY APPLICATION, 2020-2027 (USD MILLION) 66
TABLE 56 CHINA ISOLATION AMPLIFIER MARKET, BY MEDICAL APPLICATION, 2020-2027 (USD MILLION) 66
TABLE 57 CHINA ISOLATION AMPLIFIER MARKET, BY INDUSTRIAL APPLICATION, 2020-2027 (USD MILLION) 66
TABLE 58 CHINA ISOLATION AMPLIFIER MARKET, BY TYPE, 2020-2027 (USD MILLION) 66
TABLE 59 INDIA ISOLATION AMPLIFIER MARKET, BY APPLICATION, 2020-2027 (USD MILLION) 67
TABLE 60 INDIA ISOLATION AMPLIFIER MARKET, BY MEDICAL APPLICATION, 2020-2027 (USD MILLION) 67
TABLE 61 INDIA ISOLATION AMPLIFIER MARKET, BY INDUSTRIAL APPLICATION, 2020-2027 (USD MILLION) 67
TABLE 62 INDIA ISOLATION AMPLIFIER MARKET, BY TYPE, 2020-2027 (USD MILLION) 67
TABLE 63 JAPAN ISOLATION AMPLIFIER MARKET, BY APPLICATION, 2020-2027 (USD MILLION) 68
TABLE 64 JAPAN ISOLATION AMPLIFIER MARKET, BY MEDICAL APPLICATION, 2020-2027 (USD MILLION) 68
TABLE 65 JAPAN ISOLATION AMPLIFIER MARKET, BY INDUSTRIAL APPLICATION, 2020-2027 (USD MILLION) 68
TABLE 66 JAPAN ISOLATION AMPLIFIER MARKET, BY TYPE, 2020-2027 (USD MILLION) 68
TABLE 67 SOUTH KOREA ISOLATION AMPLIFIER MARKET, BY APPLICATION, 2020-2027 (USD MILLION) 69
TABLE 68 SOUTH KOREA ISOLATION AMPLIFIER MARKET, BY MEDICAL APPLICATION, 2020-2027 (USD MILLION) 69
TABLE 69 SOUTH KOREA ISOLATION AMPLIFIER MARKET, BY INDUSTRIAL APPLICATION, 2020-2027 (USD MILLION) 69
TABLE 70 SOUTH KOREA ISOLATION AMPLIFIER MARKET, BY TYPE, 2020-2027 (USD MILLION) 69
TABLE 71 REST OF ASIA PACIFIC ISOLATION AMPLIFIER MARKET, BY APPLICATION, 2020-2027 (USD MILLION) 70
TABLE 72 REST OF ASIA PACIFIC ISOLATION AMPLIFIER MARKET, BY MEDICAL APPLICATION, 2020-2027 (USD MILLION) 70
TABLE 73 REST OF ASIA PACIFIC ISOLATION AMPLIFIER MARKET, BY INDUSTRIAL APPLICATION, 2020-2027 (USD MILLION) 70
TABLE 74 REST OF ASIA PACIFIC ISOLATION AMPLIFIER MARKET, BY TYPE, 2020-2027 (USD MILLION) 70
TABLE 75 REST OF THE WORLD ISOLATION AMPLIFIER MARKET, BY COUNTRY, 2020-2027 (USD MILLION) 71
TABLE 76 REST OF THE WORLD ISOLATION AMPLIFIER MARKET, BY APPLICATION, 2020-2027 (USD MILLION) 72
TABLE 77 REST OF THE WORLD ISOLATION AMPLIFIER MARKET, BY MEDICAL APPLICATION, 2020-2027 (USD MILLION) 72
TABLE 78 REST OF THE WORLD ISOLATION AMPLIFIER MARKET, BY INDUSTRIAL APPLICATION, 2020-2027 (USD MILLION) 73
TABLE 79 REST OF THE WORLD ISOLATION AMPLIFIER MARKET, BY TYPE, 2020-2027 (USD MILLION) 74
TABLE 80 THE MIDDLE EAST & AFRICA ISOLATION AMPLIFIER MARKET, BY APPLICATION, 2020-2027 (USD MILLION) 75
TABLE 81 THE MIDDLE EAST & AFRICA ISOLATION AMPLIFIER MARKET, BY TYPE, 2020-2027 (USD MILLION) 75
TABLE 82 THE MIDDLE EAST & AFRICA ISOLATION AMPLIFIER MARKET, BY MEDICAL APPLICATION, 2020-2027 (USD MILLION) 75
TABLE 83 THE MIDDLE EAST & AFRICA ISOLATION AMPLIFIER MARKET, BY INDUSTRIAL APPLICATION, 2020-2027 (USD MILLION) 75
TABLE 84 LATIN AMERICA ISOLATION AMPLIFIER MARKET, BY APPLICATION, 2020-2027 (USD MILLION) 76
TABLE 85 LATIN AMERICA ISOLATION AMPLIFIER MARKET, BY MEDICAL APPLICATION, 2020-2027 (USD MILLION) 76
TABLE 86 LATIN AMERICA ISOLATION AMPLIFIER MARKET, BY INDUSTRIAL APPLICATION, 2020-2027 (USD MILLION) 77
TABLE 87 LATIN AMERICA ISOLATION AMPLIFIER MARKET, BY TYPE, 2020-2027 (USD MILLION) 77
β
13 List of Figures
FIGURE 1 GLOBAL ISOLATION AMPLIFIER MARKET: MARKET STRUCTURE 15
FIGURE 2 NORTH AMERICA MARKET SIZE & MARKET SHARE BY COUNTRY (2020 VS 2027) 17
FIGURE 3 EUROPE MARKET SIZE & MARKET SHARE BY COUNTRY (2020 VS 2027) 17
FIGURE 4 ASIA PACIFIC MARKET SIZE & MARKET SHARE BY COUNTRY (2020 VS 2027) 18
FIGURE 5 REST OF WORLD MARKET SIZE & MARKET SHARE BY COUNTRY (2020 VS 2027) 18
FIGURE 6 RESEARCH PROCESS OF MRFR 20
FIGURE 7 TOP DOWN & BOTTOM UP APPROACH 23
FIGURE 8 DROC ANALYSIS OF GLOBAL ISOLATION AMPLIFIER MARKET 25
FIGURE 9 DRIVERS IMPACT ANALYSIS: ISOLATION AMPLIFIER MARKET 26
FIGURE 10 VALUE CHAIN: ISOLATION AMPLIFIER MARKET 29
FIGURE 11 PORTER'S FIVE FORCES ANALYSIS OF THE GLOBAL ISOLATION AMPLIFIER MARKET 30
FIGURE 12 GLOBAL ISOLATION AMPLIFIER MARKET, BY APPLICATION, 2020 VS 2027 (USD MILLION) 34
FIGURE 13 GLOBAL ISOLATION AMPLIFIER MARKET, BY MEDICAL APPLICATION, 2020-2027 (USD MILLION) 35
FIGURE 14 GLOBAL ISOLATION AMPLIFIER MARKET, BY INDUSTRIAL APPLICATION, 2020-2027 (USD MILLION) 36
FIGURE 15 GLOBAL ISOLATION AMPLIFIER MARKET, BY TYPE, 2020 VS 2027 (USD MILLION) 38
FIGURE 16 GLOBAL ISOLATION AMPLIFIER MARKET, BY REGION, 2020 VS 2027 (USD MILLION) 40
FIGURE 17 NORTH AMERICA ISOLATION AMPLIFIER MARKET, BY COUNTRY, 2020 VS 2027 (USD MILLION) 41
FIGURE 18 NORTH AMERICA ISOLATION AMPLIFIER MARKET, BY APPLICATION, 2020 VS 2027 (USD MILLION) 41
FIGURE 19 NORTH AMERICA ISOLATION AMPLIFIER MARKET, BY MEDICAL APPLICATION, 2020 VS 2027 (USD MILLION) 42
FIGURE 20 NORTH AMERICA ISOLATION AMPLIFIER MARKET, BY INDUSTRIAL APPLICATION, 2020 VS 2027 (USD MILLION) 43
FIGURE 21 NORTH AMERICA ISOLATION AMPLIFIER MARKET, BY TYPE, 2020 VS 2027 (USD MILLION) 43
FIGURE 22 EUROPE ISOLATION AMPLIFIER MARKET, BY COUNTRY, 2020 VS 2027 (USD MILLION) 50
FIGURE 23 EUROPE ISOLATION AMPLIFIER MARKET, BY APPLICATION, 2020 VS 2027 (USD MILLION) 51
FIGURE 24 EUROPE ISOLATION AMPLIFIER MARKET, BY MEDICAL APPLICATION, 2020 VS 2027 (USD MILLION) 51
FIGURE 25 EUROPE ISOLATION AMPLIFIER MARKET, BY INDUSTRIAL APPLICATION, 2020 VS 2027 (USD MILLION) 52
FIGURE 26 EUROPE ISOLATION AMPLIFIER MARKET, BY TYPE, 2020 VS 2027 (USD MILLION) 53
FIGURE 27 ASIA PACIFIC ISOLATION AMPLIFIER MARKET, BY COUNTRY, 2020-2027 (USD MILLION) 62
FIGURE 28 ASIA PACIFIC ISOLATION AMPLIFIER MARKET, BY APPLICATION, 2020 VS 2027 (USD MILLION) 63
FIGURE 29 ASIA PACIFIC ISOLATION AMPLIFIER MARKET, BY MEDICAL APPLICATION, 2020 VS 2027 (USD MILLION) 63
FIGURE 30 ASIA PACIFIC ISOLATION AMPLIFIER MARKET, BY INDUSTRIAL APPLICATION, 2020 VS 2027 (USD MILLION) 64
FIGURE 31 ASIA PACIFIC ISOLATION AMPLIFIER MARKET, BY TYPE, 2020 VS 2027 (USD MILLION) 65
FIGURE 32 REST OF THE WORLD ISOLATION AMPLIFIER MARKET, BY COUNTRY, 2020 VS 2027 (USD MILLION) 71
FIGURE 33 REST OF THE WORLD ISOLATION AMPLIFIER MARKET, BY APPLICATION, 2020 VS 2027 (USD MILLION) 71
FIGURE 34 REST OF THE WORLD ISOLATION AMPLIFIER MARKET, BY MEDICAL APPLICATION, 2020 VS 2027 (USD MILLION) 72
FIGURE 35 REST OF THE WORLD ISOLATION AMPLIFIER MARKET, BY INDUSTRIAL APPLICATION, 2020 VS 2027 (USD MILLION) 73
FIGURE 36 REST OF THE WORLD ISOLATION AMPLIFIER MARKET, BY TYPE, 2020 VS 2027 (USD MILLION) 74
FIGURE 37 MAJOR MANUFACTURER MARKET SHARE ANALYSIS, 2020 80
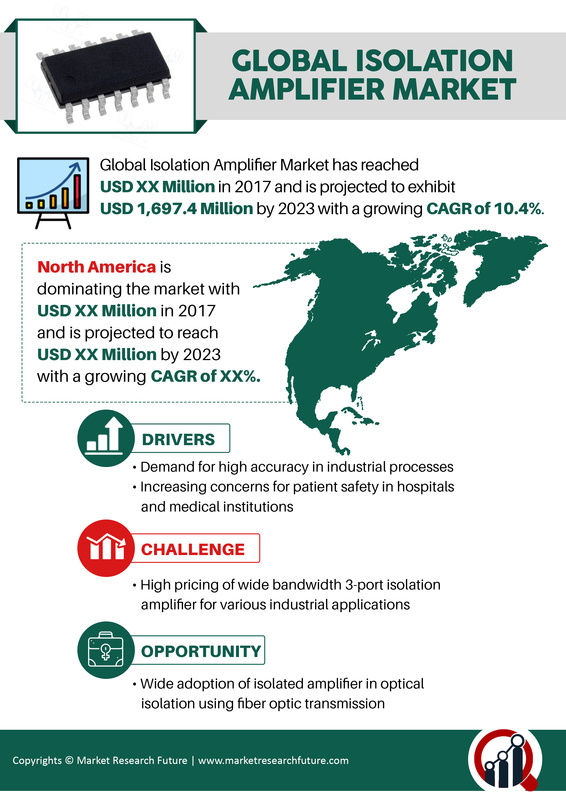
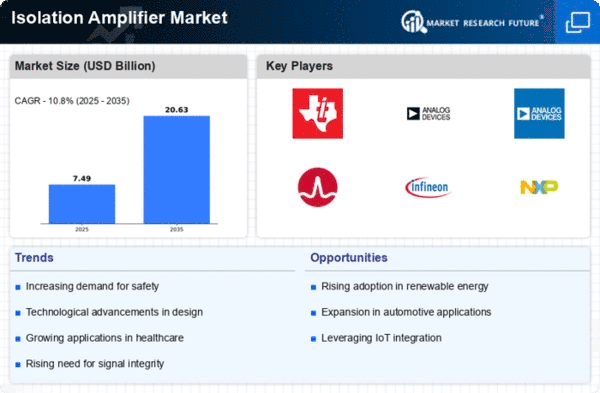
An isolation amplifier is a type of amplifier that helps measure the small signals present in a high common-mode voltage. They are used in several industries to reduce the risk of shock. It is designed with a high voltage current flow that will potentially reduce the risk for the users. The different types of protection provided by the Isolation Amplifier are grounding, insulation of lethal voltages and isolation. The high voltage could be dangerous for humans; therefore, enabling the isolation amplifier would be useful. It can also act as a safety barrier against the problems. The adaptation of the innovative and newer technologies and demand for cloud computing and high-velocity telecommunication in several regions contribute to the Isolation Amplifier Market Share. These types of amplifiers are used in the market for protecting data acquisition components. The isolation amplifier is used in several sectors, including the medical industry. The medical industry uses this to secure the patients from getting troubled by any power leak. For measuring different human body tissues, the isolation amplifier is also used. From 2018 to 2023, the Isolation Amplifier Market is expected to hold 13.06 billion and will experience a CAGR of 10.4% growth rate.
COVID 19 ANALYSIS
The COVID 19 has shown a negative impact on the market. Due to the pandemic outbreak, the manufacturing industries were halted for a longer period. The industrial units were also shut down, which impacted the market's supply chain. During the outbreak, medical equipment demand increased, which impacted the isolation amplifier market. Major countries of the world experienced loss, and to recover from the market is still coping up. The increased medical usage is improving the market growth. However, the market stabilizes and rises from the loss to normal.
Chief Factors Existing in the Market
The evaluation of the Isolation Amplifier Market shows the current and future scenarios of the market. Further market growth is also based on the Isolation Amplifier Market demand and the Isolation Amplifier Market Revenue. The development and demand of the market affect the market size. The different market factors, such as driver's opportunities, ensure the market's growth to reach the market to its estimated value. In contrast, the challenges and the restraining factors lessen the market demand and restrain the market for further growth.
Market Segmentation
The market is segregated into major segments. The segments are type, medical, industrial, telecommunication, intended audience, application, etc.
Regional Analysis
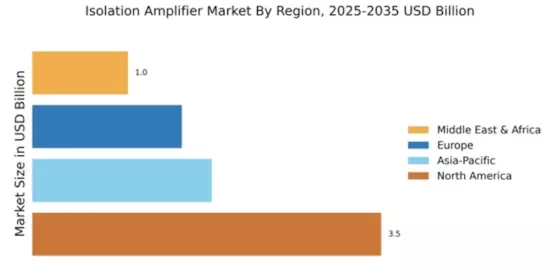
According to the geographical sectors of the market, the Isolation Amplifier Market is spread in Asia Pacific, North America, Europe and other parts of the world. Among all the geographical regions, it is estimated that the North American region will account for Isolation Amplifier Market Growth due to the urbanization and presence of well-developed telecommunication industries in the region. In the region, the enforcement of smart transportation is also a factor for the growth rate of the market. With North America leading in the market, Europe and the Asia Pacific are likely contributing to the growth. Due to the increase of telecommunication industry and adaptation of technologies by the major countries like Japan, India and China, the region is expected to expand soon. The Isolation Amplifier Market Demand will increase based on every region.
Competitive Intensity within the Market
The key players of the market are helping the market to rise in high demand over time. The presence of different market players contributes to the Isolation Amplifier Market Size. The competition between the market players of different regions results in the development of the Isolation Amplifier Market, which marks the market's importance. Those global players are
These market players push the Isolation Amplifier Market towards growth by improving the Market Revenue.
Recent Market Development
Report Overview
The report overview of the Isolation Amplifier Market depicts the complete overview of the market's progress during the forecast period. The chief existing factors are showcasing their effect on the market. The different market segments provide a clear view of the impact on the market, and the detail is also studied within the market. Several geographical regions show the development of different continents within the market and increase the Isolation Amplifier Market Size. The presence of key players in the market fuels the market's growth, resulting in the massive growth of the Isolation Amplifier Market Revenue. Despite the pandemic, the market is coping with the condition and will register high growth in the future.
Key Industrial Segment
By Type
By Industrial
By Application
By Medical
Telecommunication
Report Attribute/Metric | Details |
---|---|
Market Size | 13.06 Billion |
CAGR | 10.4% |
Base Year | 2019 |
Forecast Period | 2020-2027 |
Historical Data | 2018 |
Forecast Units | Value (USD Million) |
Report Coverage | Revenue Forecast, Competitive Landscape, Growth Factors, and Trends |
Segments Covered | Application, Type |
Geographies Covered | North America, Europe, Asia-Pacific, and Rest of the World (RoW) |
Key Vendors | Broadcom Pte. Ltd. (U.S.), DRAGO Automation GmbH (Germany), Analog Devices, Inc. (U.S.), WΓΌrth Elektronik GmbH & Co. KG (Germany), Eaton Corporation PLC (Ireland), Texas Instruments Inc. (U.S.), Silicon Laboratories, Inc. (U.S.), Toshiba Corporation (Japan), and Dewetron GmbH (Austria) |
Key Market Opportunities | The rising cellular network penetration, and increasing demand of telecommunication services. |
Key Market Drivers |
|
Frequently Asked Questions (FAQ) :
The global market for isolation amplifier market is slated to reach a market value of USD 13.06 billion by 2023.
The global isolation amplifier market is poised to generate substantial revenue at a 10% CAGR over the review period (2017-2023).
The rising cellular network penetration, and increasing demand of telecommunication services is likely to create opportunities for the market players.
The high cost of isolation amplifier systems, along with technological intricacies involved, are expected to impede the overall market growth.
The digital segment is expected to record the highest CAGR over the review period.
Moreover, the APAC market for a isolation amplifier is expected to expand at a 12.6% CAGR over the review period.
Rising demand for noise cancellation and data protection in Telecommunication is driving the isolation amplifier market creating a highly competitive landscape.
A few players dominate the isolation amplifier market. Of all, Texas Instruments Inc. is the leading provider of isolation amplifier enabled products, specializing in biomedical instrumentation and holds 12.09% share of the overall market. Recently, Texas Instruments acquired National Semiconductor Corp., an American semiconductor manufacturer of analog devices and subsystems, to increase company profit and expand its reach to additional markets.
Analog Devices, Inc. deals with designing, manufacturing, and marketing of analog, mixed-signal, and digital signal processing integrated circuits used in virtually all types of electronic equipment and holds 11.71% market share. Analog Devices Inc., has targeted at X-band and Ku-band phased-array antennas with an active analog beam-forming chip that includes four channels of transmitting and receiving gain and phase control, plus a transmit/receive switch for each channel.
Toshiba Corporation is operating in the business manufacturing and selling a wide range of electrical and electronic products, holding a 9.52% market share. The company’s strategy is explicitly focused on research and development for developing more and more innovative products. Moreover, the company is aiming to expand its global footprint in almost all the business segments by focusing on partnerships and acquisitions.
Silicon Laboratories, Inc. deals with the designing, developing, and supplying of a wide range of digital and analog semiconductor connectivity solutions and holds 8.81% market share. The Si8920 isolated analog amplifier, launched by Silicon Laboratories, is the fastest current sensing amplifier providing an ideal current shunt measurement solution for power control systems operating in industrial motor drives, solar inverters, high-voltage power converters, uninterruptible power supplies (UPS), and electric/hybrid-electric vehicle (EV/HEV) systems.
Wurth Elektronik is one of the largest manufacturers of electronic & electromechanical components and has specialized in prototypes and small and medium-sized orders. It holds a 6% market share. The company designs and manufactures inductors, RF inductors and LTCC components, transformers, components for circuit protection, power modules, LEDs, connectors, switches, power elements in press-fit technology, and assembly techniques.