ID: MRFR/A&D/6096-CR | May 2019 | Region: Global | 133 Pages
Table of Contents
Executive Summary
1.1. Market Attractiveness Analysis
1.1.1. Global Military Image Intensifier Market, By Generation
1.1.2. Global Military Image Intensifier Market, By Diameter
1.1.3. Global Military Image Intensifier Market, By Application
1.1.4. Global Military Image Intensifier Market, By Region
Market Introduction
2.1. Market Definition
2.2. Scope of the Study
2.3. Market Structure
2.4. Key Buying Criteria
2.5. Market Factor Indicator Analysis
Research Methodology
3.1. Research Process
3.2. Primary Research
3.3. Secondary Research
3.4. Market Generation Estimation
3.5. Forecast Model
3.6. List of Assumptions
Market Insights
Market Dynamics
5.1. Introduction
5.2. Drivers
5.3. Restraints
5.4. Opportunities
5.5. Challenges
5.6. Market/Technological Trends
5.7. Patent Trends
5.8. Regulatory Landscape/Standards
Market Factor Analysis
6.1. Value Chain/Supply Chain Analysis
6.1.1. R&D
6.1.2. Manufacturing
6.1.3. Distribution & Sales
6.1.4. Post-Sales Monitoring
6.2. Porterβs Five Forces Analysis
6.2.1. Threat of New Entrants
6.2.2. Bargaining Power of Buyers
6.2.3. Threat of Substitutes
6.2.4. Competitive Rivalry
6.2.5. Bargaining Power of Supplies
Global Military Image Intensifier Market, by Generation
7.1. Introduction
7.2. Gen 0
7.2.1. Market Estimates & Forecast, 2020β2027
7.2.2. Market Estimates & Forecast, by Region, 2020β2027
7.3. Gen 1
7.3.1. Market Estimates & Forecast, 2020β2027
7.3.2. Market Estimates & Forecast, by Region, 2020β2027
7.4. Gen 2
7.4.1. Market Estimates & Forecast, 2020β2027
7.4.2. Market Estimates & Forecast, by Region, 2020β2027
7.5. Gen 3
7.5.1. Market Estimates & Forecast, 2020β2027
7.5.2. Market Estimates & Forecast, by Region, 2020β2027
Global Military Image Intensifier Market, by Diameter
8.1. Introduction
8.2. <18mm
8.2.1. Market Estimates & Forecast, 2020β2027
8.2.2. Market Estimates & Forecast, by Region, 2020β2027
8.3. 18mm
8.3.1. Market Estimates & Forecast, 2020β2027
8.3.2. Market Estimates & Forecast, by Region, 2020β2027
8.4. 25mm
8.4.1. Market Estimates & Forecast, 2020β2027
8.4.2. Market Estimates & Forecast, by Region, 2020β2027
8.5. >25mm
8.5.1. Market Estimates & Forecast, 2020β2027
8.5.2. Market Estimates & Forecast, by Region, 2020β2027
Global Military Image Intensifier Market, by Application
9.1. Introduction
9.2. Cameras
9.2.1. Market Estimates & Forecast, 2020β2027
9.2.2. Market Estimates & Forecast, by Region, 2020β2027
9.3. Scopes
9.3.1. Market Estimates & Forecast, 2020β2027
9.3.2. Market Estimates & Forecast, by Region, 2020β2027
9.4. Goggles
9.4.1. Market Estimates & Forecast, 2020β2027
9.4.2. Market Estimates & Forecast, by Region, 2020β2027
Global Military Image Intensifier Market, by Region
10.1. Introduction
10.2. North America
10.2.1. Market Estimates & Forecast, by Country, 2020β2027
10.2.2. Market Estimates & Forecast, by Generation, 2020β2027
10.2.3. Market Estimates & Forecast, by Diameter, 2020β2027
10.2.4. Market Estimates & Forecast, by Application, 2020β2027
10.2.5. US
10.2.5.1. Market Estimates & Forecast, by Generation, 2020β2027
10.2.5.2. Market Estimates & Forecast, by Diameter, 2020β2027
10.2.5.3. Market Estimates & Forecast, by Application, 2020β2027
10.2.6. Canada
10.2.6.1. Market Estimates & Forecast, by Generation, 2020β2027
10.2.6.2. Market Estimates & Forecast, by Diameter, 2020β2027
10.2.6.3. Market Estimates & Forecast, by Application, 2020β2027
10.3. Europe
10.3.1. Market Estimates & Forecast, by Country, 2020β2027
10.3.2. Market Estimates & Forecast, by Generation, 2020β2027
10.3.3. Market Estimates & Forecast, by Diameter, 2020β2027
10.3.4. Market Estimates & Forecast, by Application, 2020β2027
10.3.5. UK
10.3.5.1. Market Estimates & Forecast, by Generation, 2020β2027
10.3.5.2. Market Estimates & Forecast, by Diameter, 2020β2027
10.3.5.3. Market Estimates & Forecast, by Application, 2020β2027
10.3.6. Germany
10.3.6.1. Market Estimates & Forecast, by Generation, 2020β2027
10.3.6.2. Market Estimates & Forecast, by Diameter, 2020β2027
10.3.6.3. Market Estimates & Forecast, by Application, 2020β2027
10.3.7. France
10.3.7.1. Market Estimates & Forecast, by Generation, 2020β2027
10.3.7.2. Market Estimates & Forecast, by Diameter, 2020β2027
10.3.7.3. Market Estimates & Forecast, by Application, 2020β2027
10.3.8. Russia
10.3.8.1. Market Estimates & Forecast, by Generation, 2020β2027
10.3.8.2. Market Estimates & Forecast, by Diameter, 2020β2027
10.3.8.3. Market Estimates & Forecast, by Application, 2020β2027
10.3.9. Rest of Europe
10.3.9.1. Market Estimates & Forecast, by Generation, 2020β2027
10.3.9.2. Market Estimates & Forecast, by Diameter, 2020β2027
10.3.9.3. Market Estimates & Forecast, by Application, 2020β2027
10.4. Asia-Pacific
10.4.1. Market Estimates & Forecast, by Country, 2020β2027
10.4.2. Market Estimates & Forecast, by Generation, 2020β2027
10.4.3. Market Estimates & Forecast, by Diameter, 2020β2027
10.4.4. Market Estimates & Forecast, by Application, 2020β2027
10.4.5. China
10.4.5.1. Market Estimates & Forecast, by Generation, 2020β2027
10.4.5.2. Market Estimates & Forecast, by Diameter, 2020β2027
10.4.5.3. Market Estimates & Forecast, by Application, 2020β2027
10.4.6. Japan
10.4.6.1. Market Estimates & Forecast, by Generation, 2020β2027
10.4.6.2. Market Estimates & Forecast, by Diameter, 2020β2027
10.4.6.3. Market Estimates & Forecast, by Application, 2020β2027
10.4.7. India
10.4.7.1. Market Estimates & Forecast, by Generation, 2020β2027
10.4.7.2. Market Estimates & Forecast, by Diameter, 2020β2027
10.4.7.3. Market Estimates & Forecast, by Application, 2020β2027
10.4.8. South Korea
10.4.8.1. Market Estimates & Forecast, by Generation, 2020β2027
10.4.8.2. Market Estimates & Forecast, by Diameter, 2020β2027
10.4.8.3. Market Estimates & Forecast, by Application, 2020β2027
10.4.9. Rest of Asia-Pacific
10.4.9.1. Market Estimates & Forecast, by Generation, 2020β2027
10.4.9.2. Market Estimates & Forecast, by Diameter, 2020β2027
10.4.9.3. Market Estimates & Forecast, by Application, 2020β2027
10.5. Rest of the World
10.5.1. Market Estimates & Forecast, by Region, 2020β2027
10.5.2. Market Estimates & Forecast, by Generation, 2020β2027
10.5.3. Market Estimates & Forecast, by Diameter, 2020β2027
10.5.4. Market Estimates & Forecast, by Application, 2020β2027
10.5.5. Middle East & Africa
10.5.5.1. Market Estimates & Forecast, by Generation, 2020β2027
10.5.5.2. Market Estimates & Forecast, by Diameter, 2020β2027
10.5.5.3. Market Estimates & Forecast, by Application, 2020β2027
10.5.6. Latin America
10.5.6.1. Market Estimates & Forecast, by Generation, 2020β2027
10.5.6.2. Market Estimates & Forecast, by Diameter, 2020β2027
10.5.6.3. Market Estimates & Forecast, by Application, 2020β2027
Competitive Landscape
11.1. Competitive Overview
11.2. Competitor Dashboard
11.3. Major Growth Strategy in the Military Image Intensifier Market
11.4. Competitive Benchmarking
11.5. Market Share Analysis
11.6. Thales: The Leading Player in terms of Number of Developments in Global Military Image Intensifier Market
11.7. Key Developments & Growth Strategies
11.7.1. New Product Launch/Service Deployment
11.7.2. Merger & Acquisition
11.7.3. Joint Ventures
Company Profiles
12.1. Alpha Optics Systems
12.1.1. Company Overview
12.1.2. Product Offering
12.1.3. Financial Overview
12.1.4. Key Developments
12.1.5. SWOT Analysis
12.1.6. Strategy
12.2. ASELSAN A.Ε.
12.2.1. Company Overview
12.2.2. Product Offering
12.2.3. Financial Overview
12.2.4. Key Developments
12.2.5. SWOT Analysis
12.2.6. Strategy
12.3. FLIR Systems, Inc.
12.3.1. Company Overview
12.3.2. Product Offering
12.3.3. Financial Overview
12.3.4. Key Developments
12.3.5. SWOT Analysis
12.3.6. Strategy
12.4. Harris Corporation
12.4.1. Company Overview
12.4.2. Product Offering
12.4.3. Financial Overview
12.4.4. Key Developments
12.4.5. SWOT Analysis
12.4.6. Strategy
12.5. L3 Technologies, Inc.
12.5.1. Company Overview
12.5.2. Product Offering
12.5.3. Financial Overview
12.5.4. Key Developments
12.5.5. SWOT Analysis
12.5.6. Strategy
12.6. Photek Limited
12.6.1. Company Overview
12.6.2. Product Offering
12.6.3. Financial Overview
12.6.4. Key Developments
12.6.5. SWOT Analysis
12.6.6. Strategy
12.7. Photonis USA Pennsylvania, Inc.
12.7.1. Company Overview
12.7.2. Product Offering
12.7.3. Financial Overview
12.7.4. Key Developments
12.7.5. SWOT Analysis
12.7.6. Strategy
12.8. Thales Group
12.8.1. Company Overview
12.8.2. Product Offering
12.8.3. Financial Overview
12.8.4. Key Developments
12.8.5. SWOT Analysis
12.8.6. Strategy
12.9. Yukon Advanced Optics Worldwide
12.9.1. Company Overview
12.9.2. Product Offering
12.9.3. Financial Overview
12.9.4. Key Developments
12.9.5. SWOT Analysis
12.9.6. Strategy
Appendix
13.1. References
13.2. Related Reports
13.3. List of Abbreviation
Industry Insights
Note: This table of content is tentative and subject to change as the research progresses.
β
List of Tables
Table 1 Global Military Image Intensifier Market, by Region, 2020β2027
Table 2 North America: Military Image Intensifier Market, by Country, 2020β2027
Table 3 Europe: Military Image Intensifier Market, by Country, 2020β2027
Table 4 Asia-Pacific: Military Image Intensifier Market, by Country, 2020β2027
Table 5 Rest of the World: Military Image Intensifier Market, by Region, 2020β2027
Table 6 Global Military Image Intensifier, Generation Market, by Region, 2020β2027
Table 7 North America: Military Image Intensifier, Generation Market, by Country, 2020β2027
Table 8 Europe: Military Image Intensifier, Generation Market, by Country, 2020β2027
Table 9 Asia-Pacific: Military Image Intensifier, Generation Market, by Country, 2020β2027
Table 10 Rest of the World: Military Image Intensifier, Generation Market, by Region, 2020β2027
Table 11 Global Military Image Intensifier, Diameter Market, by Region, 2020β2027
Table 12 North America: Military Image Intensifier, Diameter Market, by Country, 2020β2027
Table 13 Europe: Military Image Intensifier, Diameter Market, by Country, 2020β2027
Table 14 Asia-Pacific: Military Image Intensifier, Diameter Market, by Country, 2020β2027
Table 15 Rest of the World: Military Image Intensifier, Diameter Market, by Region, 2020β2027
Table 16 Global Military Image Intensifier, Application Market, by Region, 2020β2027
Table 17 North America: Military Image Intensifier, Application Market, by Country, 2020β2027
Table 18 Europe: Military Image Intensifier, Application Market, by Country, 2020β2027
Table 19 Asia-Pacific: Military Image Intensifier, Application Market, by Country, 2020β2027
Table 20 Rest of the World: Military Image Intensifier, Application Market, by Region, 2020β2027
Table 21 Global Military Image Intensifier Market, by Region, 2020β2027
Table 22 Global Military Image Intensifier Market, by Generation, 2020β2027
Table 23 Global Military Image Intensifier Market, by Diameter, 2020β2027
Table 24 Global Military Image Intensifier Market, by Application, 2020β2027
Table 25 North America: Military Image Intensifier Market, by Country, 2020β2027
Table 26 North America: Military Image Intensifier Market, by Generation, 2020β2027
Table 27 North America: Military Image Intensifier Market, by Diameter, 2020β2027
Table 28 North America: Military Image Intensifier Market, by Application, 2020β2027
Table 29 Europe: Military Image Intensifier Market, by Country, 2020β2027
Table 30 Europe: Military Image Intensifier Market, by Generation, 2020β2027
Table 31 Europe: Military Image Intensifier Market, by Diameter, 2020β2027
Table 32 Europe: Military Image Intensifier Market, by Application, 2020β2027
Table 33 Asia-Pacific: Military Image Intensifier Market, by Country, 2020β2027
Table 34 Asia-Pacific: Military Image Intensifier Market, by Generation, 2020β2027
Table 35 Asia-Pacific: Military Image Intensifier Market, by Diameter, 2020β2027
Table 36 Asia-Pacific: Military Image Intensifier Market, by Application, 2020β2027
Table 37 Rest of the World: Military Image Intensifier Market, by Region, 2020β2027
Table 38 Rest of the World: Military Image Intensifier Market, by Generation, 2020β2027
Table 39 Rest of the World: Military Image Intensifier Market, by Diameter, 2020β2027
Table 40 Rest of the World: Military Image Intensifier Market, by Application, 2020β2027
β
List of Figures
FIGURE 1 Research Process of MRFR
FIGURE 2 Top-Down & Bottom-Up Approaches
FIGURE 3 Market Dynamics
FIGURE 4 Impact Analysis: Market Drivers
FIGURE 5 Impact Analysis: Market Restraints
FIGURE 6 Porter's Five Forces Analysis
FIGURE 7 Value Chain Analysis
FIGURE 8 Global Military Image Intensifier Market Share, by Generation, 2020 (%)
FIGURE 9 Global Military Image Intensifier Market, by Generation, 2020β2027 (USD Million)
FIGURE 10 Global Military Image Intensifier Market Share, by Diameter, 2020 (%)
FIGURE 11 Global Military Image Intensifier Market, by Diameter, 2020β2027 (USD Million)
FIGURE 12 Global Military Image Intensifier Market Share, by Application, 2020 (%)
FIGURE 13 Global Military Image Intensifier Market, by Application, 2020β2027 (USD Million)
FIGURE 14 Global Military Image Intensifier Market Share (%), By Region, 2020
FIGURE 15 Global Military Image Intensifier Market, by Region, 2020β2027 (USD Million)
FIGURE 16 North America: Military Image Intensifier Market Share (%), 2020
FIGURE 17 North America: Military Image Intensifier Market by Country, 2020β2027 (USD Million)
FIGURE 18 Europe: Military Image Intensifier Market Share (%), 2020
FIGURE 19 Europe: Military Image Intensifier Market by Country, 2020β2027 (USD Million)
FIGURE 20 Asia-Pacific: Military Image Intensifier Market Share (%), 2020
FIGURE 21 Asia-Pacific: Military Image Intensifier Market by Country, 2020β2027 (USD Million)
FIGURE 22 Rest of the World: Military Image Intensifier Market Share (%), 2020
FIGURE 23 Rest of the World: Military Image Intensifier Market by Region, 2020β2027 (USD Million)
Market Scenario
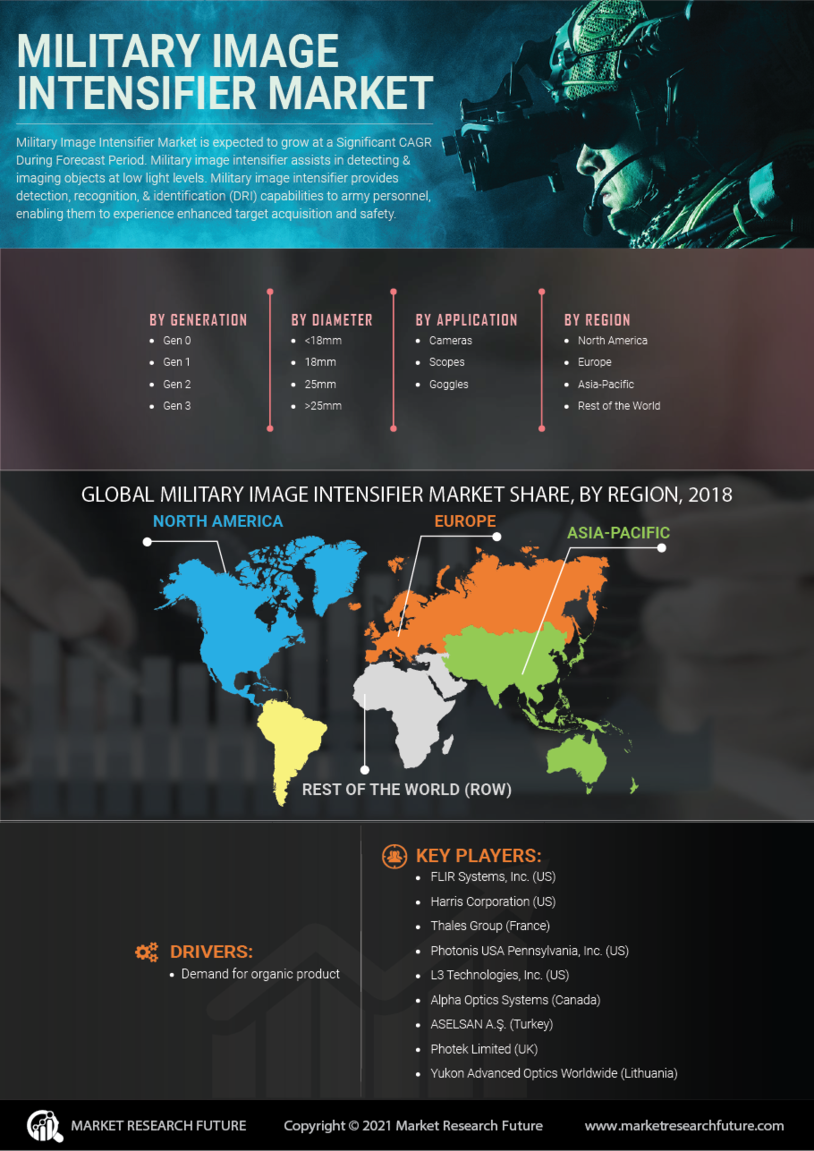
Military image intensifier assists in detecting and imaging objects at low light levels. Military image intensifier provides detection, recognition, and identification (DRI) capabilities to army personnel, enabling them to experience enhanced target acquisition and safety.
Factors such as the growing demand for advanced night vision devices and stringent government regulations on defense personnel security are expected to boost the market growth. However, low operational hours of military image intensifier and government regulations on manufacturing and exporting of night vision devices may hamper the market growth.
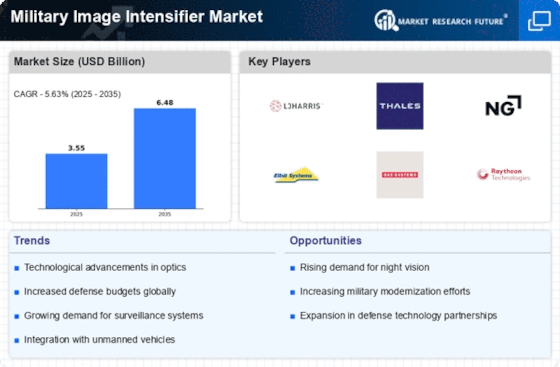
The global military image intensifier market is estimated to register a CAGR of nearly 6.34% during the forecast period from 2018 to 2023.
Segmentation of the Global Military Image Intensifier Market
Based on generation, the gen 3 segment is anticipated to witness the highest CAGR over the forecast period. Gen 3 military image intensifier offers enhanced battery performance and provides better sensitivity to light, that enables users to receive enhanced image quality. Therefore, the segment is anticipated to grow at the highest CAGR over the forecast period. On the basis of diameter, the 18 mm segment is anticipated to witness the highest CAGR over the forecast period owing to benefits offered such as extended detection range and high image resolution.
On the basis of application, the goggles segment is anticipated to grow at the highest CAGR over the forecast period. Defense equipment modernization programs undertaken by the governments of various countries are propelling the segment growth.
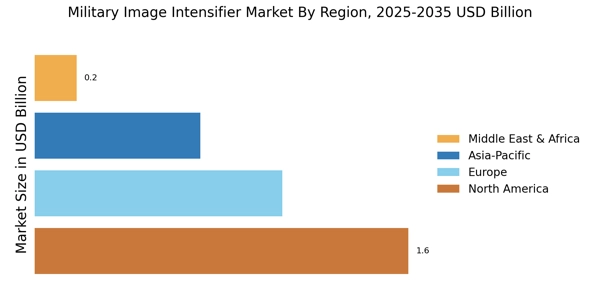
North America is estimated to account for the largest share during the review period. Presence of prominent players such as FLIR Systems, Inc. and Harris Grumman Corporation is expected to bolster the market growth. However, Asia-Pacific is expected to grow at the fastest CAGR over the forecast period, owing to increasing defense expenditure in emerging economies, such as India and China. Additionally, technological advancements in the region are expected to propel the market growth.
Intended Audience
Key Players
The key players in the global military image intensifier market are FLIR Systems, Inc. (US), Harris Corporation (US), Thales Group (France), Photonis USA Pennsylvania, Inc. (US), L3 Technologies, Inc. (US), Alpha Optics Systems (Canada), ASELSAN A.Ε. (Turkey), Photek Limited (UK), and Yukon Advanced Optics Worldwide (Lithuania).
Research Methodology
The market numbers and forecast derived were the outcomes of our disciplined research methodology that includes secondary research, primary interviews, followed by data triangulation and validation from our in-house data repository and statistical modeling tools.
Secondary Research
In this process, the data collection was done through various secondary sources, which included annual reports, SEC filings, journals, government association, aerospace & defense magazines, white papers, corporate presentations, company websites, some paid databases, and others.
Primary Research
In this process, both the demand side and supply side parties were involved in extracting genuine facts and insights about the market forecast, production, trend, and projected market growth. Industry stakeholders such as CEOs, VPs, directors, and marketing executives across the value chain have been approached to obtain key information.
Report Key Insights
Report Customization
MRFR offers report customization to our valued customers. Below are the options available for customization:
In-depth profiling of additional market players (3 to 4 companies)
Detailed analysis of a country and its related segment as per the report scope (subject to data availability)
Frequently Asked Questions (FAQ) :
Military image intensifier market can expand at 6.34% CAGR by 2023.
By 2023, the military image intensifier market can earn decent revenue.
ASELSAN A.Ε. (Turkey), Yukon Advanced Optics Worldwide (Lithuania), and Photek Limited (UK) are some reputed names in the military image intensifier market.
The growing utility of camera can promote the military image intensifier market.
The decline in gen 0 sales can hinder the military image intensifier market.