Industrial Starches Market Segmentation
Industrial Starches Market By Application (USD Billion, 2025-2035)
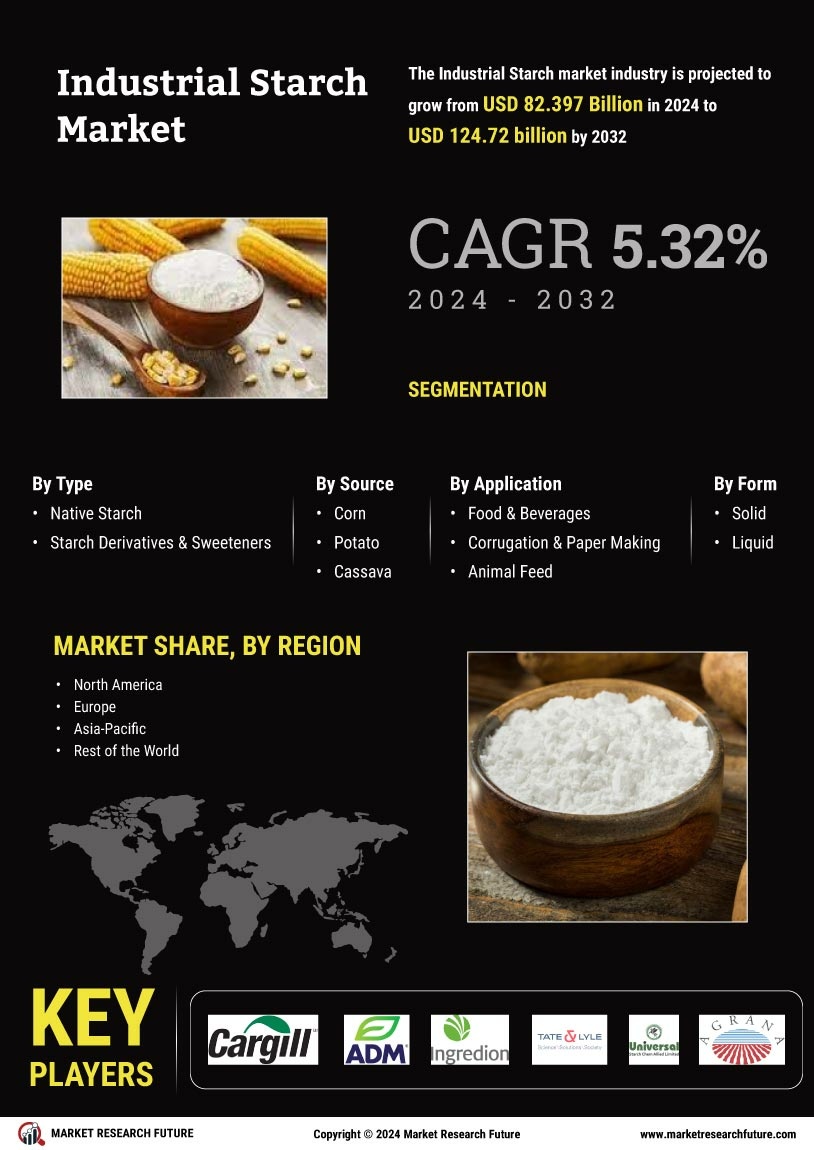
- Food and Beverage
- Industrial Starches Market
- Textile
- Paper
- Biodegradable Plastics
Industrial Starches Market By Source (USD Billion, 2025-2035)
- Corn
- Potato
- Wheat
- Tapioca
- Cassava
Industrial Starches Market By Type (USD Billion, 2025-2035)
- Native Starch
- Modified Starch
- Organic Starch
- Pre-gelatinized Starch
Industrial Starches Market By End Use (USD Billion, 2025-2035)
- Food Industry
- Non-Food Industry
- Animal Feed
- Adhesives