

India Food, Beverages & Nutrition Market Segmentation
Food, Beverages & Nutrition By Type (USD Million, 2025-2035)
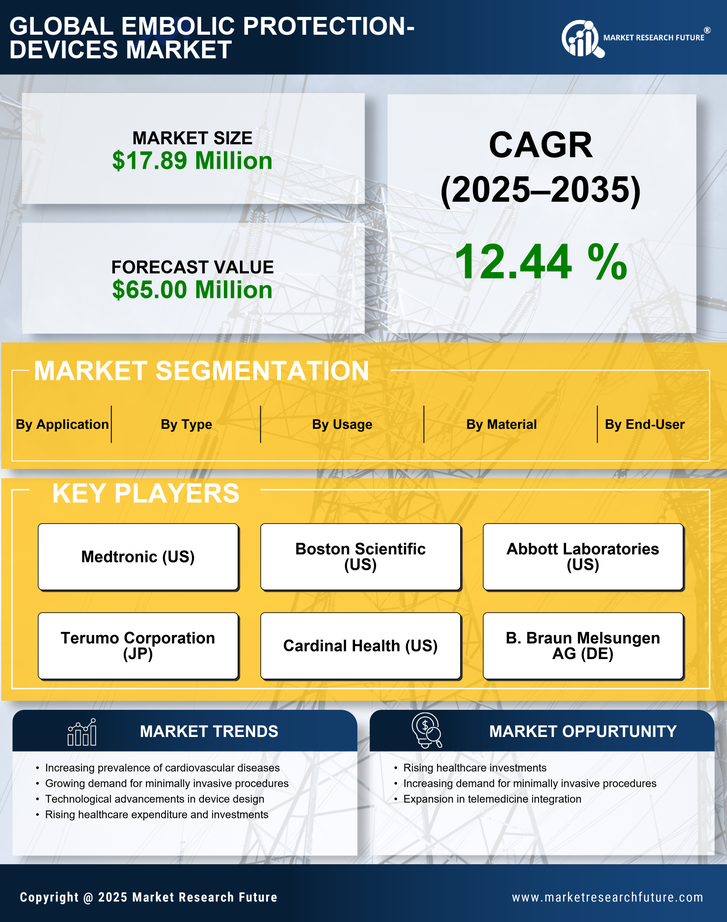
- Distal Filter Device
- Distal Occlusion Device
- Proximal Occlusion Device
Food, Beverages & Nutrition By Material (USD Million, 2025-2035)
- Nitinol
- Polyurethane
Food, Beverages & Nutrition By Usage (USD Million, 2025-2035)
- Disposable Device
- Re-Usable Device
Food, Beverages & Nutrition By Application (USD Million, 2025-2035)
- Cardiovascular Diseases
- Coronary Artery Diseases
- Trans Catheter Aortic Valve Replacement
- Saphenous Vein Graft Diseases
- Neurovascular Diseases
- Peripheral Vascular Diseases
Food, Beverages & Nutrition By End-User (USD Million, 2025-2035)
- Hospitals & Clinics
- Ambulatory Surgical Centers
- Specialty Centers


