×
  • Cat-intel
  • MedIntelliX
  • Resources
  • About Us
  • Hero Background
    English
    Chinese
    French
    Japanese
    Korean
    German
    Spanish

    Image Sensor Market Share

    ID: MRFR/SEM/0351-HCR
    100 Pages
    Ankit Gupta
    October 2025

    Image Sensor Market Research Report Information By Technology (CMOS, CCD, And sCMOS), By Linearity (Linear And Non-Linear), By Spectrum (Visible Spectrum And Invisible Spectrum), By Application (Consumer Electronics, Automobile, Surveillance, Medical, And Others) And By Region (North America, Europe, Asia-Pacific, And Rest Of The World) –Industry Size, Share and Trends Till 2032

    Share:
    Download PDF ×

    We do not share your information with anyone. However, we may send you emails based on your report interest from time to time. You may contact us at any time to opt-out.

    Image Sensor Market Infographic
    Purchase Options

    Market Share

    Image Sensor Market Share Analysis

    The Image Sensor Market is a highly competitive and dynamic industry, witnessing continuous technological advancements and evolving consumer demands. Within this environment, different market share positioning strategies are used by companies to acquire a competitive advantage and increase their market presence. Differentiation is one of the common approaches wherein companies emphasis on providing distinctive and superior functionality in image sensors. This can be in the form of better resolutions, increased sensitivity or new technologies such as back-illuminated sensors. To emphasize these unique features, such companies want to attract those clients who need modern innovations and establish themselves as leaders in some markets.

    Another important strategy implemented by companies in the Image Sensor Market is cost leadership. Other companies concentrate on improving manufacturing procedures and lowering the price of image sensors for better affordability. This approach seeks to attract a wider group of consumers including in price-sensitive markets and increase the overall market share by making it more affordable. Cost leadership is only achieved through effective supply chain management and attention to the quality of products despite cost limitations.

    Companies also find a focus strategy, focusing on particular applications or sectors of the broader Image Sensor Market. For instance, a company may focus on manufacturing image sensors for medical imaging systems or automotive applications or as used in security surveillance. However, this selective strategy enables companies to develop products that meet the specific demands of a particular niche by deploying solutions compliant with customer needs. Specializing in particular segments, companies may establish a high-quality reputation and obtain huge market shares for those areas.

    Market Share Positioning in the Image Sensor market includes collaboration and partnerships. Companies then usually forge strategic partnerships with camera builders, smartphone developers or other high tech competitors to embed their image sensors into an expanded product line. These collaborations result to co-investment projects which guarantee that image sensors are smoothly incorporated in the most recent devices. Through partnerships with major players in the linked industries, firms can capitalize on each other’s strengths and setup a variety of solutions that would broaden market coverage and serve to build up an establishment.

    Innovation is the soul of Image Sensor Market, and companies who follow R & D become leaders in competition. Keeping these advantages ahead of competition, it is necessary to further advance the sensor technology as well as search for new materials and create smaller, more energy-efficient sensors. Innovations such as 3D sensing, time-of-flight sensors, and stacked sensor architectures contribute to companies' market share by offering solutions that meet emerging industry demands and trends.

    Author
    Ankit Gupta
    Senior Research Analyst

    Ankit Gupta is an analyst in market research industry in ICT and SEMI industry. With post-graduation in "Telecom and Marketing Management" and graduation in "Electronics and Telecommunication" vertical he is well versed with recent development in ICT industry as a whole. Having worked on more than 150+ reports including consultation for fortune 500 companies such as Microsoft and Rio Tinto in identifying solutions with respect to business problems his opinions are inclined towards mixture of technical and managerial aspects.

    Leave a Comment

    FAQs

    What is the projected market valuation of the Image Sensor Market by 2035?

    The Image Sensor Market is projected to reach a valuation of 53.75 USD Billion by 2035.

    What was the overall market valuation of the Image Sensor Market in 2024?

    In 2024, the overall market valuation of the Image Sensor Market was 22.13 USD Billion.

    What is the expected CAGR for the Image Sensor Market during the forecast period 2025 - 2035?

    The expected CAGR for the Image Sensor Market during the forecast period 2025 - 2035 is 8.4%.

    Which technology segment is anticipated to have the highest growth in the Image Sensor Market?

    The CMOS technology segment is anticipated to grow from 14.38 USD Billion in 2024 to 35.5 USD Billion by 2035.

    How does the valuation of the Consumer Electronics application segment compare to others in 2024?

    In 2024, the Consumer Electronics application segment was valued at 10.0 USD Billion, making it the largest segment.

    What are the projected values for the Linear optical format segment by 2035?

    The Linear optical format segment is projected to grow from 13.3 USD Billion in 2024 to 32.75 USD Billion by 2035.

    Market Summary

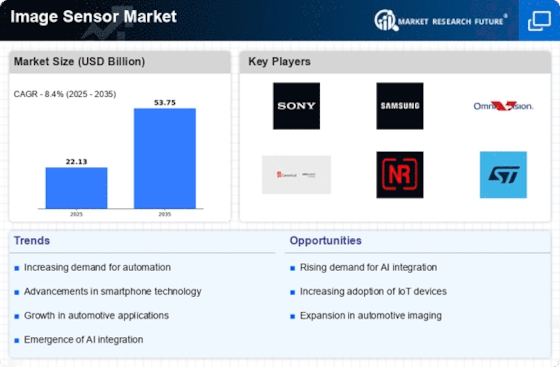
    As per MRFR analysis, the Image Sensor Market Size was estimated at 22.13 USD Billion in 2024. The Image Sensor industry is projected to grow from 23.99 USD Billion in 2025 to 53.75 USD Billion by 2035, exhibiting a compound annual growth rate (CAGR) of 8.4 during the forecast period 2025 - 2035.

    Key Market Trends & Highlights

    The Image Sensor Market is poised for substantial growth driven by technological advancements and increasing applications across various sectors.

    • North America remains the largest market for image sensors, driven by robust demand in consumer electronics and automotive applications.
    • Asia-Pacific is the fastest-growing region, reflecting a surge in technological adoption and innovation in imaging solutions.
    • CMOS sensors dominate the market due to their efficiency and cost-effectiveness, while CCD sensors are experiencing rapid growth in specialized applications.
    • Key market drivers include the rising demand for consumer electronics and the expansion of automotive applications, which are significantly influencing market dynamics.

    Market Size & Forecast

    2024 Market Size 22.13 (USD Billion)
    2035 Market Size 53.75 (USD Billion)
    CAGR (2025 - 2035) 8.4%
    Largest Regional Market Share in 2024 North America

    Major Players

    <p>Sony (JP), Samsung (KR), OmniVision Technologies (US), Canon (JP), Nikon (JP), STMicroelectronics (FR), ON Semiconductor (US), Panasonic (JP), Teledyne Technologies (US)</p>

    Market Trends

    The Image Sensor Market is currently experiencing a transformative phase, driven by advancements in technology and increasing demand across various sectors. The proliferation of smart devices, including smartphones, tablets, and security cameras, has significantly contributed to the growth of this market. As consumers seek enhanced imaging capabilities, manufacturers are compelled to innovate, leading to the development of high-resolution sensors that offer superior performance. Furthermore, the integration of artificial intelligence in imaging technology appears to be reshaping the landscape, enabling features such as facial recognition and improved low-light performance. This evolution suggests a shift towards more sophisticated applications, particularly in automotive and healthcare sectors, where image sensors play a crucial role in enhancing safety and diagnostic capabilities. In addition to technological advancements, the Image Sensor Market is also influenced by changing consumer preferences and regulatory frameworks. The increasing emphasis on sustainability and energy efficiency is prompting manufacturers to explore eco-friendly materials and production processes. This trend indicates a growing awareness of environmental impacts, which may drive innovation in sensor design and functionality. As the market continues to evolve, it is likely that collaboration between technology firms and regulatory bodies will become essential in addressing challenges related to privacy and data security. Overall, the Image Sensor Market is poised for substantial growth, characterized by dynamic shifts in technology and consumer behavior.

    Technological Advancements

    The Image Sensor Market is witnessing rapid technological advancements, particularly in sensor resolution and processing capabilities. Innovations such as stacked sensor designs and enhanced pixel architectures are enabling higher image quality and faster processing speeds. This trend is likely to enhance user experiences across various applications, from consumer electronics to industrial automation.

    Integration of AI Technologies

    The integration of artificial intelligence into image sensing technology is becoming increasingly prevalent. AI algorithms are being utilized to improve image recognition, enhance low-light performance, and enable real-time processing. This trend suggests a future where image sensors are not merely passive devices but active participants in data analysis and decision-making.

    Sustainability Initiatives

    Sustainability initiatives are gaining traction within the Image Sensor Market, as manufacturers seek to reduce their environmental footprint. This includes the adoption of eco-friendly materials and energy-efficient production methods. Such efforts indicate a broader commitment to sustainability, which may influence consumer preferences and regulatory compliance.

    Image Sensor Market Market Drivers

    Expansion of Automotive Applications

    The Image Sensor Market is significantly influenced by the expansion of automotive applications, particularly in the realm of advanced driver-assistance systems (ADAS). As vehicles increasingly adopt features such as lane departure warnings, automatic emergency braking, and parking assistance, the demand for high-performance image sensors rises. In 2025, the automotive segment is expected to account for over 15 percent of the total image sensor market, driven by the need for enhanced safety and automation in vehicles. This trend suggests that manufacturers are likely to invest in developing specialized image sensors tailored for automotive applications, thereby propelling growth within the Image Sensor Market. The integration of image sensors in vehicles not only improves safety but also enhances the overall driving experience.

    Advancements in Industrial Automation

    The Image Sensor Market is significantly impacted by advancements in industrial automation. As industries increasingly adopt automation technologies to enhance efficiency and productivity, the demand for image sensors in various applications, such as quality control and robotics, is expected to rise. In 2025, the industrial segment is projected to account for a substantial share of the image sensor market, driven by the need for precise imaging in automated processes. This trend suggests that manufacturers may focus on developing specialized image sensors that cater to the unique requirements of industrial applications, thereby fostering growth within the Image Sensor Market. The integration of image sensors in automation not only improves operational efficiency but also enhances product quality.

    Rising Demand for Consumer Electronics

    The Image Sensor Market experiences a notable surge in demand driven by the proliferation of consumer electronics. Devices such as smartphones, tablets, and digital cameras increasingly incorporate advanced image sensors to enhance image quality and user experience. In 2025, the market for image sensors in consumer electronics is projected to reach approximately 20 billion USD, reflecting a compound annual growth rate of around 8 percent. This growth is largely attributed to the consumer preference for high-resolution imaging capabilities, which necessitates the integration of sophisticated image sensors. As manufacturers strive to meet these expectations, the Image Sensor Market is likely to witness continuous innovation and development, further solidifying its position in the electronics sector.

    Emergence of Medical Imaging Technologies

    The Image Sensor Market is experiencing a transformative phase with the emergence of medical imaging technologies. As healthcare providers increasingly adopt advanced imaging solutions for diagnostics and treatment, the demand for high-quality image sensors in medical devices is on the rise. The market for medical imaging sensors is anticipated to grow significantly, with projections indicating a value of approximately 3 billion USD by 2025. This growth is driven by the need for precise imaging in applications such as endoscopy, ultrasound, and MRI. The Image Sensor Market is likely to benefit from ongoing research and development efforts aimed at enhancing sensor performance and miniaturization, which could lead to more efficient and effective medical imaging solutions.

    Growth in Surveillance and Security Systems

    The Image Sensor Market is poised for growth due to the increasing demand for surveillance and security systems. As concerns regarding safety and security escalate, both residential and commercial sectors are investing in advanced surveillance technologies. The market for image sensors in security applications is projected to grow at a rate of 10 percent annually, reaching an estimated value of 5 billion USD by 2025. This growth is fueled by the need for high-resolution imaging capabilities in security cameras, which rely on sophisticated image sensors to capture clear and detailed footage. Consequently, the Image Sensor Market is likely to see a surge in innovation, with manufacturers focusing on developing sensors that offer enhanced performance in low-light conditions and improved image processing capabilities.

    Market Segment Insights

    By Technology: CMOS (Largest) vs. CCD (Fastest-Growing)

    <p>The Image Sensor Market is predominantly driven by the CMOS (Complementary Metal-Oxide-Semiconductor) technology, which accounts for the largest share due to its low power consumption, compact size, and ability to produce high-quality images. The sCMOS (scientific CMOS) technology follows closely, favored in high-speed applications and scientific endeavors. CCD (Charge-Coupled Device) sensors, though historically popular, have seen a decline in market share as CMOS technology advances and improves. The growth trends in the Image Sensor Market indicate a significant shift towards CMOS technology, which is characterized by rapid innovation in smartphone and automotive applications, among others. CCD technology, while seeing dwindling dominance, is emerging in niche markets, particularly in high-end imaging applications. As consumer demand for superior image quality escalates, sCMOS is also expected to gain traction in research and medical fields, driving the technological advancement in the sector.</p>

    <p>Technology: CMOS (Dominant) vs. CCD (Emerging)</p>

    <p>In the Image Sensor Market, CMOS technology stands as the dominant player, known for its versatility and efficiency, making it the preferred choice in consumer electronics, including smartphones and cameras. CMOS sensors provide faster readout speeds and lower power consumption, aligning with the increasing demand for energy-efficient devices. On the other hand, CCD technology, while categorized as emerging, still holds value in specific high-performance applications such as astronomy and high-end broadcast imaging, where image quality is crucial. The evolution of CCD technology, including developments in back-illuminated designs, seeks to regain some market share by enhancing its competitive edge against CMOS. As both technologies evolve, their respective roles within various market segments will continue to adapt to changing consumer preferences and technological advances.</p>

    By Optical Format: Non-Linear (Largest) vs. Linear (Fastest-Growing)

    <p>The Image Sensor Market is currently dominated by the Non-Linear optical format, which has established itself as the largest segment due to its widespread application in various imaging technologies. Non-Linear sensors are preferred in consumer electronics, security systems, and automotive applications, contributing significantly to their market share. In contrast, the Linear optical format, while smaller in comparison, is rapidly gaining traction, especially in industrial and scientific imaging. The demand for high-resolution imaging in these sectors is driving the growth of Linear image sensors, indicating a promising future.</p>

    <p>Non-Linear (Dominant) vs. Linear (Emerging)</p>

    <p>Non-Linear image sensors are characterized by their ability to capture images with varying exposure levels, making them ideal for applications requiring high dynamic range. This technology is prevalent in smartphones, digital cameras, and surveillance systems, where versatility and performance are essential. Conversely, Linear image sensors are emerging as a key player in applications such as barcode scanning, machine vision, and high-speed imaging, where their linear response to light intensity allows for precise measurements. The distinct advantages of both formats cater to different market needs, with Non-Linear sensors dominating the mainstream market while Linear sensors carve a niche in specialized applications.</p>

    By Spectrum: Visible Spectrum (Largest) vs. Invisible Spectrum (Fastest-Growing)

    <p>In the Image Sensor Market, the Visible Spectrum holds the largest market share, driven by its widespread adoption in consumer electronics such as cameras, smartphones, and security systems. This segment's dominance can be attributed to its established technology and strong demand for high-quality imaging solutions. Conversely, the Invisible Spectrum is gaining traction, thanks to advancements in technology and increasing applications in industries such as surveillance, automation, and medical imaging. This shift towards the Invisible Spectrum indicates a diversification of end-user applications and enhanced capabilities of image sensors.</p>

    <p>Spectrum: Visible (Dominant) vs. Invisible (Emerging)</p>

    <p>The Visible Spectrum segment is characterized by high-quality imaging capabilities and a wide range of applications, making it the dominant force in the Image Sensor Market. It has been extensively integrated into devices like digital cameras, smartphones, and professional video equipment, driving consistent demand. In contrast, the Invisible Spectrum is emerging rapidly, primarily due to its applications in specialized fields such as thermal imaging, near-infrared imaging, and machine vision. This segment is becoming increasingly relevant as industries discover the potential of invisible wavelengths for improved performance in low-light conditions and complex imaging tasks. The advancements in sensor technology are fueling growth in this segment, making it an exciting area to watch.</p>

    By Application: Surveillance (Largest) vs. Medical (Fastest-Growing)

    <p>In the Image Sensor Market, the application segments are diverse, with Surveillance holding the largest market share. This dominance can be attributed to the increasing demand for security and monitoring systems globally. As urbanization and crime rates rise, the utilization of image sensors in surveillance systems has surged, making it a critical component in maintaining public safety. Following closely, the Medical segment is gaining traction due to technological advancements in diagnostic imaging and minimally invasive procedures, thereby expanding its footprint in the overall market.</p>

    <p>Medical: Diagnostics (Dominant) vs. Surveillance: Security (Emerging)</p>

    <p>The Medical application of image sensors is primarily focused on diagnostics, where high-resolution imaging is crucial for accurate disease detection and treatment planning. As healthcare continues to innovate, the integration of advanced imaging technologies such as MRI and CT scans is rising, enhancing the effectiveness of diagnostics. In contrast, the Surveillance sector, while dominant, is evolving with emerging technologies such as AI and machine learning. These advancements are driving the demand for smarter security solutions, thereby creating a competitive edge in the market. Together, these segments reflect a dynamic interplay between traditional applications and cutting-edge technological innovations, shaping the future of the Image Sensor Market.</p>

    Get more detailed insights about Image Sensor Market Research Report - Global Forecast till 2035

    Regional Insights

    North America : Technology and Innovation Hub

    North America is the largest market for image sensors, holding approximately 40% of the global share. The region's growth is driven by advancements in consumer electronics, automotive applications, and security systems. Regulatory support for technology innovation and investment in R&D further catalyze market expansion. The demand for high-resolution imaging in smartphones and surveillance systems is particularly strong, contributing to robust market dynamics. The United States is the leading country in this region, with major players like OmniVision Technologies and ON Semiconductor headquartered here. The competitive landscape is characterized by continuous innovation and strategic partnerships among key players such as Sony and Canon. The presence of advanced manufacturing facilities and a strong consumer base enhances the region's market position, making it a focal point for image sensor development.

    Europe : Emerging Technology Landscape

    Europe is witnessing significant growth in the image sensor market, accounting for approximately 25% of the global share. The region's demand is fueled by the increasing adoption of image sensors in automotive, healthcare, and industrial applications. Regulatory frameworks promoting digital transformation and sustainability are also key drivers. Countries like Germany and France are at the forefront, pushing for innovation in imaging technologies and smart devices. Germany leads the market in Europe, with a strong presence of companies like STMicroelectronics and Panasonic. The competitive landscape is marked by collaborations between tech firms and automotive manufacturers to enhance imaging capabilities in vehicles. Additionally, the European market is characterized by a focus on high-quality imaging solutions, driven by consumer demand for advanced photography and video capabilities in smartphones and cameras.

    Asia-Pacific : Emerging Powerhouse in Imaging

    Asia-Pacific is rapidly emerging as a powerhouse in the image sensor market, holding around 30% of the global share. The region's growth is primarily driven by the booming consumer electronics sector, particularly in countries like China, Japan, and South Korea. The increasing demand for high-resolution cameras in smartphones and the rise of AI-driven applications are significant catalysts for market expansion. Government initiatives supporting technology development further enhance the region's growth prospects. China is the largest market in Asia-Pacific, with major players like Sony and Samsung leading the charge. The competitive landscape is characterized by aggressive innovation and price competition among local and international firms. Japan also plays a crucial role, with companies like Canon and Nikon focusing on high-end imaging solutions. The presence of a robust supply chain and manufacturing capabilities positions the region favorably for future growth in the image sensor market.

    Middle East and Africa : Resource-Rich Frontier

    The Middle East and Africa region is gradually emerging in the image sensor market, holding about 5% of the global share. The growth is driven by increasing investments in smart city projects and advancements in security systems. Regulatory support for technology adoption and infrastructure development is fostering demand for image sensors in various applications, including surveillance and automotive. Countries like the UAE and South Africa are leading this growth trajectory. The UAE is at the forefront, with significant investments in technology and innovation. The competitive landscape is still developing, with local firms beginning to collaborate with international players to enhance their offerings. The presence of key global companies is also increasing, as they seek to tap into the growing demand for advanced imaging solutions in the region, particularly in urban development and security sectors.

    Key Players and Competitive Insights

    The Image Sensor Market is currently characterized by a dynamic competitive landscape, driven by rapid technological advancements and increasing demand across various sectors, including consumer electronics, automotive, and industrial applications. Major players such as Sony (Japan), Samsung (South Korea), and OmniVision Technologies (United States) are at the forefront, each adopting distinct strategies to enhance their market positioning. Sony (Japan) continues to leverage its strong brand reputation and innovation capabilities, focusing on high-performance sensors for smartphones and professional cameras. Meanwhile, Samsung (South Korea) emphasizes vertical integration and advanced manufacturing techniques to optimize production efficiency and reduce costs, thereby enhancing its competitive edge. OmniVision Technologies (United States) appears to be concentrating on niche markets, particularly in the automotive and medical sectors, which may provide them with unique growth opportunities.

    The competitive structure of the Image Sensor Market is moderately fragmented, with several key players exerting substantial influence. Companies are increasingly localizing manufacturing to mitigate supply chain disruptions and enhance responsiveness to regional demands. This tactic not only optimizes operational efficiency but also aligns with the growing trend of sustainability, as firms seek to reduce their carbon footprints. The collective influence of these key players shapes a competitive environment where innovation and strategic partnerships are paramount.

    In August 2025, Sony (Japan) announced the launch of its latest image sensor technology, which boasts enhanced low-light performance and faster processing speeds. This development is strategically significant as it positions Sony to capture a larger share of the high-end smartphone market, where consumers increasingly prioritize camera quality. The introduction of this technology may also reinforce Sony's leadership in the professional imaging sector, where superior performance is critical.

    In September 2025, Samsung (South Korea) revealed its plans to invest in a new semiconductor fabrication facility in the United States, aimed at bolstering its image sensor production capabilities. This strategic move is likely to enhance Samsung's supply chain resilience while also catering to the growing demand for advanced sensors in the North American market. By establishing a local manufacturing presence, Samsung may not only reduce lead times but also strengthen its relationships with key customers in the region.

    In July 2025, OmniVision Technologies (United States) entered into a partnership with a leading automotive manufacturer to develop advanced driver-assistance systems (ADAS) utilizing their latest image sensor technology. This collaboration underscores OmniVision's strategic focus on the automotive sector, where the demand for high-quality imaging solutions is surging. By aligning with a prominent player in the automotive industry, OmniVision may enhance its market visibility and accelerate the adoption of its innovative technologies.

    As of October 2025, the Image Sensor Market is witnessing trends that emphasize digitalization, sustainability, and the integration of artificial intelligence. Companies are increasingly forming strategic alliances to leverage complementary strengths, thereby enhancing their competitive positioning. The shift from price-based competition to a focus on innovation and technology is evident, as firms prioritize the development of advanced imaging solutions that meet evolving consumer demands. Moving forward, competitive differentiation is likely to hinge on the ability to deliver cutting-edge technology, reliable supply chains, and sustainable practices.

    Key Companies in the Image Sensor Market market include

    Industry Developments

    • Q2 2025: Prophesee and Sony develop stacked ‘event-based’ vision sensor Prophesee and Sony announced the development of a new stacked event-based vision sensor, marking a significant product innovation in the image sensor market.
    • Q2 2025: STMicroelectronics and Metalenz partner to drive metasurface optics adoption STMicroelectronics entered a partnership with Metalenz to accelerate the adoption of metasurface optics in image sensor applications, aiming to enhance sensor performance and miniaturization.
    • Q2 2025: Sony targets automotive cameras with high-definition CMOS image sensor Sony launched a new high-definition CMOS image sensor specifically designed for automotive camera applications, expanding its product portfolio in the automotive sector.
    • Q2 2025: Prophesee's sensors proliferate with industrial partners Prophesee reported increased adoption of its event-based image sensors through new collaborations with multiple industrial partners, supporting broader deployment in machine vision.
    • Q2 2025: SmartSens experienced a dramatic +105.7% YoY revenue increase, breaking into mobile, security, and automotive markets and climbing in global rankings SmartSens achieved a 105.7% year-over-year revenue increase, driven by its expansion into mobile, security, and automotive image sensor markets, and advanced in global market rankings.
    • Q2 2025: SK Hynix is retaining only legacy products to refocus its core activities on memory SK Hynix announced a strategic shift, retaining only legacy image sensor products as it refocuses its business on core memory activities.
    • Q2 2025: Samsung maintained stable revenue, while STMicroelectronics and onsemi lost market share Samsung reported stable revenue in its image sensor business, while STMicroelectronics and onsemi experienced a decline in market share.
    • Q2 2025: US and European players may continue losing ground, while Sony and Chinese suppliers are expected to expand further in 2025 Industry analysts project that US and European image sensor companies may continue to lose market share, while Sony and Chinese suppliers are expected to expand their presence in 2025.
    • Q2 2025: Looking ahead, Sony, Omnivision, and SmartSens are projected to grow revenues based on early 2025 performance Early 2025 performance data indicates that Sony, Omnivision, and SmartSens are on track for revenue growth in the image sensor market.

    Future Outlook

    Image Sensor Market Future Outlook

    <p>The Image Sensor Market is projected to grow at an 8.4% CAGR from 2024 to 2035, driven by advancements in AI, automotive applications, and consumer electronics.</p>

    New opportunities lie in:

    • <p>Development of high-resolution sensors for autonomous vehicles</p>
    • <p>Integration of AI capabilities in imaging solutions</p>
    • <p>Expansion into emerging markets with tailored sensor products</p>

    <p>By 2035, the Image Sensor Market is expected to achieve substantial growth and innovation.</p>

    Market Segmentation

    Image Sensor Market Spectrum Outlook

    • Invisible Spectrum
    • Visible Spectrum

    Image Sensor Market Technology Outlook

    • sCMOS
    • CCD
    • CMOS

    Image Sensor Market Application Outlook

    • Medical
    • Surveillance
    • Automobile
    • Consumer Electronics
    • Others

    Image Sensor Market Optical Format Outlook

    • Non-Linear
    • Linear

    Report Scope

    MARKET SIZE 202422.13(USD Billion)
    MARKET SIZE 202523.99(USD Billion)
    MARKET SIZE 203553.75(USD Billion)
    COMPOUND ANNUAL GROWTH RATE (CAGR)8.4% (2024 - 2035)
    REPORT COVERAGERevenue Forecast, Competitive Landscape, Growth Factors, and Trends
    BASE YEAR2024
    Market Forecast Period2025 - 2035
    Historical Data2019 - 2024
    Market Forecast UnitsUSD Billion
    Key Companies ProfiledMarket analysis in progress
    Segments CoveredMarket segmentation analysis in progress
    Key Market OpportunitiesAdvancements in artificial intelligence enhance capabilities and demand in the Image Sensor Market.
    Key Market DynamicsTechnological advancements drive competition in the image sensor market, enhancing performance and reducing costs.
    Countries CoveredNorth America, Europe, APAC, South America, MEA

    FAQs

    What is the projected market valuation of the Image Sensor Market by 2035?

    The Image Sensor Market is projected to reach a valuation of 53.75 USD Billion by 2035.

    What was the overall market valuation of the Image Sensor Market in 2024?

    In 2024, the overall market valuation of the Image Sensor Market was 22.13 USD Billion.

    What is the expected CAGR for the Image Sensor Market during the forecast period 2025 - 2035?

    The expected CAGR for the Image Sensor Market during the forecast period 2025 - 2035 is 8.4%.

    Which technology segment is anticipated to have the highest growth in the Image Sensor Market?

    The CMOS technology segment is anticipated to grow from 14.38 USD Billion in 2024 to 35.5 USD Billion by 2035.

    How does the valuation of the Consumer Electronics application segment compare to others in 2024?

    In 2024, the Consumer Electronics application segment was valued at 10.0 USD Billion, making it the largest segment.

    What are the projected values for the Linear optical format segment by 2035?

    The Linear optical format segment is projected to grow from 13.3 USD Billion in 2024 to 32.75 USD Billion by 2035.

    1. SECTION I: EXECUTIVE SUMMARY AND KEY HIGHLIGHTS
      1. | 1.1 EXECUTIVE SUMMARY
      2. | | 1.1.1 Market Overview
      3. | | 1.1.2 Key Findings
      4. | | 1.1.3 Market Segmentation
      5. | | 1.1.4 Competitive Landscape
      6. | | 1.1.5 Challenges and Opportunities
      7. | | 1.1.6 Future Outlook
    2. SECTION II: SCOPING, METHODOLOGY AND MARKET STRUCTURE
      1. | 2.1 MARKET INTRODUCTION
      2. | | 2.1.1 Definition
      3. | | 2.1.2 Scope of the study
      4. | | | 2.1.2.1 Research Objective
      5. | | | 2.1.2.2 Assumption
      6. | | | 2.1.2.3 Limitations
      7. | 2.2 RESEARCH METHODOLOGY
      8. | | 2.2.1 Overview
      9. | | 2.2.2 Data Mining
      10. | | 2.2.3 Secondary Research
      11. | | 2.2.4 Primary Research
      12. | | | 2.2.4.1 Primary Interviews and Information Gathering Process
      13. | | | 2.2.4.2 Breakdown of Primary Respondents
      14. | | 2.2.5 Forecasting Model
      15. | | 2.2.6 Market Size Estimation
      16. | | | 2.2.6.1 Bottom-Up Approach
      17. | | | 2.2.6.2 Top-Down Approach
      18. | | 2.2.7 Data Triangulation
      19. | | 2.2.8 Validation
    3. SECTION III: QUALITATIVE ANALYSIS
      1. | 3.1 MARKET DYNAMICS
      2. | | 3.1.1 Overview
      3. | | 3.1.2 Drivers
      4. | | 3.1.3 Restraints
      5. | | 3.1.4 Opportunities
      6. | 3.2 MARKET FACTOR ANALYSIS
      7. | | 3.2.1 Value chain Analysis
      8. | | 3.2.2 Porter's Five Forces Analysis
      9. | | | 3.2.2.1 Bargaining Power of Suppliers
      10. | | | 3.2.2.2 Bargaining Power of Buyers
      11. | | | 3.2.2.3 Threat of New Entrants
      12. | | | 3.2.2.4 Threat of Substitutes
      13. | | | 3.2.2.5 Intensity of Rivalry
      14. | | 3.2.3 COVID-19 Impact Analysis
      15. | | | 3.2.3.1 Market Impact Analysis
      16. | | | 3.2.3.2 Regional Impact
      17. | | | 3.2.3.3 Opportunity and Threat Analysis
    4. SECTION IV: QUANTITATIVE ANALYSIS
      1. | 4.1 Semiconductor & Electronics, BY Technology (USD Billion)
      2. | | 4.1.1 sCMOS
      3. | | 4.1.2 CCD
      4. | | 4.1.3 CMOS
      5. | 4.2 Semiconductor & Electronics, BY Optical Format (USD Billion)
      6. | | 4.2.1 Non-Linear
      7. | | 4.2.2 Linear
      8. | 4.3 Semiconductor & Electronics, BY Spectrum (USD Billion)
      9. | | 4.3.1 Invisible Spectrum
      10. | | 4.3.2 Visible Spectrum
      11. | 4.4 Semiconductor & Electronics, BY Application (USD Billion)
      12. | | 4.4.1 Medical
      13. | | 4.4.2 Surveillance
      14. | | 4.4.3 Automobile
      15. | | 4.4.4 Consumer Electronics
      16. | | 4.4.5 Others
      17. | 4.5 Semiconductor & Electronics, BY Region (USD Billion)
      18. | | 4.5.1 North America
      19. | | | 4.5.1.1 US
      20. | | | 4.5.1.2 Canada
      21. | | 4.5.2 Europe
      22. | | | 4.5.2.1 Germany
      23. | | | 4.5.2.2 UK
      24. | | | 4.5.2.3 France
      25. | | | 4.5.2.4 Russia
      26. | | | 4.5.2.5 Italy
      27. | | | 4.5.2.6 Spain
      28. | | | 4.5.2.7 Rest of Europe
      29. | | 4.5.3 APAC
      30. | | | 4.5.3.1 China
      31. | | | 4.5.3.2 India
      32. | | | 4.5.3.3 Japan
      33. | | | 4.5.3.4 South Korea
      34. | | | 4.5.3.5 Malaysia
      35. | | | 4.5.3.6 Thailand
      36. | | | 4.5.3.7 Indonesia
      37. | | | 4.5.3.8 Rest of APAC
      38. | | 4.5.4 South America
      39. | | | 4.5.4.1 Brazil
      40. | | | 4.5.4.2 Mexico
      41. | | | 4.5.4.3 Argentina
      42. | | | 4.5.4.4 Rest of South America
      43. | | 4.5.5 MEA
      44. | | | 4.5.5.1 GCC Countries
      45. | | | 4.5.5.2 South Africa
      46. | | | 4.5.5.3 Rest of MEA
    5. SECTION V: COMPETITIVE ANALYSIS
      1. | 5.1 Competitive Landscape
      2. | | 5.1.1 Overview
      3. | | 5.1.2 Competitive Analysis
      4. | | 5.1.3 Market share Analysis
      5. | | 5.1.4 Major Growth Strategy in the Semiconductor & Electronics
      6. | | 5.1.5 Competitive Benchmarking
      7. | | 5.1.6 Leading Players in Terms of Number of Developments in the Semiconductor & Electronics
      8. | | 5.1.7 Key developments and growth strategies
      9. | | | 5.1.7.1 New Product Launch/Service Deployment
      10. | | | 5.1.7.2 Merger & Acquisitions
      11. | | | 5.1.7.3 Joint Ventures
      12. | | 5.1.8 Major Players Financial Matrix
      13. | | | 5.1.8.1 Sales and Operating Income
      14. | | | 5.1.8.2 Major Players R&D Expenditure. 2023
      15. | 5.2 Company Profiles
      16. | | 5.2.1 Sony (JP)
      17. | | | 5.2.1.1 Financial Overview
      18. | | | 5.2.1.2 Products Offered
      19. | | | 5.2.1.3 Key Developments
      20. | | | 5.2.1.4 SWOT Analysis
      21. | | | 5.2.1.5 Key Strategies
      22. | | 5.2.2 Samsung (KR)
      23. | | | 5.2.2.1 Financial Overview
      24. | | | 5.2.2.2 Products Offered
      25. | | | 5.2.2.3 Key Developments
      26. | | | 5.2.2.4 SWOT Analysis
      27. | | | 5.2.2.5 Key Strategies
      28. | | 5.2.3 OmniVision Technologies (US)
      29. | | | 5.2.3.1 Financial Overview
      30. | | | 5.2.3.2 Products Offered
      31. | | | 5.2.3.3 Key Developments
      32. | | | 5.2.3.4 SWOT Analysis
      33. | | | 5.2.3.5 Key Strategies
      34. | | 5.2.4 Canon (JP)
      35. | | | 5.2.4.1 Financial Overview
      36. | | | 5.2.4.2 Products Offered
      37. | | | 5.2.4.3 Key Developments
      38. | | | 5.2.4.4 SWOT Analysis
      39. | | | 5.2.4.5 Key Strategies
      40. | | 5.2.5 Nikon (JP)
      41. | | | 5.2.5.1 Financial Overview
      42. | | | 5.2.5.2 Products Offered
      43. | | | 5.2.5.3 Key Developments
      44. | | | 5.2.5.4 SWOT Analysis
      45. | | | 5.2.5.5 Key Strategies
      46. | | 5.2.6 STMicroelectronics (FR)
      47. | | | 5.2.6.1 Financial Overview
      48. | | | 5.2.6.2 Products Offered
      49. | | | 5.2.6.3 Key Developments
      50. | | | 5.2.6.4 SWOT Analysis
      51. | | | 5.2.6.5 Key Strategies
      52. | | 5.2.7 ON Semiconductor (US)
      53. | | | 5.2.7.1 Financial Overview
      54. | | | 5.2.7.2 Products Offered
      55. | | | 5.2.7.3 Key Developments
      56. | | | 5.2.7.4 SWOT Analysis
      57. | | | 5.2.7.5 Key Strategies
      58. | | 5.2.8 Panasonic (JP)
      59. | | | 5.2.8.1 Financial Overview
      60. | | | 5.2.8.2 Products Offered
      61. | | | 5.2.8.3 Key Developments
      62. | | | 5.2.8.4 SWOT Analysis
      63. | | | 5.2.8.5 Key Strategies
      64. | | 5.2.9 Teledyne Technologies (US)
      65. | | | 5.2.9.1 Financial Overview
      66. | | | 5.2.9.2 Products Offered
      67. | | | 5.2.9.3 Key Developments
      68. | | | 5.2.9.4 SWOT Analysis
      69. | | | 5.2.9.5 Key Strategies
      70. | 5.3 Appendix
      71. | | 5.3.1 References
      72. | | 5.3.2 Related Reports
    6. LIST OF FIGURES
      1. | 6.1 MARKET SYNOPSIS
      2. | 6.2 NORTH AMERICA MARKET ANALYSIS
      3. | 6.3 US MARKET ANALYSIS BY TECHNOLOGY
      4. | 6.4 US MARKET ANALYSIS BY OPTICAL FORMAT
      5. | 6.5 US MARKET ANALYSIS BY SPECTRUM
      6. | 6.6 US MARKET ANALYSIS BY APPLICATION
      7. | 6.7 CANADA MARKET ANALYSIS BY TECHNOLOGY
      8. | 6.8 CANADA MARKET ANALYSIS BY OPTICAL FORMAT
      9. | 6.9 CANADA MARKET ANALYSIS BY SPECTRUM
      10. | 6.10 CANADA MARKET ANALYSIS BY APPLICATION
      11. | 6.11 EUROPE MARKET ANALYSIS
      12. | 6.12 GERMANY MARKET ANALYSIS BY TECHNOLOGY
      13. | 6.13 GERMANY MARKET ANALYSIS BY OPTICAL FORMAT
      14. | 6.14 GERMANY MARKET ANALYSIS BY SPECTRUM
      15. | 6.15 GERMANY MARKET ANALYSIS BY APPLICATION
      16. | 6.16 UK MARKET ANALYSIS BY TECHNOLOGY
      17. | 6.17 UK MARKET ANALYSIS BY OPTICAL FORMAT
      18. | 6.18 UK MARKET ANALYSIS BY SPECTRUM
      19. | 6.19 UK MARKET ANALYSIS BY APPLICATION
      20. | 6.20 FRANCE MARKET ANALYSIS BY TECHNOLOGY
      21. | 6.21 FRANCE MARKET ANALYSIS BY OPTICAL FORMAT
      22. | 6.22 FRANCE MARKET ANALYSIS BY SPECTRUM
      23. | 6.23 FRANCE MARKET ANALYSIS BY APPLICATION
      24. | 6.24 RUSSIA MARKET ANALYSIS BY TECHNOLOGY
      25. | 6.25 RUSSIA MARKET ANALYSIS BY OPTICAL FORMAT
      26. | 6.26 RUSSIA MARKET ANALYSIS BY SPECTRUM
      27. | 6.27 RUSSIA MARKET ANALYSIS BY APPLICATION
      28. | 6.28 ITALY MARKET ANALYSIS BY TECHNOLOGY
      29. | 6.29 ITALY MARKET ANALYSIS BY OPTICAL FORMAT
      30. | 6.30 ITALY MARKET ANALYSIS BY SPECTRUM
      31. | 6.31 ITALY MARKET ANALYSIS BY APPLICATION
      32. | 6.32 SPAIN MARKET ANALYSIS BY TECHNOLOGY
      33. | 6.33 SPAIN MARKET ANALYSIS BY OPTICAL FORMAT
      34. | 6.34 SPAIN MARKET ANALYSIS BY SPECTRUM
      35. | 6.35 SPAIN MARKET ANALYSIS BY APPLICATION
      36. | 6.36 REST OF EUROPE MARKET ANALYSIS BY TECHNOLOGY
      37. | 6.37 REST OF EUROPE MARKET ANALYSIS BY OPTICAL FORMAT
      38. | 6.38 REST OF EUROPE MARKET ANALYSIS BY SPECTRUM
      39. | 6.39 REST OF EUROPE MARKET ANALYSIS BY APPLICATION
      40. | 6.40 APAC MARKET ANALYSIS
      41. | 6.41 CHINA MARKET ANALYSIS BY TECHNOLOGY
      42. | 6.42 CHINA MARKET ANALYSIS BY OPTICAL FORMAT
      43. | 6.43 CHINA MARKET ANALYSIS BY SPECTRUM
      44. | 6.44 CHINA MARKET ANALYSIS BY APPLICATION
      45. | 6.45 INDIA MARKET ANALYSIS BY TECHNOLOGY
      46. | 6.46 INDIA MARKET ANALYSIS BY OPTICAL FORMAT
      47. | 6.47 INDIA MARKET ANALYSIS BY SPECTRUM
      48. | 6.48 INDIA MARKET ANALYSIS BY APPLICATION
      49. | 6.49 JAPAN MARKET ANALYSIS BY TECHNOLOGY
      50. | 6.50 JAPAN MARKET ANALYSIS BY OPTICAL FORMAT
      51. | 6.51 JAPAN MARKET ANALYSIS BY SPECTRUM
      52. | 6.52 JAPAN MARKET ANALYSIS BY APPLICATION
      53. | 6.53 SOUTH KOREA MARKET ANALYSIS BY TECHNOLOGY
      54. | 6.54 SOUTH KOREA MARKET ANALYSIS BY OPTICAL FORMAT
      55. | 6.55 SOUTH KOREA MARKET ANALYSIS BY SPECTRUM
      56. | 6.56 SOUTH KOREA MARKET ANALYSIS BY APPLICATION
      57. | 6.57 MALAYSIA MARKET ANALYSIS BY TECHNOLOGY
      58. | 6.58 MALAYSIA MARKET ANALYSIS BY OPTICAL FORMAT
      59. | 6.59 MALAYSIA MARKET ANALYSIS BY SPECTRUM
      60. | 6.60 MALAYSIA MARKET ANALYSIS BY APPLICATION
      61. | 6.61 THAILAND MARKET ANALYSIS BY TECHNOLOGY
      62. | 6.62 THAILAND MARKET ANALYSIS BY OPTICAL FORMAT
      63. | 6.63 THAILAND MARKET ANALYSIS BY SPECTRUM
      64. | 6.64 THAILAND MARKET ANALYSIS BY APPLICATION
      65. | 6.65 INDONESIA MARKET ANALYSIS BY TECHNOLOGY
      66. | 6.66 INDONESIA MARKET ANALYSIS BY OPTICAL FORMAT
      67. | 6.67 INDONESIA MARKET ANALYSIS BY SPECTRUM
      68. | 6.68 INDONESIA MARKET ANALYSIS BY APPLICATION
      69. | 6.69 REST OF APAC MARKET ANALYSIS BY TECHNOLOGY
      70. | 6.70 REST OF APAC MARKET ANALYSIS BY OPTICAL FORMAT
      71. | 6.71 REST OF APAC MARKET ANALYSIS BY SPECTRUM
      72. | 6.72 REST OF APAC MARKET ANALYSIS BY APPLICATION
      73. | 6.73 SOUTH AMERICA MARKET ANALYSIS
      74. | 6.74 BRAZIL MARKET ANALYSIS BY TECHNOLOGY
      75. | 6.75 BRAZIL MARKET ANALYSIS BY OPTICAL FORMAT
      76. | 6.76 BRAZIL MARKET ANALYSIS BY SPECTRUM
      77. | 6.77 BRAZIL MARKET ANALYSIS BY APPLICATION
      78. | 6.78 MEXICO MARKET ANALYSIS BY TECHNOLOGY
      79. | 6.79 MEXICO MARKET ANALYSIS BY OPTICAL FORMAT
      80. | 6.80 MEXICO MARKET ANALYSIS BY SPECTRUM
      81. | 6.81 MEXICO MARKET ANALYSIS BY APPLICATION
      82. | 6.82 ARGENTINA MARKET ANALYSIS BY TECHNOLOGY
      83. | 6.83 ARGENTINA MARKET ANALYSIS BY OPTICAL FORMAT
      84. | 6.84 ARGENTINA MARKET ANALYSIS BY SPECTRUM
      85. | 6.85 ARGENTINA MARKET ANALYSIS BY APPLICATION
      86. | 6.86 REST OF SOUTH AMERICA MARKET ANALYSIS BY TECHNOLOGY
      87. | 6.87 REST OF SOUTH AMERICA MARKET ANALYSIS BY OPTICAL FORMAT
      88. | 6.88 REST OF SOUTH AMERICA MARKET ANALYSIS BY SPECTRUM
      89. | 6.89 REST OF SOUTH AMERICA MARKET ANALYSIS BY APPLICATION
      90. | 6.90 MEA MARKET ANALYSIS
      91. | 6.91 GCC COUNTRIES MARKET ANALYSIS BY TECHNOLOGY
      92. | 6.92 GCC COUNTRIES MARKET ANALYSIS BY OPTICAL FORMAT
      93. | 6.93 GCC COUNTRIES MARKET ANALYSIS BY SPECTRUM
      94. | 6.94 GCC COUNTRIES MARKET ANALYSIS BY APPLICATION
      95. | 6.95 SOUTH AFRICA MARKET ANALYSIS BY TECHNOLOGY
      96. | 6.96 SOUTH AFRICA MARKET ANALYSIS BY OPTICAL FORMAT
      97. | 6.97 SOUTH AFRICA MARKET ANALYSIS BY SPECTRUM
      98. | 6.98 SOUTH AFRICA MARKET ANALYSIS BY APPLICATION
      99. | 6.99 REST OF MEA MARKET ANALYSIS BY TECHNOLOGY
      100. | 6.100 REST OF MEA MARKET ANALYSIS BY OPTICAL FORMAT
      101. | 6.101 REST OF MEA MARKET ANALYSIS BY SPECTRUM
      102. | 6.102 REST OF MEA MARKET ANALYSIS BY APPLICATION
      103. | 6.103 KEY BUYING CRITERIA OF SEMICONDUCTOR & ELECTRONICS
      104. | 6.104 RESEARCH PROCESS OF MRFR
      105. | 6.105 DRO ANALYSIS OF SEMICONDUCTOR & ELECTRONICS
      106. | 6.106 DRIVERS IMPACT ANALYSIS: SEMICONDUCTOR & ELECTRONICS
      107. | 6.107 RESTRAINTS IMPACT ANALYSIS: SEMICONDUCTOR & ELECTRONICS
      108. | 6.108 SUPPLY / VALUE CHAIN: SEMICONDUCTOR & ELECTRONICS
      109. | 6.109 SEMICONDUCTOR & ELECTRONICS, BY TECHNOLOGY, 2024 (% SHARE)
      110. | 6.110 SEMICONDUCTOR & ELECTRONICS, BY TECHNOLOGY, 2024 TO 2035 (USD Billion)
      111. | 6.111 SEMICONDUCTOR & ELECTRONICS, BY OPTICAL FORMAT, 2024 (% SHARE)
      112. | 6.112 SEMICONDUCTOR & ELECTRONICS, BY OPTICAL FORMAT, 2024 TO 2035 (USD Billion)
      113. | 6.113 SEMICONDUCTOR & ELECTRONICS, BY SPECTRUM, 2024 (% SHARE)
      114. | 6.114 SEMICONDUCTOR & ELECTRONICS, BY SPECTRUM, 2024 TO 2035 (USD Billion)
      115. | 6.115 SEMICONDUCTOR & ELECTRONICS, BY APPLICATION, 2024 (% SHARE)
      116. | 6.116 SEMICONDUCTOR & ELECTRONICS, BY APPLICATION, 2024 TO 2035 (USD Billion)
      117. | 6.117 BENCHMARKING OF MAJOR COMPETITORS
    7. LIST OF TABLES
      1. | 7.1 LIST OF ASSUMPTIONS
      2. | | 7.1.1
      3. | 7.2 North America MARKET SIZE ESTIMATES; FORECAST
      4. | | 7.2.1 BY TECHNOLOGY, 2025-2035 (USD Billion)
      5. | | 7.2.2 BY OPTICAL FORMAT, 2025-2035 (USD Billion)
      6. | | 7.2.3 BY SPECTRUM, 2025-2035 (USD Billion)
      7. | | 7.2.4 BY APPLICATION, 2025-2035 (USD Billion)
      8. | 7.3 US MARKET SIZE ESTIMATES; FORECAST
      9. | | 7.3.1 BY TECHNOLOGY, 2025-2035 (USD Billion)
      10. | | 7.3.2 BY OPTICAL FORMAT, 2025-2035 (USD Billion)
      11. | | 7.3.3 BY SPECTRUM, 2025-2035 (USD Billion)
      12. | | 7.3.4 BY APPLICATION, 2025-2035 (USD Billion)
      13. | 7.4 Canada MARKET SIZE ESTIMATES; FORECAST
      14. | | 7.4.1 BY TECHNOLOGY, 2025-2035 (USD Billion)
      15. | | 7.4.2 BY OPTICAL FORMAT, 2025-2035 (USD Billion)
      16. | | 7.4.3 BY SPECTRUM, 2025-2035 (USD Billion)
      17. | | 7.4.4 BY APPLICATION, 2025-2035 (USD Billion)
      18. | 7.5 Europe MARKET SIZE ESTIMATES; FORECAST
      19. | | 7.5.1 BY TECHNOLOGY, 2025-2035 (USD Billion)
      20. | | 7.5.2 BY OPTICAL FORMAT, 2025-2035 (USD Billion)
      21. | | 7.5.3 BY SPECTRUM, 2025-2035 (USD Billion)
      22. | | 7.5.4 BY APPLICATION, 2025-2035 (USD Billion)
      23. | 7.6 Germany MARKET SIZE ESTIMATES; FORECAST
      24. | | 7.6.1 BY TECHNOLOGY, 2025-2035 (USD Billion)
      25. | | 7.6.2 BY OPTICAL FORMAT, 2025-2035 (USD Billion)
      26. | | 7.6.3 BY SPECTRUM, 2025-2035 (USD Billion)
      27. | | 7.6.4 BY APPLICATION, 2025-2035 (USD Billion)
      28. | 7.7 UK MARKET SIZE ESTIMATES; FORECAST
      29. | | 7.7.1 BY TECHNOLOGY, 2025-2035 (USD Billion)
      30. | | 7.7.2 BY OPTICAL FORMAT, 2025-2035 (USD Billion)
      31. | | 7.7.3 BY SPECTRUM, 2025-2035 (USD Billion)
      32. | | 7.7.4 BY APPLICATION, 2025-2035 (USD Billion)
      33. | 7.8 France MARKET SIZE ESTIMATES; FORECAST
      34. | | 7.8.1 BY TECHNOLOGY, 2025-2035 (USD Billion)
      35. | | 7.8.2 BY OPTICAL FORMAT, 2025-2035 (USD Billion)
      36. | | 7.8.3 BY SPECTRUM, 2025-2035 (USD Billion)
      37. | | 7.8.4 BY APPLICATION, 2025-2035 (USD Billion)
      38. | 7.9 Russia MARKET SIZE ESTIMATES; FORECAST
      39. | | 7.9.1 BY TECHNOLOGY, 2025-2035 (USD Billion)
      40. | | 7.9.2 BY OPTICAL FORMAT, 2025-2035 (USD Billion)
      41. | | 7.9.3 BY SPECTRUM, 2025-2035 (USD Billion)
      42. | | 7.9.4 BY APPLICATION, 2025-2035 (USD Billion)
      43. | 7.10 Italy MARKET SIZE ESTIMATES; FORECAST
      44. | | 7.10.1 BY TECHNOLOGY, 2025-2035 (USD Billion)
      45. | | 7.10.2 BY OPTICAL FORMAT, 2025-2035 (USD Billion)
      46. | | 7.10.3 BY SPECTRUM, 2025-2035 (USD Billion)
      47. | | 7.10.4 BY APPLICATION, 2025-2035 (USD Billion)
      48. | 7.11 Spain MARKET SIZE ESTIMATES; FORECAST
      49. | | 7.11.1 BY TECHNOLOGY, 2025-2035 (USD Billion)
      50. | | 7.11.2 BY OPTICAL FORMAT, 2025-2035 (USD Billion)
      51. | | 7.11.3 BY SPECTRUM, 2025-2035 (USD Billion)
      52. | | 7.11.4 BY APPLICATION, 2025-2035 (USD Billion)
      53. | 7.12 Rest of Europe MARKET SIZE ESTIMATES; FORECAST
      54. | | 7.12.1 BY TECHNOLOGY, 2025-2035 (USD Billion)
      55. | | 7.12.2 BY OPTICAL FORMAT, 2025-2035 (USD Billion)
      56. | | 7.12.3 BY SPECTRUM, 2025-2035 (USD Billion)
      57. | | 7.12.4 BY APPLICATION, 2025-2035 (USD Billion)
      58. | 7.13 APAC MARKET SIZE ESTIMATES; FORECAST
      59. | | 7.13.1 BY TECHNOLOGY, 2025-2035 (USD Billion)
      60. | | 7.13.2 BY OPTICAL FORMAT, 2025-2035 (USD Billion)
      61. | | 7.13.3 BY SPECTRUM, 2025-2035 (USD Billion)
      62. | | 7.13.4 BY APPLICATION, 2025-2035 (USD Billion)
      63. | 7.14 China MARKET SIZE ESTIMATES; FORECAST
      64. | | 7.14.1 BY TECHNOLOGY, 2025-2035 (USD Billion)
      65. | | 7.14.2 BY OPTICAL FORMAT, 2025-2035 (USD Billion)
      66. | | 7.14.3 BY SPECTRUM, 2025-2035 (USD Billion)
      67. | | 7.14.4 BY APPLICATION, 2025-2035 (USD Billion)
      68. | 7.15 India MARKET SIZE ESTIMATES; FORECAST
      69. | | 7.15.1 BY TECHNOLOGY, 2025-2035 (USD Billion)
      70. | | 7.15.2 BY OPTICAL FORMAT, 2025-2035 (USD Billion)
      71. | | 7.15.3 BY SPECTRUM, 2025-2035 (USD Billion)
      72. | | 7.15.4 BY APPLICATION, 2025-2035 (USD Billion)
      73. | 7.16 Japan MARKET SIZE ESTIMATES; FORECAST
      74. | | 7.16.1 BY TECHNOLOGY, 2025-2035 (USD Billion)
      75. | | 7.16.2 BY OPTICAL FORMAT, 2025-2035 (USD Billion)
      76. | | 7.16.3 BY SPECTRUM, 2025-2035 (USD Billion)
      77. | | 7.16.4 BY APPLICATION, 2025-2035 (USD Billion)
      78. | 7.17 South Korea MARKET SIZE ESTIMATES; FORECAST
      79. | | 7.17.1 BY TECHNOLOGY, 2025-2035 (USD Billion)
      80. | | 7.17.2 BY OPTICAL FORMAT, 2025-2035 (USD Billion)
      81. | | 7.17.3 BY SPECTRUM, 2025-2035 (USD Billion)
      82. | | 7.17.4 BY APPLICATION, 2025-2035 (USD Billion)
      83. | 7.18 Malaysia MARKET SIZE ESTIMATES; FORECAST
      84. | | 7.18.1 BY TECHNOLOGY, 2025-2035 (USD Billion)
      85. | | 7.18.2 BY OPTICAL FORMAT, 2025-2035 (USD Billion)
      86. | | 7.18.3 BY SPECTRUM, 2025-2035 (USD Billion)
      87. | | 7.18.4 BY APPLICATION, 2025-2035 (USD Billion)
      88. | 7.19 Thailand MARKET SIZE ESTIMATES; FORECAST
      89. | | 7.19.1 BY TECHNOLOGY, 2025-2035 (USD Billion)
      90. | | 7.19.2 BY OPTICAL FORMAT, 2025-2035 (USD Billion)
      91. | | 7.19.3 BY SPECTRUM, 2025-2035 (USD Billion)
      92. | | 7.19.4 BY APPLICATION, 2025-2035 (USD Billion)
      93. | 7.20 Indonesia MARKET SIZE ESTIMATES; FORECAST
      94. | | 7.20.1 BY TECHNOLOGY, 2025-2035 (USD Billion)
      95. | | 7.20.2 BY OPTICAL FORMAT, 2025-2035 (USD Billion)
      96. | | 7.20.3 BY SPECTRUM, 2025-2035 (USD Billion)
      97. | | 7.20.4 BY APPLICATION, 2025-2035 (USD Billion)
      98. | 7.21 Rest of APAC MARKET SIZE ESTIMATES; FORECAST
      99. | | 7.21.1 BY TECHNOLOGY, 2025-2035 (USD Billion)
      100. | | 7.21.2 BY OPTICAL FORMAT, 2025-2035 (USD Billion)
      101. | | 7.21.3 BY SPECTRUM, 2025-2035 (USD Billion)
      102. | | 7.21.4 BY APPLICATION, 2025-2035 (USD Billion)
      103. | 7.22 South America MARKET SIZE ESTIMATES; FORECAST
      104. | | 7.22.1 BY TECHNOLOGY, 2025-2035 (USD Billion)
      105. | | 7.22.2 BY OPTICAL FORMAT, 2025-2035 (USD Billion)
      106. | | 7.22.3 BY SPECTRUM, 2025-2035 (USD Billion)
      107. | | 7.22.4 BY APPLICATION, 2025-2035 (USD Billion)
      108. | 7.23 Brazil MARKET SIZE ESTIMATES; FORECAST
      109. | | 7.23.1 BY TECHNOLOGY, 2025-2035 (USD Billion)
      110. | | 7.23.2 BY OPTICAL FORMAT, 2025-2035 (USD Billion)
      111. | | 7.23.3 BY SPECTRUM, 2025-2035 (USD Billion)
      112. | | 7.23.4 BY APPLICATION, 2025-2035 (USD Billion)
      113. | 7.24 Mexico MARKET SIZE ESTIMATES; FORECAST
      114. | | 7.24.1 BY TECHNOLOGY, 2025-2035 (USD Billion)
      115. | | 7.24.2 BY OPTICAL FORMAT, 2025-2035 (USD Billion)
      116. | | 7.24.3 BY SPECTRUM, 2025-2035 (USD Billion)
      117. | | 7.24.4 BY APPLICATION, 2025-2035 (USD Billion)
      118. | 7.25 Argentina MARKET SIZE ESTIMATES; FORECAST
      119. | | 7.25.1 BY TECHNOLOGY, 2025-2035 (USD Billion)
      120. | | 7.25.2 BY OPTICAL FORMAT, 2025-2035 (USD Billion)
      121. | | 7.25.3 BY SPECTRUM, 2025-2035 (USD Billion)
      122. | | 7.25.4 BY APPLICATION, 2025-2035 (USD Billion)
      123. | 7.26 Rest of South America MARKET SIZE ESTIMATES; FORECAST
      124. | | 7.26.1 BY TECHNOLOGY, 2025-2035 (USD Billion)
      125. | | 7.26.2 BY OPTICAL FORMAT, 2025-2035 (USD Billion)
      126. | | 7.26.3 BY SPECTRUM, 2025-2035 (USD Billion)
      127. | | 7.26.4 BY APPLICATION, 2025-2035 (USD Billion)
      128. | 7.27 MEA MARKET SIZE ESTIMATES; FORECAST
      129. | | 7.27.1 BY TECHNOLOGY, 2025-2035 (USD Billion)
      130. | | 7.27.2 BY OPTICAL FORMAT, 2025-2035 (USD Billion)
      131. | | 7.27.3 BY SPECTRUM, 2025-2035 (USD Billion)
      132. | | 7.27.4 BY APPLICATION, 2025-2035 (USD Billion)
      133. | 7.28 GCC Countries MARKET SIZE ESTIMATES; FORECAST
      134. | | 7.28.1 BY TECHNOLOGY, 2025-2035 (USD Billion)
      135. | | 7.28.2 BY OPTICAL FORMAT, 2025-2035 (USD Billion)
      136. | | 7.28.3 BY SPECTRUM, 2025-2035 (USD Billion)
      137. | | 7.28.4 BY APPLICATION, 2025-2035 (USD Billion)
      138. | 7.29 South Africa MARKET SIZE ESTIMATES; FORECAST
      139. | | 7.29.1 BY TECHNOLOGY, 2025-2035 (USD Billion)
      140. | | 7.29.2 BY OPTICAL FORMAT, 2025-2035 (USD Billion)
      141. | | 7.29.3 BY SPECTRUM, 2025-2035 (USD Billion)
      142. | | 7.29.4 BY APPLICATION, 2025-2035 (USD Billion)
      143. | 7.30 Rest of MEA MARKET SIZE ESTIMATES; FORECAST
      144. | | 7.30.1 BY TECHNOLOGY, 2025-2035 (USD Billion)
      145. | | 7.30.2 BY OPTICAL FORMAT, 2025-2035 (USD Billion)
      146. | | 7.30.3 BY SPECTRUM, 2025-2035 (USD Billion)
      147. | | 7.30.4 BY APPLICATION, 2025-2035 (USD Billion)
      148. | 7.31 PRODUCT LAUNCH/PRODUCT DEVELOPMENT/APPROVAL
      149. | | 7.31.1
      150. | 7.32 ACQUISITION/PARTNERSHIP
      151. | | 7.32.1

    Image Sensor Market Segmentation

    Image Sensor Technology Outlook (USD Billion, 2018-2032)

    sCMOS

    CCD

    CMOS

    Image Sensor by Optical Format Outlook (USD Billion, 2018-2032)

    Non-Linear

    Linear

    Image Sensor by Spectrum Outlook (USD Billion, 2018-2032)

    Invisible Spectrum

    Visible Spectrum

    Image Sensor Application Outlook (USD Billion, 2018-2032)

    Medical

    Surveillance

    Automobile

    Consumer Electronics

    Others

    Image Sensor Regional Outlook (USD Billion, 2018-2032)

    North America Outlook (USD Billion, 2018-2032)

    North America Image Sensor by Technology

    sCMOS

    CCD

    CMOS

    North America Image Sensor by Optical Format

    Non-Linear

    Linear

    North America Image Sensor by Spectrum

    Invisible Spectrum

    Visible Spectrum

    North America Image Sensor by Application

    Medical

    Surveillance

    Automobile

    Consumer Electronics

    Others

    US Outlook (USD Billion, 2018-2032)

    US Image Sensor by Technology

    sCMOS

    CCD

    CMOS

    US Image Sensor by Optical Format

    Non-Linear

    Linear

    US Image Sensor by Spectrum

    Invisible Spectrum

    Visible Spectrum

    US Image Sensor by Application

    Medical

    Surveillance

    Automobile

    Consumer Electronics

    Others

    CANADA Outlook (USD Billion, 2018-2032)

    CANADA Image Sensor by Technology

    sCMOS

    CCD

    CMOS

    CANADA Image Sensor by Optical Format

    Non-Linear

    Linear

    CANADA Image Sensor by Spectrum

    Invisible Spectrum

    Visible Spectrum

    CANADA Image Sensor by Application

    Medical

    Surveillance

    Automobile

    Consumer Electronics

    Others

    Europe Outlook (USD Billion, 2018-2032)

    Europe Image Sensor by Technology

    sCMOS

    CCD

    CMOS

    Europe Image Sensor by Optical Format

    Non-Linear

    Linear

    Europe Image Sensor by Spectrum

    Invisible Spectrum

    Visible Spectrum

    Europe Image Sensor by Application

    Medical

    Surveillance

    Automobile

    Consumer Electronics

    Others

    Germany Outlook (USD Billion, 2018-2032)

    Germany Image Sensor by Technology

    sCMOS

    CCD

    CMOS

    Germany Image Sensor by Optical Format

    Non-Linear

    Linear

    Germany Image Sensor by Spectrum

    Invisible Spectrum

    Visible Spectrum

    Germany Image Sensor by Application

    Medical

    Surveillance

    Automobile

    Consumer Electronics

    Others

    France Outlook (USD Billion, 2018-2032)

    France Image Sensor by Technology

    sCMOS

    CCD

    CMOS

    France Image Sensor by Optical Format

    Non-Linear

    Linear

    France Image Sensor by Spectrum

    Invisible Spectrum

    Visible Spectrum

    France Image Sensor by Application

    Medical

    Surveillance

    Automobile

    Consumer Electronics

    Others

    UK Outlook (USD Billion, 2018-2032)

    UK Image Sensor by Technology

    sCMO

    CCD

    CMOS

    UK Image Sensor by Optical Format

    Non-Linear

    Linear

    UK Image Sensor by Spectrum

    Invisible Spectrum

    Visible Spectrum

    UK Image Sensor by Application

    Medical

    Surveillance

    Automobile

    Consumer

    Electronics

    Others

    ITALY Outlook (USD Billion, 2018-2032)

    ITALY Image Sensor by Technology

    sCMOS

    CCD

    CMOS

    ITALY Image Sensor by Optical Format

    Non-Linear

    Linear

    ITALY Image Sensor by Spectrum

    Invisible Spectrum

    Visible Spectrum

    ITALY Image Sensor by Application

    Medical

    Surveillance

    Automobile

    Consumer Electronics

    Others

    SPAIN Outlook (USD Billion, 2018-2032)

    Spain Image Sensor by Technology

    sCMOS

    CCD

    CMOS

    Spain Image Sensor by Optical Format

    Non-Linear

    Linear

    Spain Image Sensor by Spectrum

    Invisible Spectrum

    Visible Spectrum

    Spain Image Sensor by Application

    Medical

    Surveillance

    Automobile

    Consumer Electronics

    Others

    Rest Of Europe Outlook (USD Billion, 2018-2032)

    Rest Of Europe Image Sensor by Technology

    sCMOS

    CCD

    CMOS

    REST OF EUROPE Image Sensor by Optical Format

    Non-Linear

    Linear

    REST OF EUROPE Image Sensor by Spectrum

    Invisible Spectrum

    Visible Spectrum

    REST OF EUROPE Image Sensor by Application

    Medical

    Surveillance

    Automobile

    Consumer Electronics

    Others

    Asia-Pacific Outlook (USD Billion, 2018-2032)

    Asia-Pacific Image Sensor by Technology

    sCMOS

    CCD

    CMOS

    Asia-Pacific Image Sensor by Optical Format

    Non-Linear

    Linear

    Asia-Pacific Image Sensor by Spectrum

    Invisible Spectrum

    Visible Spectrum

    Asia-Pacific Image Sensor by Application

    Medical

    Surveillance

    Automobile

    Consumer Electronics

    Others

    China Outlook (USD Billion, 2018-2032)

    China Image Sensor by Technology

    sCMOS

    CCD

    CMOS

    China Image Sensor by Optical Format

    Non-Linear

    Linear

    China Image Sensor by Spectrum

    Invisible Spectrum

    Visible Spectrum

    China Image Sensor by Application

    Medical

    Surveillance

    Automobile

    Consumer Electronics

    Others

    Japan Outlook (USD Billion, 2018-2032)

    Japan Image Sensor by Technology

    sCMOS

    CCD

    CMOS

    Japan Image Sensor by Optical Format

    Non-Linear

    Linear

    Japan Image Sensor by Spectrum

    Invisible Spectrum

    Visible Spectrum

    Japan Image Sensor by Application

    Medical

    Surveillance

    Automobile

    Consumer Electronics

    Others

    India Outlook (USD Billion, 2018-2032)

    India Image Sensor by Technology

    sCMOS

    CCD

    CMOS

    India Image Sensor by Optical Format

    Non-Linear

    Linear

    India Image Sensor by Spectrum

    Invisible Spectrum

    Visible Spectrum

    India Image Sensor by Application

    Medical

    Surveillance

    Automobile

    Consumer Electronics

    Others

    Australia Outlook (USD Billion, 2018-2032)

    Australia Image Sensor by Technology

    sCMOS

    CCD

    CMOS

    Australia Image Sensor by Optical Format

    Non-Linear

    Linear

    Australia Image Sensor by Spectrum

    Invisible Spectrum

    Visible Spectrum

    Australia Image Sensor by Application

    Medical

    Surveillance

    Automobile

    Consumer Electronics

    Others

    Rest of Asia-Pacific Outlook (USD Billion, 2018-2032)

    Rest of Asia-Pacific Image Sensor by Technology

    sCMOS

    CCD

    CMOS

    Rest of Asia-Pacific Image Sensor by Optical Format

    Non-Linear

    Linear

    Rest of Asia-Pacific Image Sensor by Spectrum

    Invisible Spectrum

    Visible Spectrum

    Rest of Asia-Pacific Image Sensor by Application

    Medical

    Surveillance

    Automobile

    Consumer Electronics

    Others

    Rest of the World Outlook (USD Billion, 2018-2032)

    Rest of the World Image Sensor by Technology

    sCMOS

    CCD

    CMOS

    Rest of the World Image Sensor by Optical Format

    Non-Linear

    Linear

    Rest of the World Image Sensor by Spectrum

    Invisible Spectrum

    Visible Spectrum

    Rest of the World Image Sensor by Application

    Medical

    Surveillance

    Automobile

    Consumer Electronics

    Others

    Middle East Outlook (USD Billion, 2018-2032)

    Middle East Image Sensor by Technology

    sCMOS

    CCD

    CMOS

    Middle East Image Sensor by Optical Format

    Non-Linear

    Linear

    Middle East Image Sensor by Spectrum

    Invisible Spectrum

    Visible Spectrum

    Middle East Image Sensor by Application

    Medical

    Surveillance

    Automobile

    Consumer Electronics

    Others

    Africa Outlook (USD Billion, 2018-2032)

    Africa Image Sensor by Technology

    sCMOS

    CCD

    CMOS

    Africa Image Sensor by Optical Format

    Non-Linear

    Linear

    Africa Image Sensor by Spectrum

    Invisible Spectrum

    Visible Spectrum

    Africa Image Sensor by Application

    Medical

    Surveillance

    Automobile

    Consumer Electronics

    Others

    Latin America Outlook (USD Billion, 2018-2032)

    Latin America Image Sensor by Technology

    sCMOS

    CCD

    CMOS

    Latin America Image Sensor by Optical Format

    Non-Linear

    Linear

    Latin America Image Sensor by Spectrum

    Invisible Spectrum

    Visible Spectrum

    Latin America Image Sensor by Application

    Medical

    Surveillance

    Automobile

    Consumer Electronics

    Others

    Infographic

    Free Sample Request

    Kindly complete the form below to receive a free sample of this Report

    Get Free Sample

    Customer Strories

    “I am very pleased with how market segments have been defined in a relevant way for my purposes (such as "Portable Freezers & refrigerators" and "last-mile"). In general the report is well structured. Thanks very much for your efforts.”

    Victoria Milne

    Founder
    Case Study
    Chemicals and Materials

    Compare Licence

    ×
    Features License Type
    Single User Multiuser License Enterprise User
    Price $4,950 $5,950 $7,250
    Maximum User Access Limit 1 User Upto 10 Users Unrestricted Access Throughout the Organization
    Free Customization
    Direct Access to Analyst
    Deliverable Format
    Platform Access
    Discount on Next Purchase 10% 15% 15%
    Printable Versions