ID: MRFR/IA - E/6648-HCR | August 2022 | Region: Global | 90 Pages
Table of Contents
Chapter 1. Report Prologue
Chapter 2. Market Introduction
2.1 Definition
2.2 Scope of the Study
2.2.1 Research Objective
2.2.2 Assumptions
2.2.3 Limitations
Chapter 3. Research Methodology
3.1 Introduction
3.2 Primary Research
3.3 Secondary Research
3.4 Market Size Estimation
Chapter 4. Market Dynamics
4.1 Drivers
4.2 Restraints
4.3 Opportunities
4.4 Challenges
Chapter 5. Market Factor Analysis
5.1 Porter’s Five Forces Analysis
5.1.1 Bargaining Power of Suppliers
5.1.2 Bargaining Power of Buyers
5.1.3 Threat of New Entrants
5.1.4 Threat of Substitutes
5.1.5 Intensity of Rivalry
5.2 Value Chain Analysis
Chapter 6. Global ICP-OES Spectrometer Market, by Spectrometer Type
6.1 Overview
6.2 Sequential
Market Estimates & Forecast, by Region, 2020-2027
Market Estimates & Forecast, by Country, 2020-2027
6.3 Simultaneous
Market Estimates & Forecast, by Region, 2020-2027
Market Estimates & Forecast, by Country, 2020-2027
Chapter 7. Global ICP-OES Spectrometer Market, by Application
7.1 Overview
7.2 Nanotechnology
Market Estimates & Forecast, by Region, 2020-2027
Market Estimates & Forecast, by Country, 2020-2027
7.3 Drug Discovery
Market Estimates & Forecast, by Region, 2020-2027
Market Estimates & Forecast, by Country, 2020-2027
7.4 Environmental Testing
Market Estimates & Forecast, by Region, 2020-2027
Market Estimates & Forecast, by Country, 2020-2027
7.5 Food & Agriculture
Market Estimates & Forecast, by Region, 2020-2027
Market Estimates & Forecast, by Country, 2020-2027
7.6 Others
Chapter 8. Global ICP-OES Spectrometer Market, by End User
8.1 Overview
8.2 Pharmaceutical and Biotechnology Companies
Market Estimates & Forecast, by Region, 2020-2027
Market Estimates & Forecast, by Country, 2020-2027
8.3 Research and Academic Institutes
Market Estimates & Forecast, by Region, 2020-2027
Market Estimates & Forecast, by Country, 2020-2027
8.4 Others
Chapter 9. Global ICP-OES Spectrometer Market, by Region
9.1 Overview
9.2 Americas
9.2.1 North America
9.2.1.1 US
9.2.1.2 Canada
9.2.2 Latin America
9.3 Europe
9.3.1 Western Europe
9.3.1.1 Germany
9.3.1.2 France
9.3.1.3 Italy
9.3.1.4 Spain
9.3.1.5 UK
9.3.1.6 Rest of Western Europe
9.3.2 Eastern Europe
9.4 Asia-Pacific
9.4.1 Japan
9.4.2 China
9.4.3 India
9.4.4 Australia
9.4.5 South Korea
9.4.6 Rest of Asia-Pacific
9.5 Middle East & Africa
9.5.1 Middle East
9.5.2 Africa
Chapter 10. Company Landscape
10.1 Overview
10.2 Company Share Analysis
Chapter 11. Company Profiles
11.1 PerkinElmer Inc.
11.1.1 Company Overview
11.1.2 Product Type Overview
11.1.3 Financials Overview
11.1.4 Key Developments
11.1.5 SWOT Analysis
11.2 Shimadzu Corporation
11.2.1 Company Overview
11.2.2 Product Type Overview
11.2.3 Financial Overview
11.2.4 Key Developments
11.2.5 SWOT Analysis
11.3 GBC Scientific Equipment
11.3.1 Company Overview
11.3.2 Product Type Overview
11.3.3 Financial Overview
11.3.4 Key Development
11.3.5 SWOT Analysis
11.4 Thermo Fisher Scientific
11.4.1 Company Overview
11.4.2 Product Type Overview
11.4.3 Financial Overview
11.4.4 Key Development
11.4.5 SWOT Analysis
11.5 Agilent Technologies, Inc.
11.5.1 Company Overview
11.5.2 Product Type Overview
11.5.3 Financial overview
11.5.4 Key Developments
11.5.5 SWOT Analysis
11.6 SPECTRO Analytical Instruments GmbH
11.6.1 Company Overview
11.6.2 Product Type Overview
11.6.3 Financial Overview
11.6.4 Key Developments
11.6.5 SWOT Analysis
11.7 Teledyne Leeman Labs
11.7.1 Overview
11.7.2 Product Type Overview
11.7.3 Financial Overview
11.7.4 Key Developments
11.7.5 SWOT Analysis
11.8 Analytik Jena AG
11.8.1 Overview
11.8.2 Product Type Overview
11.8.3 Financials
11.8.4 Key Developments
11.8.5 SWOT Analysis
11.9 Horiba
11.9.1 Overview
11.9.2 Product Type Overview
11.9.3 Financials
11.9.4 Key Developments
11.9.5 SWOT Analysis
11.10 Skyray Instrument Inc.
11.10.1 Overview
11.10.2 Product Type Overview
11.10.3 Financials
11.10.4 Key Developments
11.10.5 SWOT Analysis
11.11 Beijing Huake Tiancheng Technology Co., Ltd
11.11.1 Overview
11.11.2 Product Type Overview
11.11.3 Financials
11.11.4 Key Developments
11.11.5 SWOT Analysis
11.12 FPI
11.12.1 Overview
11.12.2 Product Type Overview
11.12.3 Financials
11.12.4 Key Developments
11.12.5 SWOT Analysis
11.13 Hitachi High-Technologies Corporation
11.13.1 Overview
11.13.2 Product Type Overview
11.13.3 Financials
11.13.4 Key Developments
11.13.5 SWOT Analysis
11.14 Merck KGaA
11.14.1 Overview
11.14.2 Product Type Overview
11.14.3 Financials
11.14.4 Key Developments
11.14.5 SWOT Analysis
11.15 Others
Chapter 12 MRFR Conclusion
12.1 Key Findings
12.1.1 From CEO’s Viewpoint
12.1.2 Unmet Needs of the Market
12.2 Key Companies to Watch
12.3 Predictions for the ICP-OES Spectrometer Market
Chapter 13. Appendix
 
LIST OF TABLES
Table 1 Global ICP-OES Spectrometer Market Synopsis, 2020-2027
Table 2 Global ICP-OES Spectrometer Market Estimates and Forecast, 2020-2027(USD Million)
Table 3 Global ICP-OES Spectrometer Market, by Spectrometer Type, 2020-2027(USD Million)
Table 4 Global ICP-OES Spectrometer Market, by Application, 2020-2027(USD Million)
Table 5 Global ICP-OES Spectrometer Market, by End User, 2020-2027(USD Million)
Table 6 Global ICP-OES Spectrometer Market, by Region, 2020-2027(USD Million)
Table 7 North America: ICP-OES Spectrometer Market, by Spectrometer Type, 2020-2027(USD Million)
Table 8 North America: ICP-OES Spectrometer Market, by Application, 2020-2027(USD Million)
Table 9 North America: ICP-OES Spectrometer Market, by End User, 2020-2027(USD Million)
Table 10 US: ICP-OES Spectrometer Market, by Spectrometer Type, 2020-2027(USD Million)
Table 11 US: ICP-OES Spectrometer Market, by Application, 2020-2027(USD Million)
Table 12 US: ICP-OES Spectrometer Market, by End User, 2020-2027(USD Million)
Table 13 Canada: ICP-OES Spectrometer Market, by Spectrometer Type, 2020-2027(USD Million)
Table 14 Canada: ICP-OES Spectrometer Market, by Application, 2020-2027(USD Million)
Table 15 Canada: ICP-OES Spectrometer Market, by End User, 2020-2027(USD Million)
Table 16 Latin America: ICP-OES Spectrometer Market, by Spectrometer Type, 2020-2027(USD Million)
Table 17 Latin America: ICP-OES Spectrometer Market, by Application, 2020-2027(USD Million)
Table 18 Latin America: ICP-OES Spectrometer Market, by End User, 2020-2027(USD Million)
Table 19 Europe: ICP-OES Spectrometer Market, by Spectrometer Type, 2020-2027(USD Million)
Table 20 Europe: ICP-OES Spectrometer Market, by Application, 2020-2027(USD Million)
Table 21 Europe: ICP-OES Spectrometer Market, by End User, 2020-2027(USD Million)
Table 22 Western Europe: ICP-OES Spectrometer Market, by Spectrometer Type, 2020-2027(USD Million)
Table 23 Western Europe: ICP-OES Spectrometer Market, by Application, 2020-2027 (USD Million)
Table 24 Western Europe: ICP-OES Spectrometer Market, by End User, 2020-2027(USD Million)
Table 25 Eastern Europe: ICP-OES Spectrometer Market, by Spectrometer Type, 2020-2027(USD Million)
Table 26 Eastern Europe: ICP-OES Spectrometer Market, by Application, 2020-2027(USD Million)
Table 27 Eastern Europe: ICP-OES Spectrometer Market, by End User, 2020-2027(USD Million)
Table 28 Asia-Pacific: ICP-OES Spectrometer Market, by Spectrometer Type, 2020-2027(USD Million)
Table 29 Asia-Pacific: ICP-OES Spectrometer Market, by Application, 2020-2027(USD Million)
Table 30 Asia-Pacific: ICP-OES Spectrometer Market, by End User, 2020-2027(USD Million)
Table 31 Middle East & Africa: ICP-OES Spectrometer Market, by Spectrometer Type, 2020-2027(USD Million)
Table 32 Middle East & Africa: ICP-OES Spectrometer Market, by Application, 2020-2027(USD Million)
Table 33 Middle East & Africa: ICP-OES Spectrometer Market, by End User, 2020-2027(USD Million)
 
LIST OF FIGURES
Figure 1 Research Process
Figure 2 Market Structure for Global ICP-OES Spectrometer Market
Figure 3 Market Dynamics for Global ICP-OES Spectrometer Market
Figure 4 Global ICP-OES Spectrometer Market Share, by Spectrometer Type, 2020 (%)
Figure 5 Global ICP-OES Spectrometer Market Share, by Application, 2020 (%)
Figure 6 Global ICP-OES Spectrometer Market Share, by End User, 2020 (%)
Figure 7 Global ICP-OES Spectrometer Market Share, by Region, 2020 (%)
Figure 8 North America: ICP-OES Spectrometer Market Share, by Country, 2020 (%)
Figure 9 Europe: ICP-OES Spectrometer Market Share, by Region, 2020 (%)
Figure 10 Western Europe: ICP-OES Spectrometer Market Share, by Country, 2020 (%)
Figure 11 Asia-Pacific: ICP-OES Spectrometer Market Share, by Country, 2020 (%)
Figure 12 Middle East & Africa: ICP-OES Spectrometer Market Share, by Country, 2020 (%)
Figure 13 Global ICP-OES Spectrometer Market: Company Share Analysis, 2020 (%)
Figure 14 PerkinElmer Inc.: Key Financials
Figure 15 PerkinElmer Inc.: Segmental Revenue
Figure 16 PerkinElmer Inc.: Geographical Revenue
Figure 17 Shimadzu Corporation: Key Financials
Figure 18 Shimadzu Corporation: Segmental Revenue
Figure 19 Shimadzu Corporation: Geographical Revenue
Figure 20 GBC Scientific Equipment: Key Financials
Figure 21 GBC Scientific Equipment: Segmental Revenue
Figure 22 GBC Scientific Equipment: Geographical Revenue
Figure 23 Thermo Fisher Scientific: Key Financials
Figure 24 Thermo Fisher Scientific: Segmental Revenue
Figure 25 Thermo Fisher Scientific: Geographical Revenue
Figure 26 Agilent Technologies, Inc.: Key Financials
Figure 27 Agilent Technologies, Inc.: Segmental Revenue
Figure 28 Agilent Technologies, Inc.: Geographical Revenue
Figure 29 SPECTRO Analytical Instruments GmbH: Key Financials
Figure 30 SPECTRO Analytical Instruments GmbH: Segmental Revenue
Figure 31 SPECTRO Analytical Instruments GmbH: Geographical Revenue
Figure 32 Teledyne Leeman Labs: Key Financials
Figure 33 Teledyne Leeman Labs: Segmental Revenue
Figure 34 Teledyne Leeman Labs: Geographical Revenue
Figure 35 Analytik Jena AG: Key Financials
Figure 36 Analytik Jena AG: Segmental Revenue
Figure 37 Analytik Jena AG: Geographical Revenue
Figure 38 Horiba: Key Financials
Figure 39 Horiba: Segmental Revenue
Figure 40 Horiba: Geographical Revenue
Figure 41 Skyray Instrument Inc.: Key Financials
Figure 42 Skyray Instrument Inc.: Segmental Revenue
Figure 43 Skyray Instrument Inc.: Geographical Revenue
Figure 44 Beijing Huake Tiancheng Technology Co., Ltd: Key Financials
Figure 45 Beijing Huake Tiancheng Technology Co., Ltd: Segmental Revenue
Figure 46 Beijing Huake Tiancheng Technology Co., Ltd: Geographical Revenue
Figure 47 FPI: Key Financials
Figure 48 FPI: Segmental Revenue
Figure 49 FPI: Geographical Revenue
Figure 50 Hitachi High-Technologies Corporation: Key Financials
Figure 51 Hitachi High-Technologies Corporation: Segmental Revenue
Figure 52 Hitachi High-Technologies Corporation: Geographical Revenue
Figure 53 Merck KGaA: Key Financials
Figure 54 Merck KGaA: Segmental Revenue
Figure 55 Merck KGaA: Geographical Revenue
$521.4 million
6.90%
North America
2022-2030
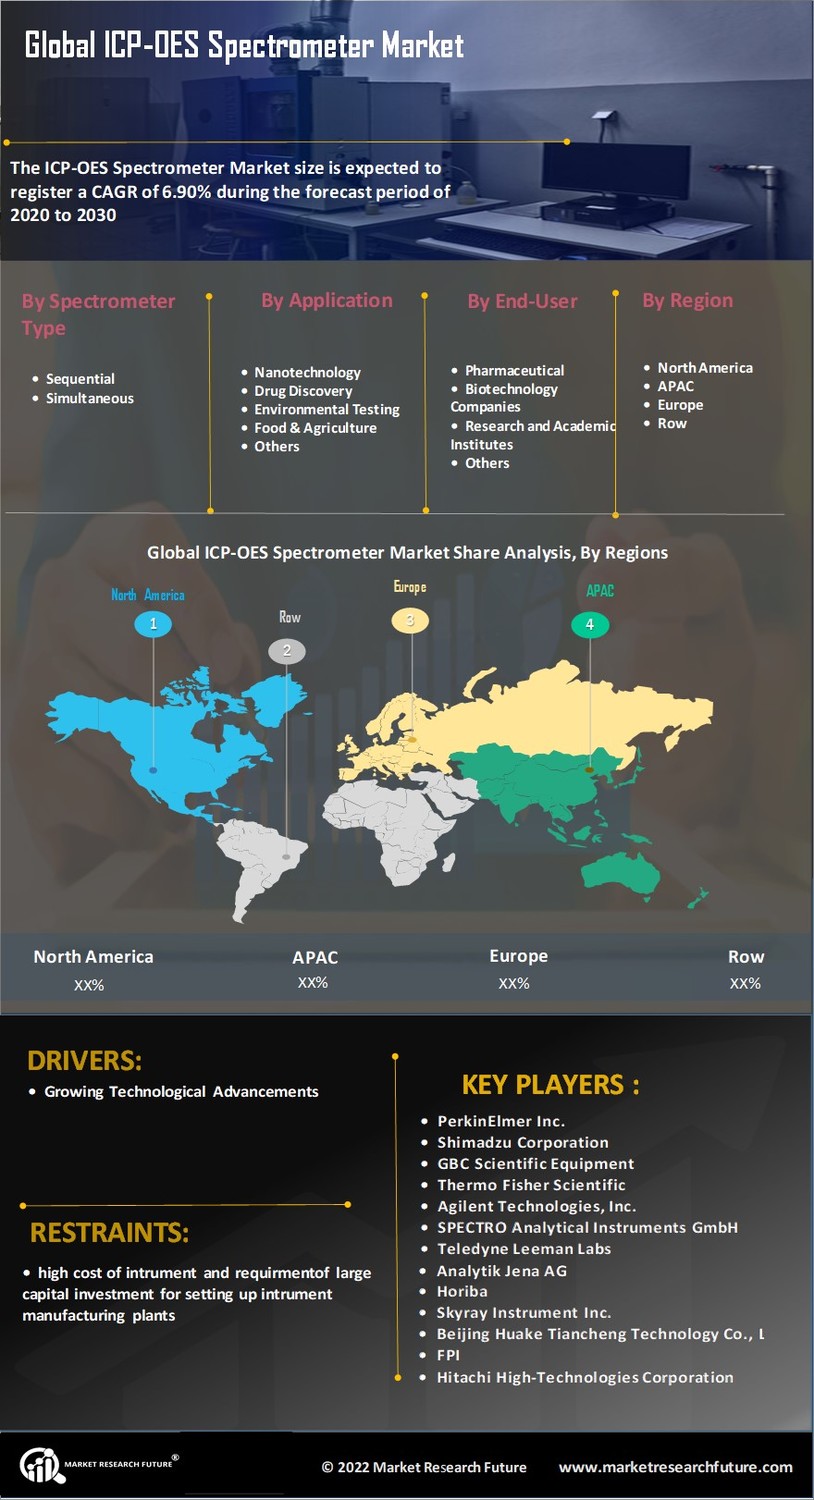
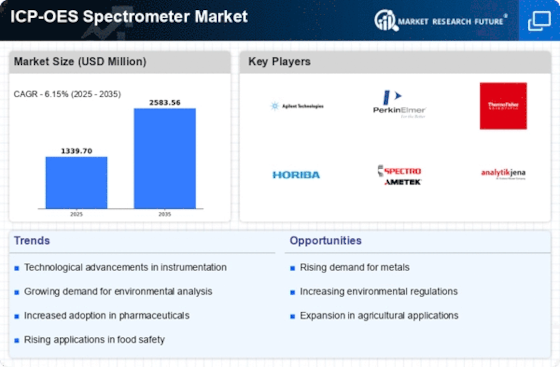
The ICP-OES Spectrometer Market size is expected to register a CAGR of 6.90% during the forecast period of 2020 to 2030 with a market value of USD 521.4 million in 2020.
ICP-OES Spectrometer or inductively coupled plasma optical emission spectroscopy is an analytical technique that is used for the detection of chemical elements. With the help of this technique, the composition of elements in samples can be determined using plasma and a spectrometer. The ICP-OES spectrometer market is driven by factors such as increasing R&D expenditure for the development of better analytical systems and growing technological advancements. On the other hand, the high cost of instruments and the requirement of large capital investment for setting up instrument manufacturing plants is projected to negatively affect the growth of the market during the assessment period.
Moreover, major companies in the market are involved in strategic acquisitions and collaborations to sustain their position in the market. For instance, in May 2018, PerkinElmer Inc. acquired Shanghai Spectrum Instruments Co., Ltd, which helped the company to build a strong position in the Chinese market.
Segmentation
The global ICP-OES spectrometer market has been segmented based on spectrometer type, application, and end user.
The market, based on spectrometer type, has been bifurcated into sequential and simultaneous. The sequential spectrometer market is expected to hold a major share in the market owing to its wider availability in the market. The simultaneous spectrometer segment is anticipated to be the fastest growing due to its rising adoption rate.
The market, by application, has been divided into nanotechnology, drug discovery, environmental testing, food & agriculture, and others. The drug discovery segment is expected to hold a major share owing to a large number of applications of ICP-OES spectrometer in this field. The environmental testing segment is expected to be the fastest growing due to an increasing number of research activities for using ICP-OES spectrometer for environmental testing purpose.
The market, by end user, has been classified as pharmaceutical & biotechnology companies, research & academic institutes, and others. Pharmaceutical & biotechnology companies are anticipated to hold a major share in the market. This is due to the increasing number of applications of ICP-OES spectrometer in the pharmaceutical industry. The research & academic institutes segment is expected to become the fastest growing market due to the increasing research activities.
The market has been divided, by region, into the Americas, Europe, Asia-Pacific, and the Middle East & Africa. The ICP-OES spectrometer market in the Americas has further been branched into North America and Latin America, with the North American market divided into the US and Canada. The European market has been sub-divided Western Europe and Eastern Europe. Western Europe has further been classified as Germany, France, UK, Italy, Spain, and the rest of Western Europe. The market in Asia-Pacific has been segmented into Japan, China, India, South Korea, Australia, and the rest of Asia-Pacific. The ICP-OES spectrometer market in the Middle East & Africa has been divided into the Middle East and Africa.
Key Players
Regional Market Summary
Global ICP-OES Spectrometer Market Share (%), by Region, 2018
Source: World Health Organization (WHO) and Institute of Medicine (IOM)
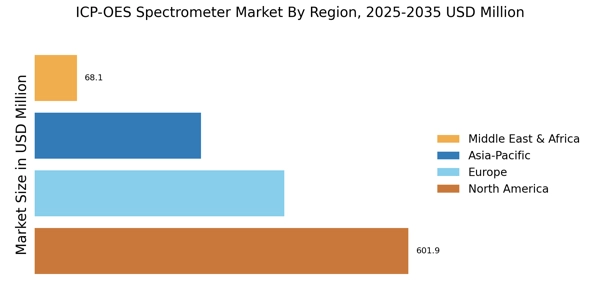
The market in the Americas is expected to dominate the global ICP-OES spectrometer market due to the growing expenditure on R&D to develop new technologies and the high adoption of new technology in the region. Moreover, the presence of major companies such as PerkinElmer Inc., Agilent Technologies, Inc., Thermo Fisher Scientific, etc. in North America is also expected to fuel the market growth in the region.
The market in Europe showed a substantial amount of growth. The market growth in this region can be attributed to the presence of a well-established healthcare system and increasing adoption of ICP-OES spectrometer for research purposes.
The market in Asia-Pacific is projected to have the fastest growth rate during the forecast period owing to the rapid growth of the pharmaceutical industry in countries such as China, India, and Japan.
The market in the Middle East & Africa is anticipated to account for the least share of the global market due to low disposable income in the region. Moreover, the presence of major companies in the Middle East and African market is also limited, which is projected to curb the growth of the market in the future.
Global ICP-OES Spectrometer Market, by Modality
Global ICP-OES Spectrometer Market, by Application
Global ICP-OES Spectrometer Market, by End User
Global ICP-OES Spectrometer Market, by Region
Intended Audience
Report Attribute/Metric | Details |
---|---|
Market Size | 2030: Significant Value |
CAGR | 6.90% (2020-2030) |
Base Year | 2019 |
Forecast Period | 2030 |
Historical Data | 2018 |
Forecast Units | Value (USD Million) |
Report Coverage | Revenue Forecast, Competitive Landscape, Growth Factors, and Trends |
Segments Covered | Spectrometer Type, Application, End User |
Geographies Covered | North America, Europe, Asia-Pacific, and Rest of the World (RoW) |
Key Vendors | PerkinElmer Inc., Shimadzu Corporation, GBC Scientific Equipment, Thermo Fisher Scientific, Agilent, Technologies, Inc., SPECTRO Analytical Instruments GmbH, Teledyne, Leeman Labs, Analytik Jena AG, Horiba, Skyray Instrument Inc., Beijing Huake Tiancheng Technology Co., Ltd, FPI, Hitachi High-Technologies Corporation, Merck KGaA |
Key Market Opportunities | New product launches and R&D Amongst major key Players |
Key Market Drivers | Growing Technological Advancements |
Frequently Asked Questions (FAQ) :
The ICP-OES spectrometer market anticipates a 6.90% CAGR during the forecast period of 2020 to 2030.
The ICP-OES spectrometer market valuation of 2018 was USD 521.4 million.
The sequential spectrometer would lead the ICP-OES spectrometer market.
The drug discovery segment would dominate the ICP-OES spectrometer market.
The pharmaceutical and biotechnology companies would command the ICP-OES spectrometer market growth.