Healthcare Market Segmentation
Healthcare By Type (USD Million, 2025-2035)
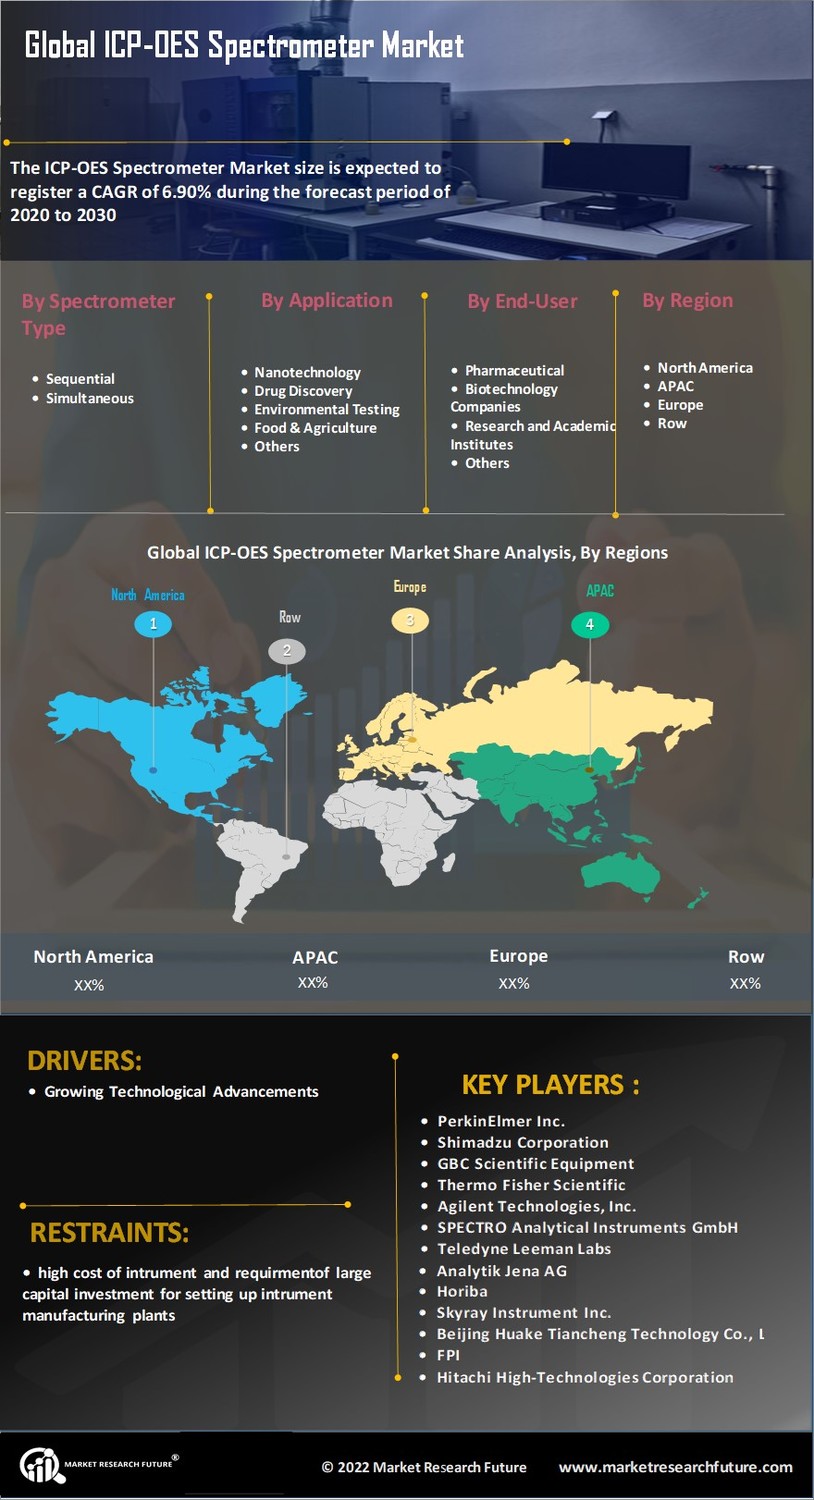
- Sequential
- Simultaneous
Healthcare By Application (USD Million, 2025-2035)
- Nanotechnology
- Drug Discovery
- Environmental Testing
- Food & Agriculture
- Others
Healthcare By End User (USD Million, 2025-2035)
- ICP-OES Spectrometer Market and Biotechnology Companies
- Research and Academic Institutes
- Others