ID: MRFR/MED/5443-HCR | February 2021 | Region: Global | 90 pages
Market Scenario:
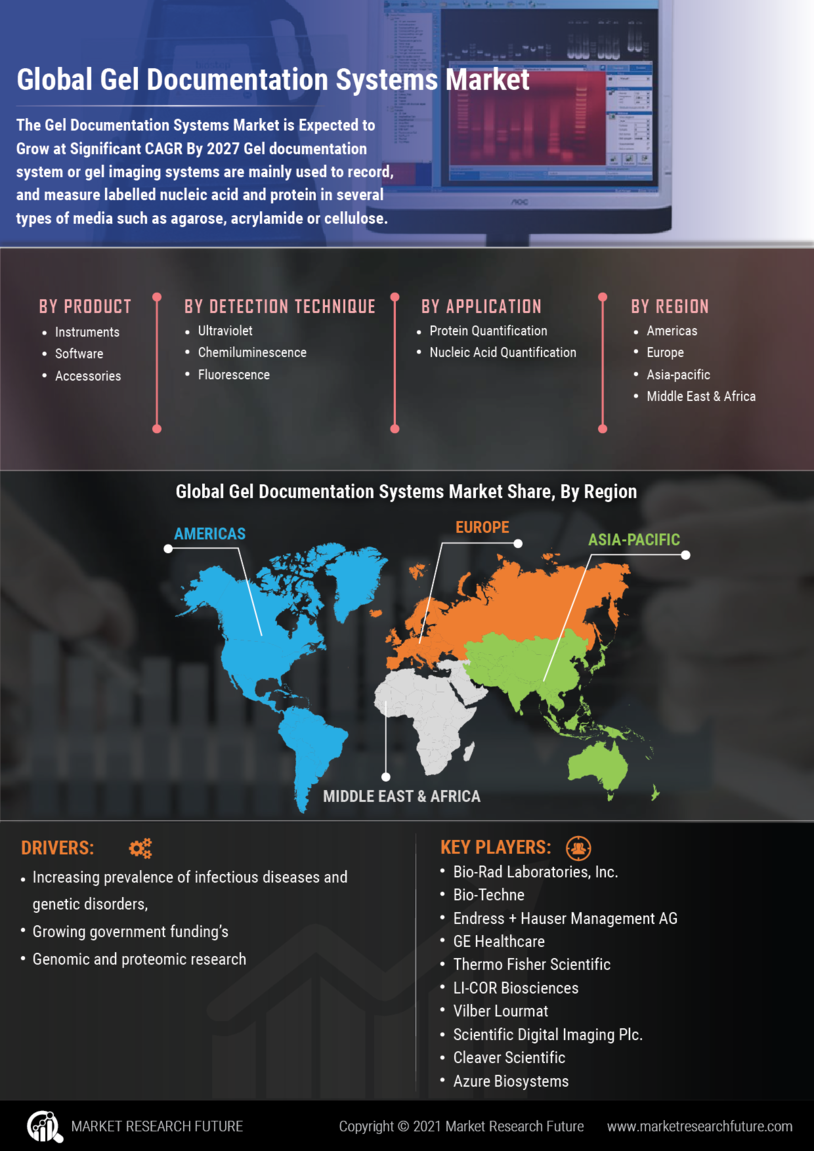
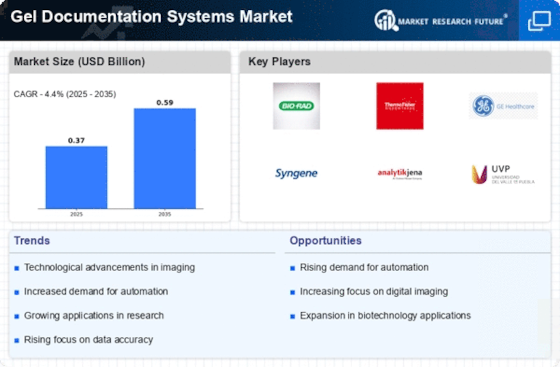
Global Gel Documentation Systems Market is expected to grow significantly over the forecast period. The market held a market value of USD 245 Million in 2017 and is projected to grow at a CAGR of 3.6% over the forecast period. Gel documentation system or gel imaging systems are mainly used to record, and measure labelled nucleic acid and protein in several types of media such as agarose, acrylamide or cellulose. These systems have applications in protein quantification, monoclonal and polyclonal antibody binding affinities, gel and blot imaging, immunoassay, 2D electrophoresis, and nucleic acid quantification among others. The factors such as increasing prevalence of infectious diseases and genetic disorders, growing government funding’s for genomic and proteomic research, and the on-going technological advancements in gel documentation systems is anticipated to boost the growth of the market over the forecast period. According to the Centers for Disease Control and Prevention (CDC), about 9,272 number of new tuberculosis cases were reported in 2016 in the US. Despite the drivers, the high cost of modern gel documentation systems with advanced technologies and the increasing adoption of quantitative polymerase chain reaction (QPCR) may hinder the market growth during the assessment period.
Segmentation:
The Global Gel Documentation Systems Market has been segmented into Product, Detection techniques, Application and End user.
By product, the market has been segmented into instruments, accessories, and software. The instrument segment has been further segmented into digital gel documentation instruments and film gel documentation instruments. The instruments segment is estimated to hold major market share in the global gel documentation systems market due to the rising R&D activities in the biotechnology and pharmaceutical industries.On the basis of detection technique, the market has been segmented into ultraviolet, chemiluminescence, and fluorescence.On the basis of application, the market has been segmented into protein quantification, nucleic acid quantification, and others.
The market, by end user, has been segmented into pharmaceutical & biotechnology companies, academic institutes & research centers, diagnostic laboratories, and others.The Global Gel Documentation Systems Market has been segmented, by region, into the Americas, Europe, Asia-Pacific, and the Middle East & Africa. The gel documentation systems market in the Americas has further been segmented into North America and South America, with the North American market divided into the US and Canada.
The European Gel Documentation Systems Market has been segmented into Western Europe and Eastern Europe. The Western Europe Gel Documentation Systems Market has further been classified as Germany, France, the UK, Italy, Spain, and the rest of Western Europe. The Gel Documentation Systems Market in Asia-Pacific has been segmented into Japan, China, India, South Korea, Australia, and the rest of Asia-Pacific. The gel documentation systems market in the Middle East & Africa has been segmented into the Middle East and Africa.
Key players:
Bio-Rad Laboratories, Inc., Bio-Techne, Endress + Hauser Management AG, GE Healthcare, Thermo Fisher Scientific, LI-COR Biosciences, Vilber Lourmat, Scientific Digital Imaging Plc., Cleaver Scientific, and Azure Biosystems are some of the prominent players in the global gel documentation systems market.
Regional Market Summary
Global Gel Documentation Systems Share (%), by Region, 2017
Source: White Papers, Company Presentations, Annual Reports
Geographically, the Americas is anticipated to dominate the Global Gel Documentation Systems Market owing to the high clinical R&D budgets by both government as well as commercial pharmaceutical and biotechnological companies, and rising adoption of advanced technologies. According to the US Investments in Medical and Health Research and Development 2013-2015, a report by Research America, in 2015, total US medical and health R&D in the US was USD 158.7 billion. Moreover, the increasing prevalence of genetic disorders in the region contributes to the market growth.
Europe is expected to hold the second largest position in the Global Gel Documentation Systems Market. The market growth in this region is attributed to the presence of strong academic & research base and availability of funding for research in the European countries. For instance, the European Research Council (ERC) provides grants for technological and scientific research conducted within the European Union (EU).
The Gel Documentation Systems Market in Asia-Pacific region consists of countries namely China, Japan, Republic of Korea, India, Australia and Rest of Asia-Pacific. The Asia-Pacific region is expected to be fastest growing region owing to increasing government focus on biomedical and biotechnology sector and growing number of proteomic and genomic studies in the region.
The Middle East & Africa has the lowest share of the Global Gel Documentation Systems Market. Majority of the market of the region is anticipated to be held by the Middle East region owing to the growing government initiatives for the healthcare sector.
Global Gel Documentation Systems Market, by Product:
Global Gel Documentation Systems Market, by Detection Technique:
Global Gel Documentation Systems Market, by Application:
Global Gel Documentation Systems Market, by End User:
Global Gel Documentation Systems Market, by Region:
Global Gel Documentation Systems Market, by Key Players:
Intended Audience:
Table of Contents:
Chapter 1. Report Prologue
Chapter 2. Market Introduction
2.1 Definition
2.2 Scope of the Study
2.2.1 Research Objective
2.2.2 Assumptions
2.2.3 Limitations
Chapter 3. Research Methodology
3.1 Introduction
3.2 Primary Research
3.3 Secondary Research
3.4 Market Size Estimation
Chapter 4. Market Dynamics
4.1 Drivers
4.2 Restraints
4.3 Opportunities
4.4 Challenges
4.5 Macroeconomic Indicators
4.6 Detection Technique Trends & Assessment
Chapter 5. Market Factor Analysis
5.1 Porter’s Five Forces Analysis
5.1.1 Bargaining Power of Suppliers
5.1.2 Bargaining Power of Buyers
5.1.3 Threat of New Entrants
5.1.4 Threat of Substitutes
5.1.5 Intensity of Rivalry
5.2 Value Chain Analysis
5.3 Investment Feasibility Analysis
5.4 Pricing Analysis
Chapter 6. Global Gel Documentation Systems Market, by Product
6.1 Introduction
6.2 Instruments
6.2.1 Digital Gel Documentation Instruments
Market Estimates & Forecast, by Region, 2020-2027
Market Estimates & Forecast, by Country, 2020-2027
6.2.2 Film Gel Documentation Instruments
Market Estimates & Forecast, by Region, 2020-2027
Market Estimates & Forecast, by Country, 2020-2027
6.3 Accessories
Market Estimates & Forecast, by Region, 2020-2027
Market Estimates & Forecast, by Country, 2020-2027
6.4 Software
Market Estimates & Forecast, by Region, 2020-2027
Market Estimates & Forecast, by Country, 2020-2027
Chapter 7. Global Gel Documentation Systems Market, by Detection Technique
7.1 Introduction
7.2 Ultraviolet
Market Estimates & Forecast, by Region, 2020-2027
Market Estimates & Forecast, by Country, 2020-2027
7.3 Chemiluminescence
Market Estimates & Forecast, by Region, 2020-2027
Market Estimates & Forecast, by Country, 2020-2027
7.4 Fluorescence
Market Estimates & Forecast, by Region, 2020-2027
Market Estimates & Forecast, by Country, 2020-2027
Chapter 8. Global Gel Documentation Systems Market, by Application
8.1 Introduction
8.2 Protein Quantification
Market Estimates & Forecast, by Region, 2020-2027
Market Estimates & Forecast, by Country, 2020-2027
8.3 Nucleic Acid Quantification
Market Estimates & Forecast, by Region, 2020-2027
Market Estimates & Forecast, by Country, 2020-2027
8.4 Others
Chapter 9. Global Gel Documentation Systems Market, by End User
9.1 Introduction
9.2 Pharmaceutical & BioDetection Technique Companies
Market Estimates & Forecast, by Region, 2020-2027
Market Estimates & Forecast, by Country, 2020-2027
9.3 Academic Institutes & Research Centers
Market Estimates & Forecast, by Region, 2020-2027
Market Estimates & Forecast, by Country, 2020-2027
9.4 Diagnostic Laboratories
Market Estimates & Forecast, by Region, 2020-2027
Market Estimates & Forecast, by Country, 2020-2027
9.5 Others
Chapter 10. Global Gel Documentation Systems Market, by Region
10.1 Introduction
10.2 Americas
10.2.1 North America
10.2.1.1 US
10.2.1.2 Canada
10.2.2 South America
10.3 Europe
10.3.1 Western Europe
10.3.1.1 Germany
10.3.1.2 France
10.3.1.3 Italy
10.3.1.4 Spain
10.3.1.5 UK
10.3.1.6 Rest of Western Europe
10.3.2 Eastern Europe
10.4 Asia-Pacific
10.4.1 Japan
10.4.2 China
10.4.3 India
10.4.4 Australia
10.4.5 South Korea
10.4.6 Rest of Asia-Pacific
10.5 Middle East & Africa
10.5.1 Middle East
10.5.2 Africa
Chapter 11. Company Landscape
11.1 Introduction
11.2 Market Share Analysis
11.3 Key Development & Strategies
Chapter 12. Company Profiles
12.1 Bio-Rad Laboratories, Inc.
12.1.1 Company Overview
12.1.2 Treatment Overview
12.1.3 Financials Overview
12.1.4 Key Developments
12.1.5 SWOT Analysis
12.2 Bio-Techne
12.2.1 Company Overview
12.2.2 Treatment Overview
12.2.3 Financial Overview
12.2.4 Key Developments
12.2.5 SWOT Analysis
12.3 Endress + Hauser Management AG
12.3.1 Company Overview
12.3.2 Treatment Overview
12.3.3 Financial Overview
12.3.4 Key Development
12.3.5 SWOT Analysis
12.4 GE Healthcare
12.4.1 Company Overview
12.4.2 Treatment Overview
12.4.3 Financial Overview
12.4.4 Key Development
12.4.5 SWOT Analysis
12.5 Thermo Fisher Scientific
12.5.1 Company Overview
12.5.2 Treatment Overview
12.5.3 Financial overview
12.5.4 Key Developments
12.5.5 SWOT Analysis
12.6 LI-COR Biosciences
12.6.1 Company Overview
12.6.2 Treatment Overview
12.6.3 Financial Overview
12.6.4 Key Developments
12.6.5 SWOT Analysis
12.7 Vilber Lourmat
12.7.1 Overview
12.7.2 Treatment Overview
12.7.3 Financial Overview
12.7.4 Key Developments
12.7.5 SWOT Analysis
12.8 Scientific Digital Imaging Plc.
12.8.1 Overview
12.8.2 Treatment Overview
12.8.3 Financials
12.8.4 Key Developments
12.8.5 SWOT Analysis
12.9 Cleaver Scientific
12.9.1 Overview
12.9.2 Treatment Overview
12.9.3 Financials
12.9.4 Key Developments
12.9.5 SWOT Analysis
12.10 Azure Biosystems
12.10.1 Overview
12.10.2 Treatment Overview
12.10.3 Financials
12.10.4 Key Developments
12.10.5 SWOT Analysis
12.11 Others
Chapter 13 MRFR Conclusion
13.1 Key Findings
13.1.1 From CEO’s View point
13.1.2 Unmet Needs of the Market
13.2 Key Companies to Watch
13.3 Predictions for the Gel Documentation Systems Industry
Chapter 14. Appendix
LIST OF TABLES
Table 1 Global Gel Documentation Systems Market Synopsis, 2020-2027
Table 2 Global Gel Documentation Systems Market Estimates and Forecast, 2020-2027
(USD Million)
Table 3 Global Gel Documentation Systems Market, by Region, 2020-2027 (USD Million)
Table 4 Global Gel Documentation Systems Market, by Product, 2020-2027 (USD Million)
Table 5 Global Gel Documentation Systems Market, by Detection Technique, 2020-2027 (USD
Million)
Table 6 Global Gel Documentation Systems Market, by Application, 2020-2027 (USD Million)
Table 7 Global Gel Documentation Systems Market, by End User, 2020-2027 (USD Million)
Table 8 North America: Gel Documentation Systems Market, by Product, 2020-2027 (USD
Million)
Table 9 North America: Gel Documentation Systems Market, by Detection Technique, 2020-2027
(USD Million)
Table 10 North America: Gel Documentation Systems Market, by Application, 2020-2027 (USD
Million)
Table 11 North America: Gel Documentation Systems Market, by End User, 2020-2027 (USD
Million)
Table 12 US: Gel Documentation Systems Market, by Product, 2020-2027 (USD Million)
Table 13 US: Gel Documentation Systems Market, by Detection Technique, 2020-2027 (USD
Million)
Table 14 US: Gel Documentation Systems Market, by Application, 2020-2027 (USD Million)
Table 15 US: Gel Documentation Systems Market, by End User, 2020-2027 (USD Million)
Table 16 Canada: Gel Documentation Systems Market, by Product, 2020-2027 (USD Million)
Table 17 Canada: Gel Documentation Systems Market, by Detection Technique, 2020-2027 (USD
Million)
Table 18 Canada: Gel Documentation Systems Market,by Application, 2020-2027 (USD Million)
Table 19 Canada: Gel Documentation Systems Market, by End User, 2020-2027 (USD Million)
Table 20 South America: Gel Documentation Systems Market, by Product, 2020-2027 (USD
Million)
Table 21 South America: Gel Documentation Systems Market, by Detection Technique, 2020-2027 (USD Million)
Table 22 South America: Gel Documentation Systems Market, by Application, 2020-2027 (USD
Million)
Table 23 South America: Gel Documentation Systems Market, by End User, 2020-2027 (USD
Million)
Table 24 Europe: Gel Documentation Systems Market, by Product, 2020-2027 (USD Million)
Table 25 Europe: Gel Documentation Systems Market, by Detection Technique, 2020-2027 (USD
Million)
Table 26 Europe: Gel Documentation Systems Market, by Application, 2020-2027 (USD Million)
Table 27 Europe: Gel Documentation Systems Market, by End User, 2020-2027 (USD Million)
Table 28 Western Europe: Gel Documentation Systems Market, by Product, 2020-2027 (USD
Million)
Table 29 Western Europe: Gel Documentation Systems Market, byDetection Technique, 2020-2027 (USD Million)
Table 30 Western Europe: Gel Documentation Systems Market, by Application, 2020-2027 (USD
Million)
Table 31 Western Europe: Gel Documentation Systems Market, by End User, 2020-2027 (USD
Million)
Table 32 Eastern Europe: Gel Documentation Systems Market, by Product, 2020-2027 (USD
Million)
Table 33 Eastern Europe: Gel Documentation Systems Market, by Detection Technique, 2020-2027 (USD Million)
Table 34 Eastern Europe: Gel Documentation Systems Market, by Application, 2020-2027 (USD
Million)
Table 35 Eastern Europe: Gel Documentation Systems Market, by End User, 2020-2027 (USD
Million)
Table 36 Asia-Pacific: Gel Documentation Systems Market, by Product, 2020-2027 (USD
Million)
Table 37 Asia-Pacific: Gel Documentation Systems Market, byDetection Technique, 2020-2027
(USD Million)
Table 38 Asia-Pacific: Gel Documentation Systems Market, by Application, 2020-2027 (USD
Million)
Table 39 Asia-Pacific: Gel Documentation Systems Market, by End User, 2020-2027 (USD
Million)
Table 40 Middle East & Africa: Gel Documentation Systems Market, by Product, 2020-2027
(USD Million)
Table 41 Middle East & Africa: Gel Documentation Systems Market, by Detection Technique,
2020-2027 (USD Million)
Table 42 Middle East & Africa: Gel Documentation Systems Market, by Application, 2020-2027
(USD Million)
Table 43 Middle East & Africa: Gel Documentation Systems Market, by End User, 2020-2027
(USD Million)
LIST OF FIGURES
Figure 1 Research Process
Figure 2 Segmentation for Global Gel Documentation Systems Market
Figure 3 Segmentation Market Dynamics for Global Gel Documentation Systems Market
Figure 4 Global Gel Documentation Systems Market Share, by Product, 2020
Figure 5 Global Gel Documentation Systems Market Share, by Detection Technique, 2020
Figure 6 Global Gel Documentation Systems Market Share, by Application, 2020
Figure 7 Global Gel Documentation Systems Market Share, by End User, 2020
Figure 8 Global Gel Documentation Systems Market Share, by Region, 2020
Figure 9 North America: Gel Documentation Systems Market Share, by Country, 2020
Figure 10 Europe: Gel Documentation Systems Market Share, by Country, 2020
Figure 11 Asia-Pacific: Gel Documentation Systems Market Share, by Country, 2020
Figure 12 Middle East & Africa: Gel Documentation Systems Market Share, by Country, 201
Figure 13 Global Gel Documentation Systems Market: Company Share Analysis, 2020 (%)
Figure 14 Bio-Rad Laboratories, Inc.: Key Financials
Figure 15 Bio-Rad Laboratories, Inc.: Segmental Revenue
Figure 16 Bio-Rad Laboratories, Inc.: Geographical Revenue
Figure 17 Bio-Techne: Key Financials
Figure 18 Bio-Techne: Segmental Revenue
Figure 19 Bio-Techne: Geographical Revenue
Figure 20 Endress + Hauser Management AG : Key Financials
Figure 21 Endress + Hauser Management AG : Segmental Revenue
Figure 22 Endress + Hauser Management AG : Geographical Revenue
Figure 23 GE Healthcare : Key Financials
Figure 24 GE Healthcare: Segmental Revenue
Figure 25 GE Healthcare : Geographical Revenue
Figure 26 Thermo Fisher Scientific : Key Financials
Figure 27 Thermo Fisher Scientific : Segmental Revenue
Figure 28 Thermo Fisher Scientific : Geographical Revenue
Figure 29 LI-COR Biosciences: Key Financials
Figure 30 LI-COR Biosciences: Segmental Revenue
Figure 31 LI-COR Biosciences: Geographical Revenue
Figure 32 Vilber Lourmat: Key Financials
Figure 33 Vilber Lourmat: Segmental Revenue
Figure 34 Vilber Lourmat: Geographical Revenue
Figure 35 Scientific Digital Imaging Plc.: Key Financials
Figure 36 Scientific Digital Imaging Plc.: Segmental Revenue
Figure 37 Scientific Digital Imaging Plc.: Geographical Revenue
Figure 38 Cleaver Scientific : Key Financials
Figure 39 Cleaver Scientific: Segmental Revenue
Figure 40 Cleaver Scientific: Geographical Revenue
Figure 41 Azure Biosystems : Key Financials
Figure 42 Azure Biosystems : Segmental Revenue
Figure 43 Azure Biosystems : Geographical Revenue