×
Hero Background
English
Chinese
French
Japanese
Korean
German
Spanish

Gel Documentation Systems Market Analysis

ID: MRFR/MED/5443-HCR
90 Pages
Kinjoll Dey
October 2025

Gel Documentation Systems Market Research Report Information by Product (Instruments, Accessories, Software’s), by Detection Technique (Ultraviolet, Fluorescence, Chemiluminescence), By Application (Protein Quantification, Others), By End User - Global Forecast Till 2035

Share:
Download PDF ×

We do not share your information with anyone. However, we may send you emails based on your report interest from time to time. You may contact us at any time to opt-out.

Gel Documentation Systems Market Infographic
Purchase Options

Market Analysis

In-depth Analysis of Gel Documentation Systems Market Industry Landscape

The Gel Documentation Systems market is a vital branch of the life sciences and biotechnology industry that experiences active fluctuations in its trends, which define the development of its market dynamics. The pivotal role played by these systems in molecular biology and biochemistry laboratories is to enable visualization and analysis of nucleic acid and protein samples separated through gel electrophoresis. Since 2022, there has been a constant demand for modernized systems that offer better sensitivity, resolution, as well as user-friendliness.

One important driver of the market dynamics is the increasing focus on genomics and proteomics R&D. The growing applications of gel documentation systems in DNA fingerprinting, genotyping, as well as protein analysis are creating a need for more sophisticated imaging solutions. In order to realize accurate, reproducible results for researchers and scientists, manufacturers have had to make investments in new products based on their requirements.

Furthermore, increased use of gel documentation systems in academic institutions and pharmaceutical establishments contributes to market dynamics. Such organizations have intensified their activities in molecular biology researches as well as drug discoveries thereby leading to demand for imaging devices which can enhance workflow efficiency. As a result, this trend promotes rivalry among industrial players who tend to develop integrated systems with user interfaces that are friendly easy but at the same time automated.

Technological aspects also come into play when analyzing market dynamics since they depict transition from analogues or traditional film-based techniques towards digital imaging systems.. These include replacing traditional film-based methods with digital detectors and cameras providing real-time visualization along with quantification. This shift not only leads to faster results but also aligns with the larger industry-wide push toward digitization and data integration. Consequently, companies investing in advanced technologies have an upper hand over competitors within this transforming landscape.

Globalization has also impacted the gel documentation systems’ market dynamics. Besides collaborative research programmes; several cross border partnerships have emerged calling for harmonized imaging approaches across different laboratory setups. This has resulted in heightened demand for gel documentation systems that are versatile and flexible enough to meet the diverse needs of various laboratories across the world.

Nevertheless, the existence of challenges such as high initial costs and requirements for trained personnel to operate them slightly hinder market dynamics. In response to this, market players have launched cost-effective products and training programs for their customers. Furthermore, there is also an introduction of smaller portable gel documentation systems which is being embraced a great deal providing a suitable option for small laboratories with limited budgets.”

Author
Kinjoll Dey
Research Analyst Level I

He is an extremely curious individual currently working in Healthcare and Medical Devices Domain. Kinjoll is comfortably versed in data centric research backed by healthcare educational background. He leverages extensive data mining and analytics tools such as Primary and Secondary Research, Statistical Analysis, Machine Learning, Data Modelling. His key role also involves Technical Sales Support, Client Interaction and Project management within the Healthcare team. Lastly, he showcases extensive affinity towards learning new skills and remain fascinated in implementing them.

Leave a Comment

Market Summary

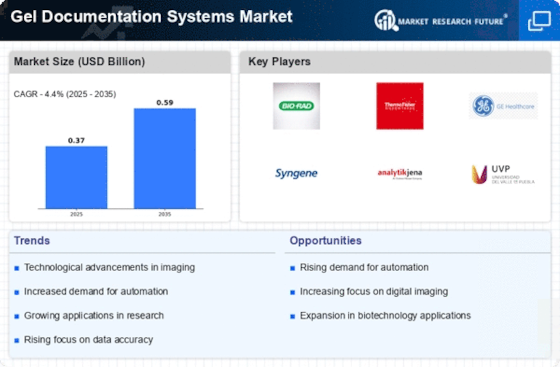
As per MRFR analysis, the Gel Documentation Systems Market Size was estimated at 0.3654 USD Billion in 2024. The Gel Documentation Systems industry is projected to grow from 0.3815 in 2025 to 0.5868 by 2035, exhibiting a compound annual growth rate (CAGR) of 4.4 during the forecast period 2025 - 2035.

Key Market Trends & Highlights

The Gel Documentation Systems Market is experiencing robust growth driven by technological advancements and increasing demand for molecular biology applications.

  • North America remains the largest market for gel documentation systems, driven by extensive research activities and funding. The Asia-Pacific region is emerging as the fastest-growing market, fueled by rapid advancements in laboratory automation and technology. Instruments represent the largest segment, while accessories are witnessing the fastest growth due to rising demand for enhanced functionalities. Key market drivers include the rising demand for molecular biology applications and increased funding for research and development.

Market Size & Forecast

2024 Market Size 0.3654 (USD Billion)
2035 Market Size 0.5868 (USD Billion)
CAGR (2025 - 2035) 4.4%
Largest Regional Market Share in 2024 Americas

Major Players

<p>Bio-Rad Laboratories (US), <a href="https://www.thermofisher.com/in/en/home/life-science/protein-biology/protein-assays-analysis/western-blotting/detect-proteins-western-blot/western-blot-imaging-analysis/ibright-systems.html?ef_id=Cj0KCQiAxJXJBhD_ARIsAH_JGjiOSwddmV5ELdfVIwMYwktwqvvvR4xTuooImmUxaQtcWnXL9tIcx7waAh8sEALw_wcB:G:s&amp;s_kwcid=AL!3652!3!772520967059!p!!g!!gel%20doc!22974799656!186525537324&amp;cid=bid_pca_ibt_r01_co_cp1359_pjt0000_bid00000_0se_gaw_nt_lgn_ins&amp;gad_source=1&amp;gad_campaignid=22974799656&amp;gbraid=0AAAAADxi_GTlzdCvZmVtCgNFgX2eDzz3C&amp;gclid=Cj0KCQiAxJXJBhD_ARIsAH_JGjiOSwddmV5ELdfVIwMYwktwqvvvR4xTuooImmUxaQtcWnXL9tIcx7waAh8sEALw_wcB">Thermo Fisher Scientific</a> (US), GE Healthcare (US), Syngene International (IN), Analytik Jena (DE), UVP, LLC (US), Cleaver Scientific (GB), Vilber Lourmat (FR), Major Science (US)</p>

Market Trends

The Gel Documentation Systems Market is currently experiencing a notable evolution, driven by advancements in imaging technology and increasing demand for precise documentation in various scientific fields. This market encompasses a range of products designed to capture and analyze gel electrophoresis results, which are essential in molecular biology, genetics, and biochemistry. As research institutions and laboratories seek to enhance their capabilities, the integration of sophisticated software and high-resolution imaging systems appears to be a focal point. Furthermore, the growing emphasis on reproducibility and accuracy in scientific research is likely to propel the adoption of these systems, as they provide reliable data for critical experiments. In addition to technological advancements, the Gel Documentation Systems Market is influenced by the rising trend of automation in laboratories. Automated systems not only streamline workflows but also minimize human error, thereby improving the overall efficiency of research processes. Moreover, the increasing collaboration between academic institutions and commercial entities suggests a potential for innovation and development in this sector. As the market continues to evolve, it seems poised for growth, with emerging applications in fields such as clinical diagnostics and forensic analysis, which may further expand its reach and relevance in the scientific community.

Technological Advancements

The Gel Documentation Systems Market is witnessing rapid technological advancements, particularly in imaging capabilities. Enhanced resolution and sensitivity in imaging systems are enabling researchers to obtain clearer and more detailed results. This trend is likely to improve the accuracy of data interpretation, which is crucial for various applications in molecular biology and genetics.

Automation in Laboratories

The increasing trend of automation within laboratories is reshaping the Gel Documentation Systems Market. Automated systems are being integrated to streamline workflows, reduce manual intervention, and enhance reproducibility. This shift towards automation may lead to greater efficiency and reliability in experimental processes.

Collaboration Between Sectors

There appears to be a growing collaboration between academic institutions and commercial entities in the Gel Documentation Systems Market. Such partnerships may foster innovation and the development of new technologies, potentially expanding the applications of gel documentation systems in diverse fields, including clinical diagnostics and forensic science.

Gel Documentation Systems Market Market Drivers

Integration of Advanced Imaging Technologies

The Gel Documentation Systems Market is significantly influenced by the integration of advanced imaging technologies. Innovations such as high-resolution cameras and sophisticated software for image analysis are enhancing the functionality of gel documentation systems. These advancements allow for improved visualization and quantification of nucleic acids and proteins, which is essential for accurate experimental results. The market is witnessing a shift towards systems that incorporate features like real-time imaging and automated analysis, which streamline laboratory workflows. As a result, laboratories are increasingly adopting these advanced systems, leading to a projected market growth of around 7% annually. This trend indicates a clear preference for high-performance equipment that can deliver reliable and reproducible results in various research applications.

Expansion of Educational and Training Programs

The Gel Documentation Systems Market is positively impacted by the expansion of educational and training programs in life sciences. As educational institutions enhance their curricula to include more hands-on laboratory training, the demand for gel documentation systems is expected to rise. These systems are essential for teaching students the principles of molecular biology and biochemistry, providing them with practical experience in gel electrophoresis and documentation techniques. The market is projected to grow by approximately 4.5% annually, driven by the increasing number of academic programs and research initiatives that require the use of gel documentation systems. This trend highlights the critical role that these systems play in shaping the next generation of scientists and researchers.

Increased Funding for Research and Development

The Gel Documentation Systems Market is benefiting from increased funding for research and development across various sectors, including academia, pharmaceuticals, and biotechnology. Governments and private organizations are investing significantly in scientific research, which in turn drives the demand for advanced laboratory equipment, including gel documentation systems. This influx of funding is expected to enhance the capabilities of research institutions, allowing them to acquire state-of-the-art gel documentation systems that meet their evolving needs. As a result, the market is anticipated to expand, with a projected growth rate of approximately 5.5% over the next few years. This trend underscores the importance of gel documentation systems in facilitating cutting-edge research and development initiatives.

Rising Demand for Molecular Biology Applications

The Gel Documentation Systems Market is experiencing a notable increase in demand driven by the expanding applications in molecular biology. As research in genetics and genomics continues to evolve, the need for precise and reliable documentation of gel electrophoresis results becomes paramount. The market is projected to grow at a compound annual growth rate of approximately 6.5% over the next five years, reflecting the increasing reliance on these systems in academic and clinical laboratories. This growth is further fueled by the rising number of research initiatives focusing on DNA and RNA analysis, which necessitate high-quality imaging and documentation solutions. Consequently, manufacturers are innovating to enhance the capabilities of gel documentation systems, ensuring they meet the rigorous standards required in molecular biology research.

Growing Emphasis on Quality Control in Laboratories

The Gel Documentation Systems Market is increasingly shaped by the growing emphasis on quality control within laboratories. As regulatory standards become more stringent, laboratories are required to implement robust quality assurance protocols, which include accurate documentation of experimental results. Gel documentation systems play a crucial role in ensuring compliance with these standards by providing reliable imaging and data management solutions. The market is likely to see a rise in demand for systems that offer enhanced features for data integrity and traceability. This shift is expected to contribute to a market growth rate of around 6% annually, as laboratories prioritize investments in equipment that supports their quality control initiatives and enhances overall operational efficiency.

Market Segment Insights

By Product: Instruments (Largest) vs. Accessories (Fastest-Growing)

<p>The Gel Documentation Systems Market is characterized by a diverse range of products, with Instruments holding the largest market share. This category includes essential tools such as <a href="https://www.marketresearchfuture.com/reports/imaging-systems-market-6812">imaging systems</a> and electrophoresis devices, which are crucial for gel documentation. Accessories, while smaller in overall share, are rapidly gaining traction due to the increasing emphasis on optimizing lab workflows and integrating advanced technologies. As researchers look for ways to enhance their gel documentation processes, the demand for specialized accessories is growing significantly.</p>

<p>Instruments (Dominant) vs. Accessories (Emerging)</p>

<p>Instruments play a dominant role in the Gel Documentation Systems Market, representing the backbone of gel imaging technology. They encompass advanced systems capable of high-resolution imaging and digital processing, essential for accurate results in molecular biology. Conversely, Accessories are emerging as vital adjuncts, providing support tools such as gel trays, stain reagents, and imaging filters which enhance the functionality and versatility of existing instruments. This growing trend indicates a shift toward comprehensive solutions that integrate various tools, addressing specific laboratory needs and fostering innovation in the field.</p>

By Detection Technique: Fluorescence (Largest) vs. Chemiluminescence (Fastest-Growing)

<p>In the Gel Documentation Systems Market, the Detection Technique segment is predominantly driven by <a href="https://www.marketresearchfuture.com/reports/fluorometer-market-29673">Fluorescence</a>, which commands the largest market share due to its widespread application and reliability in various settings. This technique is favored for its sensitivity and ability to deliver high-resolution images, which makes it essential for laboratories aiming for precision and accuracy in gel documentation. Conversely, Chemiluminescence, while currently holding a smaller share, is rapidly gaining traction and is recognized as the fastest-growing detection technique. Its unique advantages in visualizing subtle signals without the need for a fluorescence tag are attracting increasing interest among researchers and scientists. The growth trends within the Detection Technique segment of the Gel Documentation Systems Market reveal a shift towards more advanced methodologies and technologies. This evolution is driven by the continuous demand for improved imaging quality and ease of use in research environments. Increasing investments in R&amp;D are further propelling the adoption of Chemiluminescence, as it enables the detection of low-abundance targets with high specificity. As the biotechnology and life sciences sectors expand, the demand for versatile detection methods is expected to increase, favoring the integration of Chemiluminescence into standard workflows alongside established methods like Fluorescence.</p>

<p>Detection Technique: Fluorescence (Dominant) vs. Chemiluminescence (Emerging)</p>

<p>Fluorescence stands as the dominant detection technique within the Gel Documentation Systems Market due to its extensive utility in various applications, including nucleic acid and protein analysis. Its inherent capabilities to offer high sensitivity and reproducibility make it a preferred choice among laboratories worldwide. The technology relies on fluorescent dyes and tags, allowing for the visualization of samples under specific light conditions, which enhances detection clarity. On the other hand, Chemiluminescence, though classified as emerging, is swiftly becoming a noteworthy contender. It harnesses the light produced from chemical reactions to detect biomolecules, providing the advantage of avoiding background noise associated with fluorescence. As research focuses on enhancing detection methods, Chemiluminescence is increasingly favored for its specificity and efficiency, positioning it as a significant player in the evolving Gel Documentation Systems Market landscape.</p>

By Application: Protein Quantification (Largest) vs. Nucleic Acid Quantification (Fastest-Growing)

<p>In the Gel Documentation Systems Market, the application segment showcases a clear distribution with Protein Quantification leading as the largest segment. This dominance can be attributed to the foundational role protein analysis plays in various laboratories and clinical settings. Conversely, Nucleic Acid Quantification is emerging rapidly, gaining traction particularly in research institutions focusing on genomics and molecular biology, thus marking its significance in the segment landscape.</p>

<p>Protein Quantification (Dominant) vs. Nucleic Acid Quantification (Emerging)</p>

<p>Protein Quantification stands as the dominant force within the Gel Documentation Systems Market, primarily due to its extensive applications in biochemistry and clinical diagnostics. The techniques involved are essential for protein analysis, making it integral to numerous research fields. On the other hand, Nucleic Acid Quantification is recognized as an emerging segment, driven by the surging demand for genomic research and personalized medicine. This segment benefits from advancements in technology which enhance accuracy and efficiency, positioning it as a critical player for future growth in the market.</p>

By End User: Pharmaceutical & Biotechnology Companies (Largest) vs. Diagnostic Laboratories (Fastest-Growing)

<p>In the Gel Documentation Systems Market, the segment of Pharmaceutical &amp; Biotechnology Companies dominates the overall market share, contributing significantly due to their extensive research and development activities. This sector utilizes gel documentation systems for various applications, including DNA analysis and protein separation, further bolstering its position as a market leader. In contrast, Diagnostic Laboratories, while currently holding a smaller market share, exhibit remarkable growth trends driven by increasing demand for precise and efficient diagnostic tools essential for various medical conditions.</p>

<p>Pharmaceutical &amp; Biotechnology Companies (Dominant) vs. Diagnostic Laboratories (Emerging)</p>

<p>The Pharmaceutical &amp; Biotechnology Companies segment is characterized by its robust funding for research activities and a continuous need for advanced gel documentation systems to support various applications, including drug development and genetic research. This segment's operational scale often allows for streamlined processes and technological integration, further solidifying its dominant market position. On the other hand, the Diagnostic Laboratories segment is emerging rapidly due to growing investments in healthcare and an increasing emphasis on precision diagnostics. These laboratories require gel documentation systems to enhance their efficiency in processing samples and delivering accurate results, making it a significant player in the evolving landscape of the Gel Documentation Systems Market.</p>

Get more detailed insights about Gel Documentation Systems Market Research Report - Global Forecast till 2035

Regional Insights

Key Companies in the Gel Documentation Systems Market market include

Industry Developments

A definitive business combination agreement has been reached between Gelesis, Inc., a biotherapeutics company developing biomimetic superabsorbent hydrogels to treat excess weight and metabolic disorders, and Capstar Special Purpose Acquisition Corp., a special purpose acquisition company sponsored by Capstar Partners, LLC affiliates and certain private funds managed by PIMCO. Gelesis hopes to revolutionize weight management with the successful beta launch of its first product, Plenity, which is developed using a unique biomimetic medicinal platform.

Researchers at the Universidad Carlos III de Madrid (UC3M) have created a system that uses computer vision techniques to analyze biomedical movies acquired by microscopy in order to characterize and describe the behavior of the cells shown in the images. These novel methods have been applied to measuring live tissues. As a result, the researchers observed that neutrophils immune cells exhibit several behaviors in the blood during inflammatory processes, one of which is linked to the development of cardiovascular disease and is induced by the Fgr protein.Intended Audience:

  • Gel Documentation System Manufacturers and Distributors
  • Pharmaceutical and Biotechnological Companies
  • Contract Research Organizations
  • Academic and Research Institutes
  • Government Associations

Future Outlook

Gel Documentation Systems Market Future Outlook

<p>The Gel Documentation Systems Market is projected to grow at a 4.4% CAGR from 2024 to 2035, driven by technological advancements and increasing demand for efficient laboratory solutions.</p>

New opportunities lie in:

  • <p>Integration of AI for automated image analysis</p>
  • <p>Development of portable gel documentation systems</p>
  • <p>Expansion into emerging markets with tailored solutions</p>

<p>By 2035, the market is expected to achieve robust growth, reflecting evolving laboratory needs.</p>

Market Segmentation

Gel Documentation Systems Market Product Outlook

  • Instruments
  • Accessories
  • Software

Gel Documentation Systems Market End User Outlook

  • Pharmaceutical & Biotechnology Companies
  • Academic Institutes & Research Centers
  • Diagnostic Laboratories
  • Others

Gel Documentation Systems Market Application Outlook

  • Protein Quantification
  • Nucleic Acid Quantification
  • Others

Gel Documentation Systems Market Detection Technique Outlook

  • Ultraviolet
  • Chemiluminescence
  • Fluorescence

Report Scope

MARKET SIZE 2024 0.3654(USD Billion)
MARKET SIZE 2025 0.3815(USD Billion)
MARKET SIZE 2035 0.5868(USD Billion)
COMPOUND ANNUAL GROWTH RATE (CAGR) 4.4% (2024 - 2035)
REPORT COVERAGE Revenue Forecast, Competitive Landscape, Growth Factors, and Trends
BASE YEAR 2024
Market Forecast Period 2025 - 2035
Historical Data 2019 - 2024
Market Forecast Units USD Billion
Key Companies Profiled Market analysis in progress
Segments Covered Market segmentation analysis in progress
Key Market Opportunities Integration of advanced imaging technologies enhances capabilities in the Gel Documentation Systems Market.
Key Market Dynamics Technological advancements and increasing demand for high-resolution imaging drive innovation in the Gel Documentation Systems market.
Countries Covered North America, Europe, APAC, South America, MEA

FAQs

  1. SECTION I: EXECUTIVE SUMMARY AND KEY HIGHLIGHTS
    1. EXECUTIVE SUMMARY
      1. Market Overview
      2. Key Findings
      3. Market Segmentation
      4. Competitive Landscape
      5. Challenges and Opportunities
      6. Future Outlook 2
  2. SECTION II: SCOPING, METHODOLOGY AND MARKET STRUCTURE
    1. MARKET INTRODUCTION
      1. Definition
      2. Scope of the study
    2. RESEARCH METHODOLOGY
      1. Overview
      2. Data Mining
      3. Secondary Research
      4. Primary Research
      5. Forecasting Model
      6. Market Size Estimation
      7. Data Triangulation
      8. Validation 3
  3. SECTION III: QUALITATIVE ANALYSIS
    1. MARKET DYNAMICS
      1. Overview
      2. Drivers
      3. Restraints
      4. Opportunities
    2. MARKET FACTOR ANALYSIS
      1. Value chain Analysis
      2. Porter's Five Forces Analysis
      3. COVID-19 Impact Analysis
  4. SECTION IV: QUANTITATIVE ANALYSIS
    1. Healthcare, BY Product (USD Billion)
      1. Instruments
      2. Accessories
      3. Software
    2. Healthcare, BY Detection Technique (USD Billion)
      1. Ultraviolet
      2. Chemiluminescence
      3. Fluorescence
    3. Healthcare, BY Application (USD Billion)
      1. Protein Quantification
      2. Nucleic Acid Quantification
      3. Others
    4. Healthcare, BY End User (USD Billion)
      1. Pharmaceutical & Biotechnology Companies
      2. Academic Institutes & Research Centers
      3. Diagnostic Laboratories
      4. Others
    5. Healthcare, BY Region (USD Billion)
      1. North America
      2. Europe
      3. APAC
      4. South America
      5. MEA
  5. SECTION V: COMPETITIVE ANALYSIS
    1. Competitive Landscape
      1. Overview
      2. Competitive Analysis
      3. Market share Analysis
      4. Major Growth Strategy in the Healthcare
      5. Competitive Benchmarking
      6. Leading Players in Terms of Number of Developments in the Healthcare
      7. Key developments and growth strategies
      8. Major Players Financial Matrix
    2. Company Profiles
      1. Bio-Rad Laboratories (US)
      2. Thermo Fisher Scientific (US)
      3. GE Healthcare (US)
      4. Syngene International (IN)
      5. Analytik Jena (DE)
      6. UVP, LLC (US)
      7. Cleaver Scientific (GB)
      8. Vilber Lourmat (FR)
      9. Major Science (US)
    3. Appendix
      1. References
      2. Related Reports 6 LIST OF FIGURES
    4. MARKET SYNOPSIS
    5. NORTH AMERICA MARKET ANALYSIS
    6. US MARKET ANALYSIS BY PRODUCT
    7. US MARKET ANALYSIS BY DETECTION TECHNIQUE
    8. US MARKET ANALYSIS BY APPLICATION
    9. US MARKET ANALYSIS BY END USER
    10. CANADA MARKET ANALYSIS BY PRODUCT
    11. CANADA MARKET ANALYSIS BY DETECTION TECHNIQUE
    12. CANADA MARKET ANALYSIS BY APPLICATION
    13. CANADA MARKET ANALYSIS BY END USER
    14. EUROPE MARKET ANALYSIS
    15. GERMANY MARKET ANALYSIS BY PRODUCT
    16. GERMANY MARKET ANALYSIS BY DETECTION TECHNIQUE
    17. GERMANY MARKET ANALYSIS BY APPLICATION
    18. GERMANY MARKET ANALYSIS BY END USER
    19. UK MARKET ANALYSIS BY PRODUCT
    20. UK MARKET ANALYSIS BY DETECTION TECHNIQUE
    21. UK MARKET ANALYSIS BY APPLICATION
    22. UK MARKET ANALYSIS BY END USER
    23. FRANCE MARKET ANALYSIS BY PRODUCT
    24. FRANCE MARKET ANALYSIS BY DETECTION TECHNIQUE
    25. FRANCE MARKET ANALYSIS BY APPLICATION
    26. FRANCE MARKET ANALYSIS BY END USER
    27. RUSSIA MARKET ANALYSIS BY PRODUCT
    28. RUSSIA MARKET ANALYSIS BY DETECTION TECHNIQUE
    29. RUSSIA MARKET ANALYSIS BY APPLICATION
    30. RUSSIA MARKET ANALYSIS BY END USER
    31. ITALY MARKET ANALYSIS BY PRODUCT
    32. ITALY MARKET ANALYSIS BY DETECTION TECHNIQUE
    33. ITALY MARKET ANALYSIS BY APPLICATION
    34. ITALY MARKET ANALYSIS BY END USER
    35. SPAIN MARKET ANALYSIS BY PRODUCT
    36. SPAIN MARKET ANALYSIS BY DETECTION TECHNIQUE
    37. SPAIN MARKET ANALYSIS BY APPLICATION
    38. SPAIN MARKET ANALYSIS BY END USER
    39. REST OF EUROPE MARKET ANALYSIS BY PRODUCT
    40. REST OF EUROPE MARKET ANALYSIS BY DETECTION TECHNIQUE
    41. REST OF EUROPE MARKET ANALYSIS BY APPLICATION
    42. REST OF EUROPE MARKET ANALYSIS BY END USER
    43. APAC MARKET ANALYSIS
    44. CHINA MARKET ANALYSIS BY PRODUCT
    45. CHINA MARKET ANALYSIS BY DETECTION TECHNIQUE
    46. CHINA MARKET ANALYSIS BY APPLICATION
    47. CHINA MARKET ANALYSIS BY END USER
    48. INDIA MARKET ANALYSIS BY PRODUCT
    49. INDIA MARKET ANALYSIS BY DETECTION TECHNIQUE
    50. INDIA MARKET ANALYSIS BY APPLICATION
    51. INDIA MARKET ANALYSIS BY END USER
    52. JAPAN MARKET ANALYSIS BY PRODUCT
    53. JAPAN MARKET ANALYSIS BY DETECTION TECHNIQUE
    54. JAPAN MARKET ANALYSIS BY APPLICATION
    55. JAPAN MARKET ANALYSIS BY END USER
    56. SOUTH KOREA MARKET ANALYSIS BY PRODUCT
    57. SOUTH KOREA MARKET ANALYSIS BY DETECTION TECHNIQUE
    58. SOUTH KOREA MARKET ANALYSIS BY APPLICATION
    59. SOUTH KOREA MARKET ANALYSIS BY END USER
    60. MALAYSIA MARKET ANALYSIS BY PRODUCT
    61. MALAYSIA MARKET ANALYSIS BY DETECTION TECHNIQUE
    62. MALAYSIA MARKET ANALYSIS BY APPLICATION
    63. MALAYSIA MARKET ANALYSIS BY END USER
    64. THAILAND MARKET ANALYSIS BY PRODUCT
    65. THAILAND MARKET ANALYSIS BY DETECTION TECHNIQUE
    66. THAILAND MARKET ANALYSIS BY APPLICATION
    67. THAILAND MARKET ANALYSIS BY END USER
    68. INDONESIA MARKET ANALYSIS BY PRODUCT
    69. INDONESIA MARKET ANALYSIS BY DETECTION TECHNIQUE
    70. INDONESIA MARKET ANALYSIS BY APPLICATION
    71. INDONESIA MARKET ANALYSIS BY END USER
    72. REST OF APAC MARKET ANALYSIS BY PRODUCT
    73. REST OF APAC MARKET ANALYSIS BY DETECTION TECHNIQUE
    74. REST OF APAC MARKET ANALYSIS BY APPLICATION
    75. REST OF APAC MARKET ANALYSIS BY END USER
    76. SOUTH AMERICA MARKET ANALYSIS
    77. BRAZIL MARKET ANALYSIS BY PRODUCT
    78. BRAZIL MARKET ANALYSIS BY DETECTION TECHNIQUE
    79. BRAZIL MARKET ANALYSIS BY APPLICATION
    80. BRAZIL MARKET ANALYSIS BY END USER
    81. MEXICO MARKET ANALYSIS BY PRODUCT
    82. MEXICO MARKET ANALYSIS BY DETECTION TECHNIQUE
    83. MEXICO MARKET ANALYSIS BY APPLICATION
    84. MEXICO MARKET ANALYSIS BY END USER
    85. ARGENTINA MARKET ANALYSIS BY PRODUCT
    86. ARGENTINA MARKET ANALYSIS BY DETECTION TECHNIQUE
    87. ARGENTINA MARKET ANALYSIS BY APPLICATION
    88. ARGENTINA MARKET ANALYSIS BY END USER
    89. REST OF SOUTH AMERICA MARKET ANALYSIS BY PRODUCT
    90. REST OF SOUTH AMERICA MARKET ANALYSIS BY DETECTION TECHNIQUE
    91. REST OF SOUTH AMERICA MARKET ANALYSIS BY APPLICATION
    92. REST OF SOUTH AMERICA MARKET ANALYSIS BY END USER
    93. MEA MARKET ANALYSIS
    94. GCC COUNTRIES MARKET ANALYSIS BY PRODUCT
    95. GCC COUNTRIES MARKET ANALYSIS BY DETECTION TECHNIQUE
    96. GCC COUNTRIES MARKET ANALYSIS BY APPLICATION
    97. GCC COUNTRIES MARKET ANALYSIS BY END USER
    98. SOUTH AFRICA MARKET ANALYSIS BY PRODUCT
    99. SOUTH AFRICA MARKET ANALYSIS BY DETECTION TECHNIQUE
    100. SOUTH AFRICA MARKET ANALYSIS BY APPLICATION
    101. SOUTH AFRICA MARKET ANALYSIS BY END USER
    102. REST OF MEA MARKET ANALYSIS BY PRODUCT
    103. REST OF MEA MARKET ANALYSIS BY DETECTION TECHNIQUE
    104. REST OF MEA MARKET ANALYSIS BY APPLICATION
    105. REST OF MEA MARKET ANALYSIS BY END USER
    106. KEY BUYING CRITERIA OF HEALTHCARE
    107. RESEARCH PROCESS OF MRFR
    108. DRO ANALYSIS OF HEALTHCARE
    109. DRIVERS IMPACT ANALYSIS: HEALTHCARE
    110. RESTRAINTS IMPACT ANALYSIS: HEALTHCARE
    111. SUPPLY / VALUE CHAIN: HEALTHCARE
    112. HEALTHCARE, BY PRODUCT, 2024 (% SHARE)
    113. HEALTHCARE, BY PRODUCT, 2024 TO 2035 (USD Billion)
    114. HEALTHCARE, BY DETECTION TECHNIQUE, 2024 (% SHARE)
    115. HEALTHCARE, BY DETECTION TECHNIQUE, 2024 TO 2035 (USD Billion)
    116. HEALTHCARE, BY APPLICATION, 2024 (% SHARE)
    117. HEALTHCARE, BY APPLICATION, 2024 TO 2035 (USD Billion)
    118. HEALTHCARE, BY END USER, 2024 (% SHARE)
    119. HEALTHCARE, BY END USER, 2024 TO 2035 (USD Billion)
    120. BENCHMARKING OF MAJOR COMPETITORS 7 LIST OF TABLES
    121. LIST OF ASSUMPTIONS
    122. North America MARKET SIZE ESTIMATES; FORECAST
      1. BY PRODUCT, 2025-2035 (USD Billion)
      2. BY DETECTION TECHNIQUE, 2025-2035 (USD Billion)
      3. BY APPLICATION, 2025-2035 (USD Billion)
      4. BY END USER, 2025-2035 (USD Billion)
    123. US MARKET SIZE ESTIMATES; FORECAST
      1. BY PRODUCT, 2025-2035 (USD Billion)
      2. BY DETECTION TECHNIQUE, 2025-2035 (USD Billion)
      3. BY APPLICATION, 2025-2035 (USD Billion)
      4. BY END USER, 2025-2035 (USD Billion)
    124. Canada MARKET SIZE ESTIMATES; FORECAST
      1. BY PRODUCT, 2025-2035 (USD Billion)
      2. BY DETECTION TECHNIQUE, 2025-2035 (USD Billion)
      3. BY APPLICATION, 2025-2035 (USD Billion)
      4. BY END USER, 2025-2035 (USD Billion)
    125. Europe MARKET SIZE ESTIMATES; FORECAST
      1. BY PRODUCT, 2025-2035 (USD Billion)
      2. BY DETECTION TECHNIQUE, 2025-2035 (USD Billion)
      3. BY APPLICATION, 2025-2035 (USD Billion)
      4. BY END USER, 2025-2035 (USD Billion)
    126. Germany MARKET SIZE ESTIMATES; FORECAST
      1. BY PRODUCT, 2025-2035 (USD Billion)
      2. BY DETECTION TECHNIQUE, 2025-2035 (USD Billion)
      3. BY APPLICATION, 2025-2035 (USD Billion)
      4. BY END USER, 2025-2035 (USD Billion)
    127. UK MARKET SIZE ESTIMATES; FORECAST
      1. BY PRODUCT, 2025-2035 (USD Billion)
      2. BY DETECTION TECHNIQUE, 2025-2035 (USD Billion)
      3. BY APPLICATION, 2025-2035 (USD Billion)
      4. BY END USER, 2025-2035 (USD Billion)
    128. France MARKET SIZE ESTIMATES; FORECAST
      1. BY PRODUCT, 2025-2035 (USD Billion)
      2. BY DETECTION TECHNIQUE, 2025-2035 (USD Billion)
      3. BY APPLICATION, 2025-2035 (USD Billion)
      4. BY END USER, 2025-2035 (USD Billion)
    129. Russia MARKET SIZE ESTIMATES; FORECAST
      1. BY PRODUCT, 2025-2035 (USD Billion)
      2. BY DETECTION TECHNIQUE, 2025-2035 (USD Billion)
      3. BY APPLICATION, 2025-2035 (USD Billion)
      4. BY END USER, 2025-2035 (USD Billion)
    130. Italy MARKET SIZE ESTIMATES; FORECAST
      1. BY PRODUCT, 2025-2035 (USD Billion)
      2. BY DETECTION TECHNIQUE, 2025-2035 (USD Billion)
      3. BY APPLICATION, 2025-2035 (USD Billion)
      4. BY END USER, 2025-2035 (USD Billion)
    131. Spain MARKET SIZE ESTIMATES; FORECAST
      1. BY PRODUCT, 2025-2035 (USD Billion)
      2. BY DETECTION TECHNIQUE, 2025-2035 (USD Billion)
      3. BY APPLICATION, 2025-2035 (USD Billion)
      4. BY END USER, 2025-2035 (USD Billion)
    132. Rest of Europe MARKET SIZE ESTIMATES; FORECAST
      1. BY PRODUCT, 2025-2035 (USD Billion)
      2. BY DETECTION TECHNIQUE, 2025-2035 (USD Billion)
      3. BY APPLICATION, 2025-2035 (USD Billion)
      4. BY END USER, 2025-2035 (USD Billion)
    133. APAC MARKET SIZE ESTIMATES; FORECAST
      1. BY PRODUCT, 2025-2035 (USD Billion)
      2. BY DETECTION TECHNIQUE, 2025-2035 (USD Billion)
      3. BY APPLICATION, 2025-2035 (USD Billion)
      4. BY END USER, 2025-2035 (USD Billion)
    134. China MARKET SIZE ESTIMATES; FORECAST
      1. BY PRODUCT, 2025-2035 (USD Billion)
      2. BY DETECTION TECHNIQUE, 2025-2035 (USD Billion)
      3. BY APPLICATION, 2025-2035 (USD Billion)
      4. BY END USER, 2025-2035 (USD Billion)
    135. India MARKET SIZE ESTIMATES; FORECAST
      1. BY PRODUCT, 2025-2035 (USD Billion)
      2. BY DETECTION TECHNIQUE, 2025-2035 (USD Billion)
      3. BY APPLICATION, 2025-2035 (USD Billion)
      4. BY END USER, 2025-2035 (USD Billion)
    136. Japan MARKET SIZE ESTIMATES; FORECAST
      1. BY PRODUCT, 2025-2035 (USD Billion)
      2. BY DETECTION TECHNIQUE, 2025-2035 (USD Billion)
      3. BY APPLICATION, 2025-2035 (USD Billion)
      4. BY END USER, 2025-2035 (USD Billion)
    137. South Korea MARKET SIZE ESTIMATES; FORECAST
      1. BY PRODUCT, 2025-2035 (USD Billion)
      2. BY DETECTION TECHNIQUE, 2025-2035 (USD Billion)
      3. BY APPLICATION, 2025-2035 (USD Billion)
      4. BY END USER, 2025-2035 (USD Billion)
    138. Malaysia MARKET SIZE ESTIMATES; FORECAST
      1. BY PRODUCT, 2025-2035 (USD Billion)
      2. BY DETECTION TECHNIQUE, 2025-2035 (USD Billion)
      3. BY APPLICATION, 2025-2035 (USD Billion)
      4. BY END USER, 2025-2035 (USD Billion)
    139. Thailand MARKET SIZE ESTIMATES; FORECAST
      1. BY PRODUCT, 2025-2035 (USD Billion)
      2. BY DETECTION TECHNIQUE, 2025-2035 (USD Billion)
      3. BY APPLICATION, 2025-2035 (USD Billion)
      4. BY END USER, 2025-2035 (USD Billion)
    140. Indonesia MARKET SIZE ESTIMATES; FORECAST
      1. BY PRODUCT, 2025-2035 (USD Billion)
      2. BY DETECTION TECHNIQUE, 2025-2035 (USD Billion)
      3. BY APPLICATION, 2025-2035 (USD Billion)
      4. BY END USER, 2025-2035 (USD Billion)
    141. Rest of APAC MARKET SIZE ESTIMATES; FORECAST
      1. BY PRODUCT, 2025-2035 (USD Billion)
      2. BY DETECTION TECHNIQUE, 2025-2035 (USD Billion)
      3. BY APPLICATION, 2025-2035 (USD Billion)
      4. BY END USER, 2025-2035 (USD Billion)
    142. South America MARKET SIZE ESTIMATES; FORECAST
      1. BY PRODUCT, 2025-2035 (USD Billion)
      2. BY DETECTION TECHNIQUE, 2025-2035 (USD Billion)
      3. BY APPLICATION, 2025-2035 (USD Billion)
      4. BY END USER, 2025-2035 (USD Billion)
    143. Brazil MARKET SIZE ESTIMATES; FORECAST
      1. BY PRODUCT, 2025-2035 (USD Billion)
      2. BY DETECTION TECHNIQUE, 2025-2035 (USD Billion)
      3. BY APPLICATION, 2025-2035 (USD Billion)
      4. BY END USER, 2025-2035 (USD Billion)
    144. Mexico MARKET SIZE ESTIMATES; FORECAST
      1. BY PRODUCT, 2025-2035 (USD Billion)
      2. BY DETECTION TECHNIQUE, 2025-2035 (USD Billion)
      3. BY APPLICATION, 2025-2035 (USD Billion)
      4. BY END USER, 2025-2035 (USD Billion)
    145. Argentina MARKET SIZE ESTIMATES; FORECAST
      1. BY PRODUCT, 2025-2035 (USD Billion)
      2. BY DETECTION TECHNIQUE, 2025-2035 (USD Billion)
      3. BY APPLICATION, 2025-2035 (USD Billion)
      4. BY END USER, 2025-2035 (USD Billion)
    146. Rest of South America MARKET SIZE ESTIMATES; FORECAST
      1. BY PRODUCT, 2025-2035 (USD Billion)
      2. BY DETECTION TECHNIQUE, 2025-2035 (USD Billion)
      3. BY APPLICATION, 2025-2035 (USD Billion)
      4. BY END USER, 2025-2035 (USD Billion)
    147. MEA MARKET SIZE ESTIMATES; FORECAST
      1. BY PRODUCT, 2025-2035 (USD Billion)
      2. BY DETECTION TECHNIQUE, 2025-2035 (USD Billion)
      3. BY APPLICATION, 2025-2035 (USD Billion)
      4. BY END USER, 2025-2035 (USD Billion)
    148. GCC Countries MARKET SIZE ESTIMATES; FORECAST
      1. BY PRODUCT, 2025-2035 (USD Billion)
      2. BY DETECTION TECHNIQUE, 2025-2035 (USD Billion)
      3. BY APPLICATION, 2025-2035 (USD Billion)
      4. BY END USER, 2025-2035 (USD Billion)
    149. South Africa MARKET SIZE ESTIMATES; FORECAST
      1. BY PRODUCT, 2025-2035 (USD Billion)
      2. BY DETECTION TECHNIQUE, 2025-2035 (USD Billion)
      3. BY APPLICATION, 2025-2035 (USD Billion)
      4. BY END USER, 2025-2035 (USD Billion)
    150. Rest of MEA MARKET SIZE ESTIMATES; FORECAST
      1. BY PRODUCT, 2025-2035 (USD Billion)
      2. BY DETECTION TECHNIQUE, 2025-2035 (USD Billion)
      3. BY APPLICATION, 2025-2035 (USD Billion)
      4. BY END USER, 2025-2035 (USD Billion)
    151. PRODUCT LAUNCH/PRODUCT DEVELOPMENT/APPROVAL
    152. ACQUISITION/PARTNERSHIP

Gel Documentation Systems Market Segmentation

Market Segmentation Overview

  • Detailed segmentation data will be available in the full report
  • Comprehensive analysis by multiple parameters
  • Regional and country-level breakdowns
  • Market size forecasts by segment
Infographic

Free Sample Request

Kindly complete the form below to receive a free sample of this Report

Get Free Sample

Customer Strories

“I am very pleased with how market segments have been defined in a relevant way for my purposes (such as "Portable Freezers & refrigerators" and "last-mile"). In general the report is well structured. Thanks very much for your efforts.”

Victoria Milne

Founder

Compare Licence

×
Features License Type
Single User Multiuser License Enterprise User
Price $4,950 $5,950 $7,250
Maximum User Access Limit 1 User Upto 10 Users Unrestricted Access Throughout the Organization
Free Customization
Direct Access to Analyst
Deliverable Format
Platform Access
Discount on Next Purchase 10% 15% 15%
Printable Versions