

GCC Medical Device Market Segmentation
Medical Device By Type (USD Million, 2025-2035)
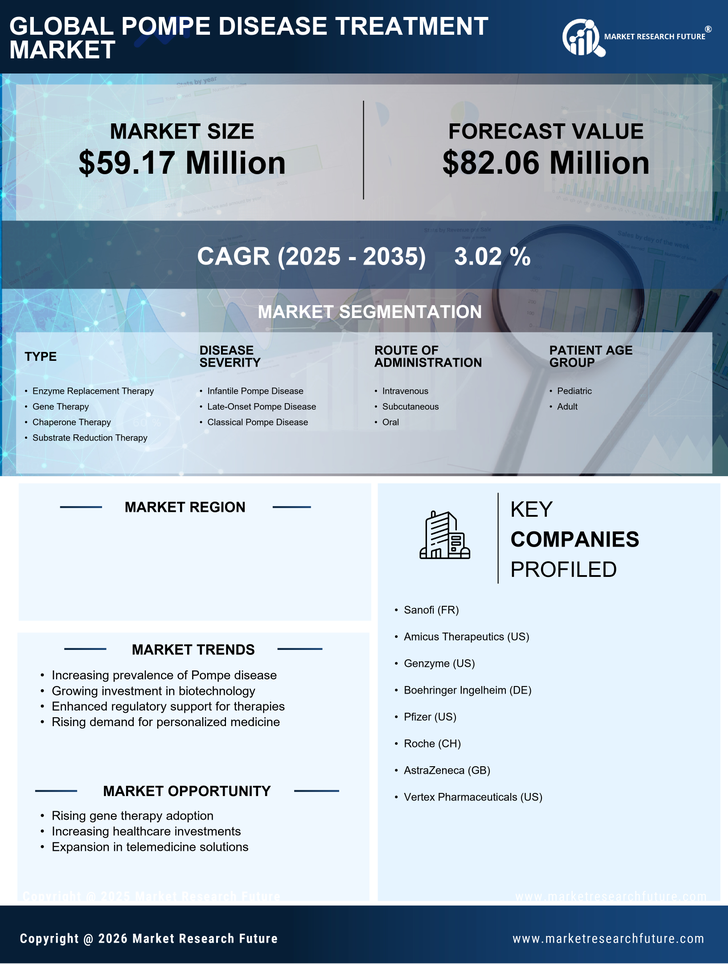
- Enzyme Replacement Therapy
- Gene Therapy
- Chaperone Therapy
- Substrate Reduction Therapy
Medical Device By Disease Severity (USD Million, 2025-2035)
- Infantile Pompe Disease
- Late-Onset Pompe Disease
- Classical Pompe Disease
Medical Device By Route of Administration (USD Million, 2025-2035)
- Intravenous
- Subcutaneous
- Oral
Medical Device By Patient Age Group (USD Million, 2025-2035)
- Pediatric
- Adult


