GCC Industrial Automation & Equipment Market Segmentation
Industrial Automation & Equipment By Drug Class (USD Million, 2025-2035)
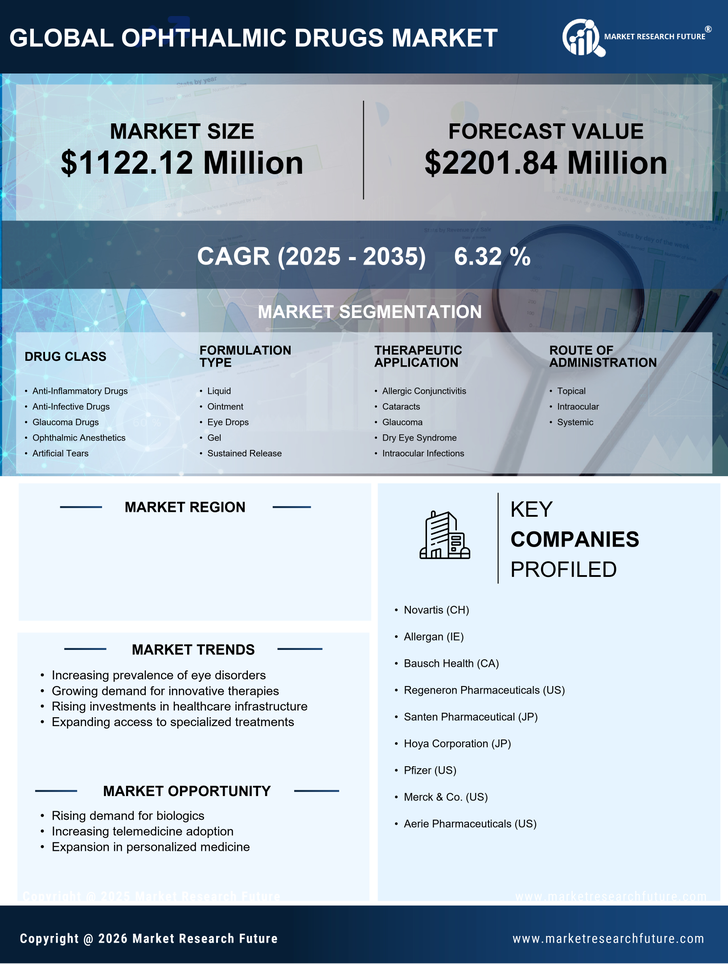
- Anti-Inflammatory Drugs
- Anti-Infective Drugs
- Glaucoma Drugs
- Ophthalmic Anesthetics
- Artificial Tears
Industrial Automation & Equipment By Formulation Type (USD Million, 2025-2035)
- Liquid
- Ointment
- Eye Drops
- Gel
- Sustained Release
Industrial Automation & Equipment By Therapeutic Application (USD Million, 2025-2035)
- Allergic Conjunctivitis
- Cataracts
- Glaucoma
- Dry Eye Syndrome
- Intraocular Infections
Industrial Automation & Equipment By Route of Administration (USD Million, 2025-2035)
- Topical
- Intraocular
- Systemic