Request Free Sample ×

Kindly complete the form below to receive a free sample of this Report

* Please use a valid business email

Leading companies partner with us for data-driven Insights

clients tt-cursor
Hero Background

GCC Dietary Supplements Market

ID: MRFR/FnB/45956-HCR
128 Pages
Varsha More
Last Updated: April 06, 2026

GCC Dietary Supplements Market Size, Share, Industry Trend & Analysis Research Report By Type (Vitamins, Minerals, Amino Acids & Proteins, Probiotics, Blends), By form (Tablets, Capsules & Softgels, Powders, Gummies) and By Distribution channel (Store, Non-store) - Forecast to 2035

Share:
Download PDF ×

We do not share your information with anyone. However, we may send you emails based on your report interest from time to time. You may contact us at any time to opt-out.

GCC Dietary Supplements Market Infographic
Purchase Options
  1. 1 SECTION I: EXECUTIVE SUMMARY AND KEY HIGHLIGHTS
    1. 1.1 EXECUTIVE SUMMARY
      1. 1.1.1 Market Overview
      2. 1.1.2 Key Findings
      3. 1.1.3 Market Segmentation
      4. 1.1.4 Competitive Landscape
      5. 1.1.5 Challenges and Opportunities
      6. 1.1.6 Future Outlook
  2. 2 SECTION II: SCOPING, METHODOLOGY AND MARKET STRUCTURE
    1. 2.1 MARKET INTRODUCTION
      1. 2.1.1 Definition
      2. 2.1.2 Scope of the study
        1. 2.1.2.1 Research Objective
        2. 2.1.2.2 Assumption
        3. 2.1.2.3 Limitations
    2. 2.2 RESEARCH METHODOLOGY
      1. 2.2.1 Overview
      2. 2.2.2 Data Mining
      3. 2.2.3 Secondary Research
      4. 2.2.4 Primary Research
        1. 2.2.4.1 Primary Interviews and Information Gathering Process
        2. 2.2.4.2 Breakdown of Primary Respondents
      5. 2.2.5 Forecasting Model
      6. 2.2.6 Market Size Estimation
        1. 2.2.6.1 Bottom-Up Approach
        2. 2.2.6.2 Top-Down Approach
      7. 2.2.7 Data Triangulation
      8. 2.2.8 Validation
  3. 3 SECTION III: QUALITATIVE ANALYSIS
    1. 3.1 MARKET DYNAMICS
      1. 3.1.1 Overview
      2. 3.1.2 Drivers
      3. 3.1.3 Restraints
      4. 3.1.4 Opportunities
    2. 3.2 MARKET FACTOR ANALYSIS
      1. 3.2.1 Value chain Analysis
      2. 3.2.2 Porter's Five Forces Analysis
        1. 3.2.2.1 Bargaining Power of Suppliers
        2. 3.2.2.2 Bargaining Power of Buyers
        3. 3.2.2.3 Threat of New Entrants
        4. 3.2.2.4 Threat of Substitutes
        5. 3.2.2.5 Intensity of Rivalry
      3. 3.2.3 COVID-19 Impact Analysis
        1. 3.2.3.1 Market Impact Analysis
        2. 3.2.3.2 Regional Impact
        3. 3.2.3.3 Opportunity and Threat Analysis
  4. 4 SECTION IV: QUANTITATIVE ANALYSIS
    1. 4.1 Life Sciences, BY Form (USD Billion)
      1. 4.1.1 Tablets
      2. 4.1.2 Capsules
      3. 4.1.3 Powders
      4. 4.1.4 Liquids
      5. 4.1.5 Soft gels
    2. 4.2 Life Sciences, BY Ingredients (USD Billion)
      1. 4.2.1 Vitamins
      2. 4.2.2 Minerals
      3. 4.2.3 Herbs
      4. 4.2.4 Amino Acids
      5. 4.2.5 Enzymes
    3. 4.3 Life Sciences, BY Distribution Channel (USD Billion)
      1. 4.3.1 Online
      2. 4.3.2 Supermarkets
      3. 4.3.3 Health Food Stores
      4. 4.3.4 Pharmacies
      5. 4.3.5 Direct Sales
    4. 4.4 Life Sciences, BY End-user (USD Billion)
      1. 4.4.1 Adults
      2. 4.4.2 Children
      3. 4.4.3 Pregnant Women
      4. 4.4.4 Elderly
  5. 5 SECTION V: COMPETITIVE ANALYSIS
    1. 5.1 Competitive Landscape
      1. 5.1.1 Overview
      2. 5.1.2 Competitive Analysis
      3. 5.1.3 Market share Analysis
      4. 5.1.4 Major Growth Strategy in the Life Sciences
      5. 5.1.5 Competitive Benchmarking
      6. 5.1.6 Leading Players in Terms of Number of Developments in the Life Sciences
      7. 5.1.7 Key developments and growth strategies
        1. 5.1.7.1 New Product Launch/Service Deployment
        2. 5.1.7.2 Merger & Acquisitions
        3. 5.1.7.3 Joint Ventures
      8. 5.1.8 Major Players Financial Matrix
        1. 5.1.8.1 Sales and Operating Income
        2. 5.1.8.2 Major Players R&D Expenditure. 2023
    2. 5.2 Company Profiles
      1. 5.2.1 Herbalife (US)
        1. 5.2.1.1 Financial Overview
        2. 5.2.1.2 Products Offered
        3. 5.2.1.3 Key Developments
        4. 5.2.1.4 SWOT Analysis
        5. 5.2.1.5 Key Strategies
      2. 5.2.2 Amway (US)
        1. 5.2.2.1 Financial Overview
        2. 5.2.2.2 Products Offered
        3. 5.2.2.3 Key Developments
        4. 5.2.2.4 SWOT Analysis
        5. 5.2.2.5 Key Strategies
      3. 5.2.3 GNC Holdings (US)
        1. 5.2.3.1 Financial Overview
        2. 5.2.3.2 Products Offered
        3. 5.2.3.3 Key Developments
        4. 5.2.3.4 SWOT Analysis
        5. 5.2.3.5 Key Strategies
      4. 5.2.4 Nature's Bounty (US)
        1. 5.2.4.1 Financial Overview
        2. 5.2.4.2 Products Offered
        3. 5.2.4.3 Key Developments
        4. 5.2.4.4 SWOT Analysis
        5. 5.2.4.5 Key Strategies
      5. 5.2.5 Abbott Laboratories (US)
        1. 5.2.5.1 Financial Overview
        2. 5.2.5.2 Products Offered
        3. 5.2.5.3 Key Developments
        4. 5.2.5.4 SWOT Analysis
        5. 5.2.5.5 Key Strategies
      6. 5.2.6 Nestle (CH)
        1. 5.2.6.1 Financial Overview
        2. 5.2.6.2 Products Offered
        3. 5.2.6.3 Key Developments
        4. 5.2.6.4 SWOT Analysis
        5. 5.2.6.5 Key Strategies
      7. 5.2.7 Bayer AG (DE)
        1. 5.2.7.1 Financial Overview
        2. 5.2.7.2 Products Offered
        3. 5.2.7.3 Key Developments
        4. 5.2.7.4 SWOT Analysis
        5. 5.2.7.5 Key Strategies
      8. 5.2.8 Pfizer Inc. (US)
        1. 5.2.8.1 Financial Overview
        2. 5.2.8.2 Products Offered
        3. 5.2.8.3 Key Developments
        4. 5.2.8.4 SWOT Analysis
        5. 5.2.8.5 Key Strategies
      9. 5.2.9 Blackmores (AU)
        1. 5.2.9.1 Financial Overview
        2. 5.2.9.2 Products Offered
        3. 5.2.9.3 Key Developments
        4. 5.2.9.4 SWOT Analysis
        5. 5.2.9.5 Key Strategies
    3. 5.3 Appendix
      1. 5.3.1 References
      2. 5.3.2 Related Reports
  6. 6 LIST OF FIGURES
    1. 6.1 MARKET SYNOPSIS
    2. 6.2 GCC MARKET ANALYSIS BY FORM
    3. 6.3 GCC MARKET ANALYSIS BY INGREDIENTS
    4. 6.4 GCC MARKET ANALYSIS BY DISTRIBUTION CHANNEL
    5. 6.5 GCC MARKET ANALYSIS BY END-USER
    6. 6.6 KEY BUYING CRITERIA OF LIFE SCIENCES
    7. 6.7 RESEARCH PROCESS OF MRFR
    8. 6.8 DRO ANALYSIS OF LIFE SCIENCES
    9. 6.9 DRIVERS IMPACT ANALYSIS: LIFE SCIENCES
    10. 6.10 RESTRAINTS IMPACT ANALYSIS: LIFE SCIENCES
    11. 6.11 SUPPLY / VALUE CHAIN: LIFE SCIENCES
    12. 6.12 LIFE SCIENCES, BY FORM, 2024 (% SHARE)
    13. 6.13 LIFE SCIENCES, BY FORM, 2024 TO 2035 (USD Billion)
    14. 6.14 LIFE SCIENCES, BY INGREDIENTS, 2024 (% SHARE)
    15. 6.15 LIFE SCIENCES, BY INGREDIENTS, 2024 TO 2035 (USD Billion)
    16. 6.16 LIFE SCIENCES, BY DISTRIBUTION CHANNEL, 2024 (% SHARE)
    17. 6.17 LIFE SCIENCES, BY DISTRIBUTION CHANNEL, 2024 TO 2035 (USD Billion)
    18. 6.18 LIFE SCIENCES, BY END-USER, 2024 (% SHARE)
    19. 6.19 LIFE SCIENCES, BY END-USER, 2024 TO 2035 (USD Billion)
    20. 6.20 BENCHMARKING OF MAJOR COMPETITORS
  7. 7 LIST OF TABLES
    1. 7.1 LIST OF ASSUMPTIONS
  8. 7.1.1
    1. 7.2 GCC MARKET SIZE ESTIMATES; FORECAST
      1. 7.2.1 BY FORM, 2025-2035 (USD Billion)
      2. 7.2.2 BY INGREDIENTS, 2025-2035 (USD Billion)
      3. 7.2.3 BY DISTRIBUTION CHANNEL, 2025-2035 (USD Billion)
      4. 7.2.4 BY END-USER, 2025-2035 (USD Billion)
    2. 7.3 PRODUCT LAUNCH/PRODUCT DEVELOPMENT/APPROVAL
  9. 7.3.1
    1. 7.4 ACQUISITION/PARTNERSHIP
  10. 7.4.1

GCC Life Sciences Market Segmentation

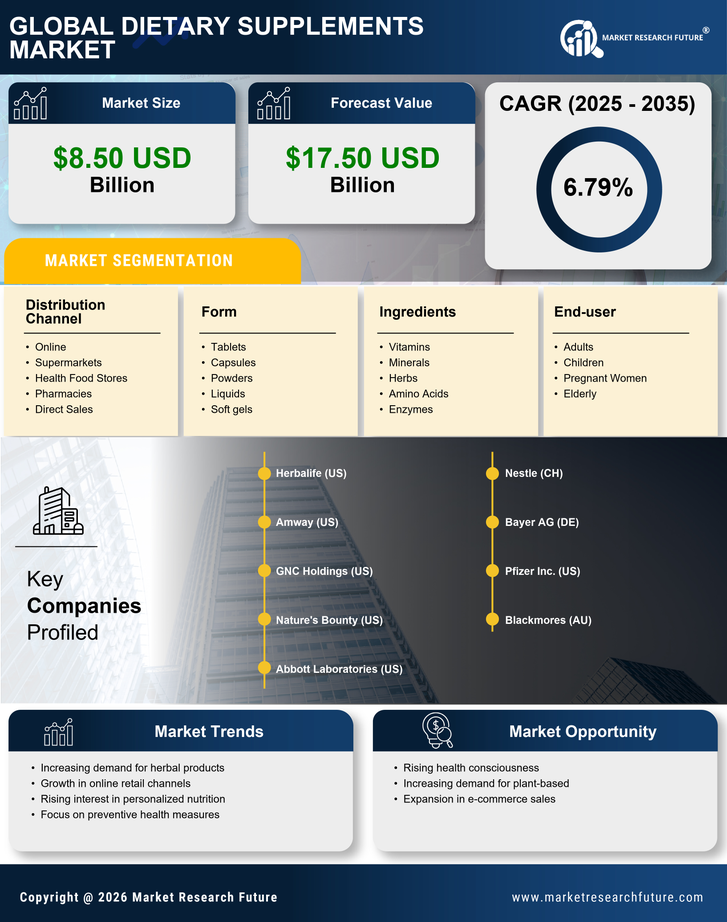
Life Sciences By Form (USD Billion, 2025-2035)

  • Tablets
  • Capsules
  • Powders
  • Liquids
  • Soft gels

Life Sciences By Ingredients (USD Billion, 2025-2035)

  • Vitamins
  • Minerals
  • Herbs
  • Amino Acids
  • Enzymes

Life Sciences By Distribution Channel (USD Billion, 2025-2035)

  • Online
  • Supermarkets
  • Health Food Stores
  • Pharmacies
  • Direct Sales

Life Sciences By End-user (USD Billion, 2025-2035)

  • Adults
  • Children
  • Pregnant Women
  • Elderly

Compare Licence

×
Features License Type
Single User Multiuser License Enterprise User
Price $4,950 $5,950 $7,250
Maximum User Access Limit 1 User Upto 10 Users Unrestricted Access Throughout the Organization
Free Customization
Direct Access to Analyst
Deliverable Format
Platform Access
Discount on Next Purchase 10% 15% 15%
Printable Versions