Food Fortification Market Segmentation
Food Fortification Market By Application (USD Billion, 2025-2035)
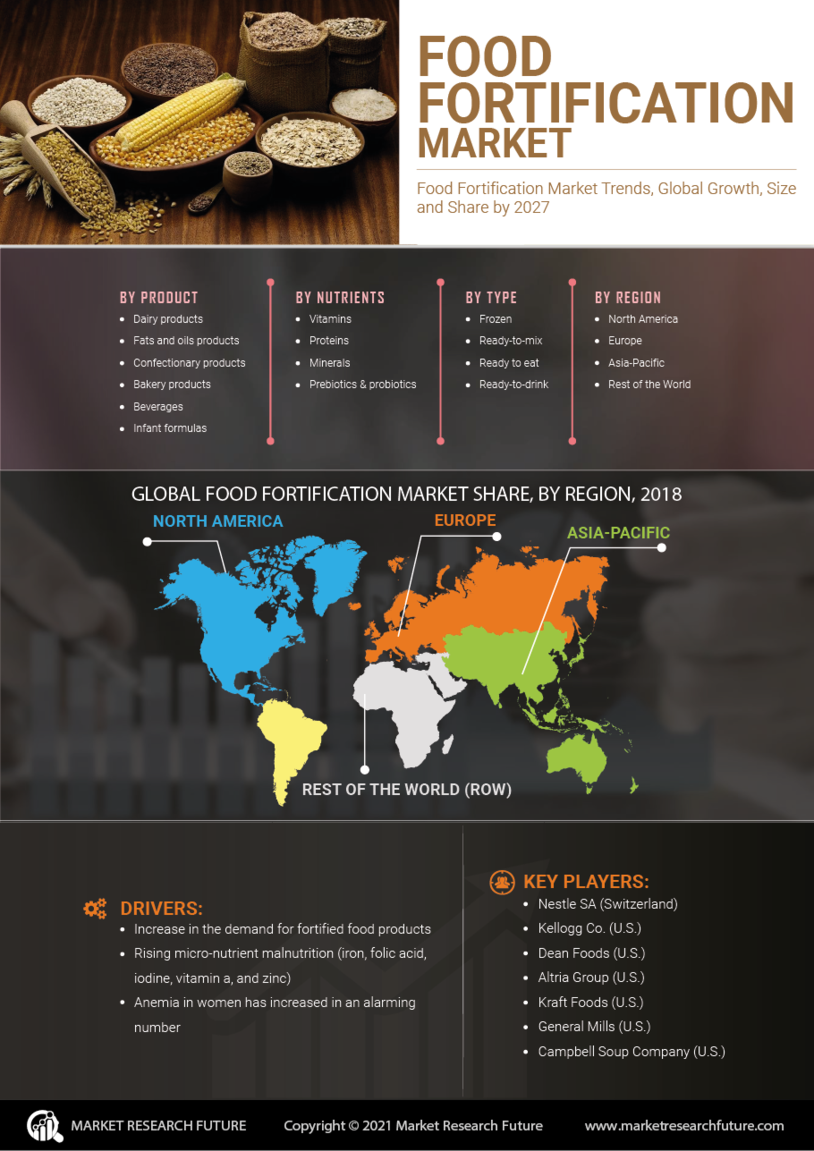
- Beverages
- Dairy Products
- Bakery Products
- Snacks
- Cereals
Food Fortification Market By Nutrient Type (USD Billion, 2025-2035)
- Vitamins
- Minerals
- Amino Acids
- Fatty Acids
- Probiotics
Food Fortification Market By End Use (USD Billion, 2025-2035)
- Food Industry
- Nutraceuticals
- Pharmaceuticals
- Animal Feed
- Household
Food Fortification Market By Formulation Type (USD Billion, 2025-2035)
- Powder
- Liquid
- Granular
- Tablet
- Capsule
Food Fortification Market By Distribution Channel (USD Billion, 2025-2035)
- Online Retail
- Supermarkets
- Health Food Stores
- Pharmacies
- Direct Sales