Digital X-rays Market Segmentation
Digital X-rays Market By Digital X-rays Market (USD Billion, 2025-2035)
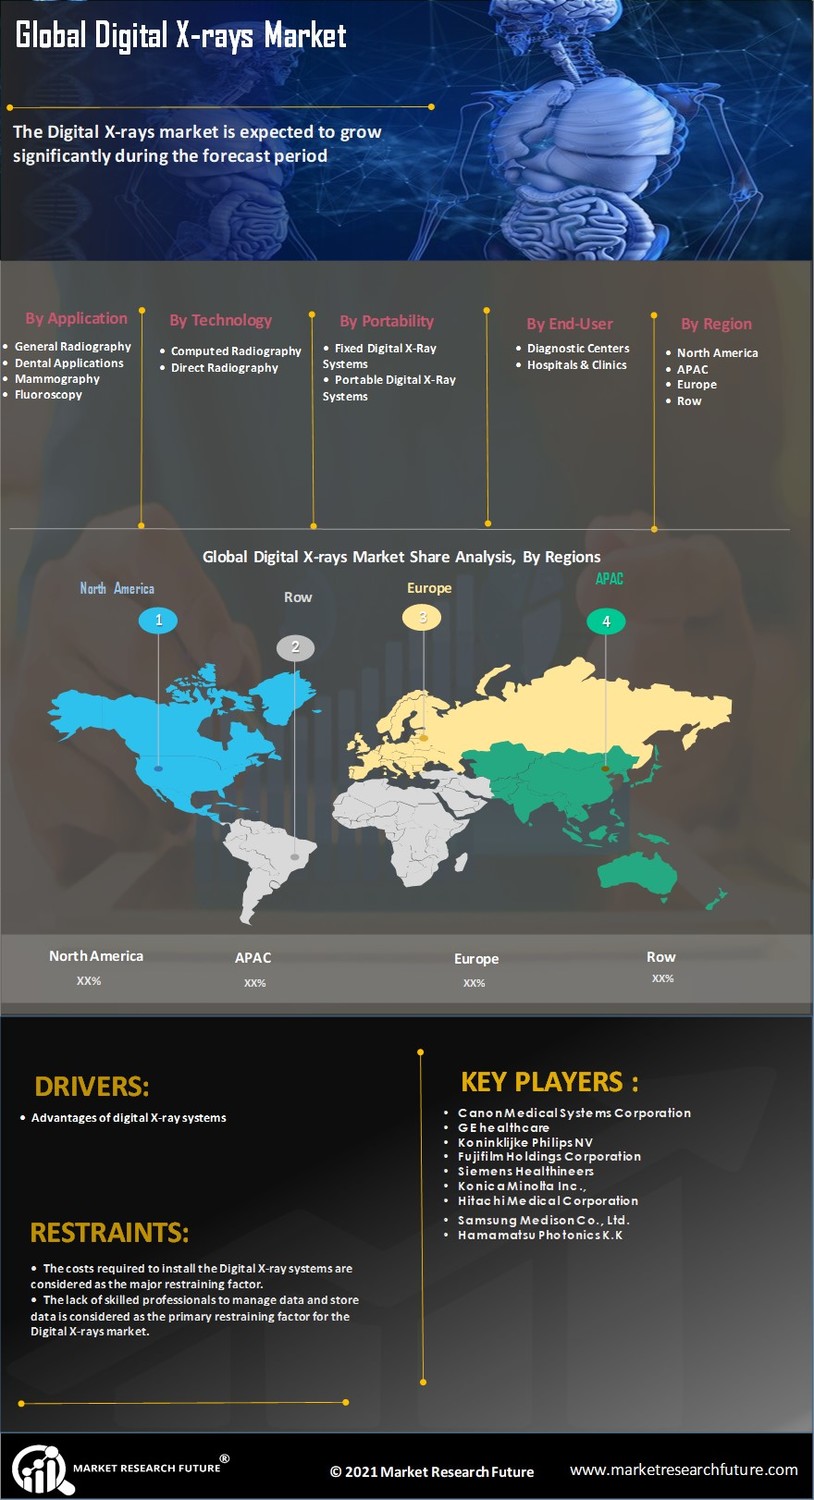
- Computed Radiography
- Direct Digital Radiography
- Flat Panel Detectors
- Charge Coupled Devices
Digital X-rays Market By Application (USD Billion, 2025-2035)
- Dental Imaging
- Medical Imaging
- Veterinary Imaging
- Industrial Non-Destructive Testing
Digital X-rays Market By End Use (USD Billion, 2025-2035)
- Hospitals
- Clinics
- Diagnostic Imaging Centers
- Research Institutions
Digital X-rays Market By Detector Type (USD Billion, 2025-2035)
- Film-based Detectors
- Digital Detectors
- Hybrid Detectors