ID: MRFR/HCIT/5117-HCR | February 2021 | Region: Global | 100 pages
Digital X-rays are a form of radiography which uses sensors instead of photographic film, which is the traditional method. This offers several advantages in medical imaging as it increases time efficiency and produces less radiation than conventional methods of X-raying. Advancements in medical technology have been widely adopted. The ability of digital X-rays to provide real-time results has reduced the time for diagnosis and prescription of treatments, thus making the process more seamless. This is a significant driver as it assists in optimizing patient care in a rapidly growing healthcare sector.
Globally, with the rising population, the demand for efficient healthcare has grown drastically. Digital x-ray technology offers a number of advantages which support market growth. Technological advancements have resulted in the development of portable x-ray systems which are lightweight and make x-ray imagine easier while reducing radiation levels associated with traditional X-ray imaging technology. Digital x-rays can be shared via the internet with great ease making remote care possible. Constant development in medical technology is likely to reveal growth opportunities in the market.
Report Overview
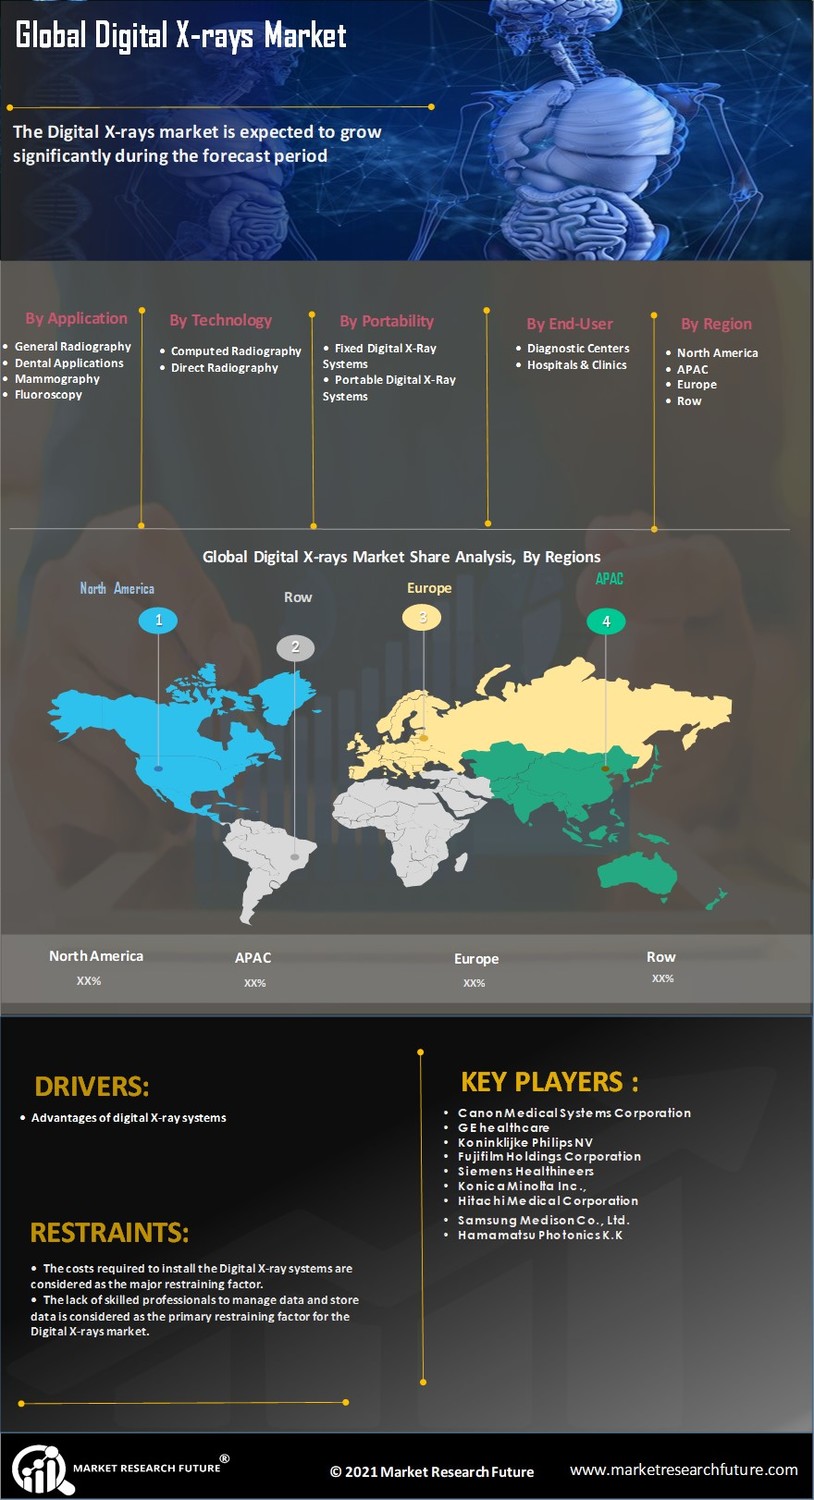
The market study on the global digital X-ray market covers a variety of micro and macroeconomic factors that affect the market. Analysis of the market has revealed various drivers, threats and challenges which have been included in the report. In the course of study, opportunities have been identified and added to the report. Region outlook and division of the market into its various segments in the report, offer a detailed view of the market through its components. This, in turn, provides a comprehensive view of the market as a whole. The segmental analysis in the report is performed on the basis of applications, technology, portability, end-user, and region.
Players Covered
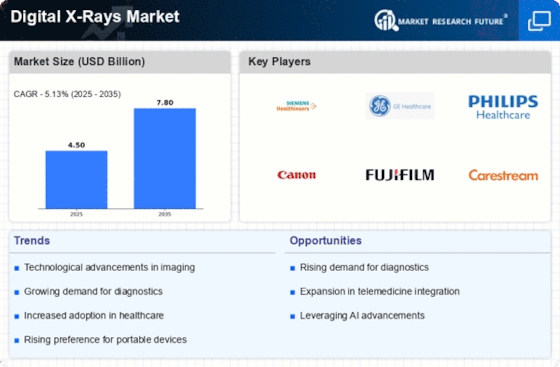
Eminent market participants included in the report are GE Healthcare, Koninklijke Philips N.V., Canon Inc., Carestream Health, Philips Healthcare, Seimens AG, Konica Minolta Inc., Hitachi Medical Corporation, Shimadzu Corporation, Fujifilm Corporation, Toshiba Medical Systems Corporation, Samsung Medison Co. Ltd and others
Research Methodology
At the beginning of every market study, Market Research Future invests valuable hours in the procurement of all relevant raw data applicable to the market. Primary and secondary sources are pursued for information. Primary sources include interviews with executives at leading organizations operating in the global public key infrastructure market. Secondary resources used for data collection include journals & periodicals, company reports, SEC filings, and other public sources. This results in a multitude of data which is then distilled into precise points which are pertinent to the growth of the market. Historical data, current trends and various micro and macroeconomic factors are taken into account for the forecasting of the future of the market. For market size estimation and validation, MRFR utilizes both top-down and bottom-up approaches to ensure accuracy. Complete transparency in the process and the ability of MRFR's expert data analysts to astutely make intelligent observations regarding market influencing factors provides clients with the ability to make important business decisions with confidence.
Intended Audience
Segmentation
By Application
By Technology
By Portability
By End-User
By Region
Frequently Asked Questions (FAQ) :
Rising prevalence of acute diseases and adoption of advanced technology are the key factors driving the digital x-rays market.
Lack of details may limit the digital x-rays market growth.
Digital x-rays are widely used in fluoroscopy, mammography, dental applications, and general radiology.
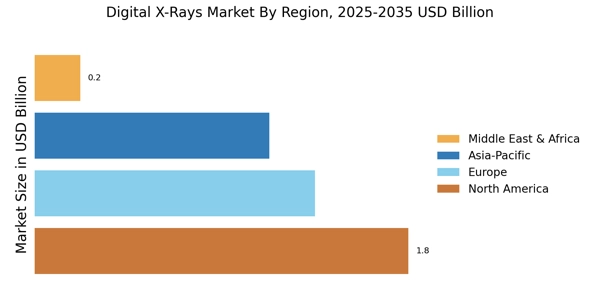
North America is predicted to have the largest share in the digital x-rays market.
Key players profiled in the digital x-rays market include Samsung Medison Co. Ltd, Fujifilm Corporation, Hitachi Medical Corporation, Toshiba Medical Systems Corporation, Konica Minolta Inc., Seimens AG, Shimadzu Corporation, Philips Healthcare, Carestream Health, Canon Inc., GE Healthcare, and Koninklijke Philips N.V.
Table of Contents:
Chapter 1. Report Prologue
Chapter 2. Market Introduction
2.1 Definition
2.2 Scope of the Study
2.2.1 Research Objective
2.2.2 Assumptions
2.2.3 Limitations
Chapter 3. Research Methodology
3.1 Introduction
3.2 Primary Research
3.3 Secondary Research
3.4 Market Size Estimation
Chapter 4. Market Dynamics
4.1 Drivers
4.2 Restraints
4.3 Opportunities
4.4 Challenges
4.5 Macroeconomic Indicators
4.6 Technology Trends & Assessment
Chapter 5. Market Factor Analysis
5.1 Porter’s Five Forces Analysis
5.1.1 Bargaining Power of Suppliers
5.1.2 Bargaining Power of Buyers
5.1.3 Threat of New Entrants
5.1.4 Threat of Substitutes
5.1.5 Intensity of Rivalry
5.2 Value Chain Analysis
5.3 Investment Feasibility Analysis
5.4 Pricing Analysis
Chapter 6. Global Digital X-rays Market, by Application
6.1 Introduction
6.2 General Radiography
Market Estimates & Forecast, by Region, 2018-2023
Market Estimates & Forecast, by Country, 2018-2023
6.2.1 Chest Imaging Applications
Market Estimates & Forecast, by Region, 2018-2023
Market Estimates & Forecast, by Country, 2018-2023
6.2.2 Orthopedic Applications
Market Estimates & Forecast, by Region, 2018-2023
Market Estimates & Forecast, by Country, 2018-2023
6.2.3 Cardiovascular Imaging Applications
Market Estimates & Forecast, by Region, 2018-2023
Market Estimates & Forecast, by Country, 2018-2023
6.2.4 Others
Market Estimates & Forecast, by Region, 2018-2023
Market Estimates & Forecast, by Country, 2018-2023
6.3 Dental Applications
Market Estimates & Forecast, by Region, 2018-2023
Market Estimates & Forecast, by Country, 2018-2023
6.4 Mammography
Market Estimates & Forecast, by Region, 2018-2023
Market Estimates & Forecast, by Country, 2018-2023
6.5 Fluoroscopy
Market Estimates & Forecast, by Region, 2018-2023
Market Estimates & Forecast, by Country, 2018-2023
Chapter 7. Global Digital X-rays Market, by Technology
7.1 Introduction
7.2 Computed Radiography
Market Estimates & Forecast, by Region, 2018-2023
Market Estimates & Forecast, by Country, 2018-2023
7.3 Direct Radiography
Market Estimates & Forecast, by Region, 2018-2023
Market Estimates & Forecast, by Country, 2018-2023
Chapter 8. Global Digital X-rays Market, by Portability
8.1 Introduction
8.2 Fixed Digital X-Ray Systems
Market Estimates & Forecast, by Region, 2018-2023
Market Estimates & Forecast, by Country, 2018-2023
8.2.1 Floor-To-Ceiling Mounted Systems
Market Estimates & Forecast, by Region, 2018-2023
Market Estimates & Forecast, by Country, 2018-2023
8.2.2 Ceiling-Mounted Systems
Market Estimates & Forecast, by Region, 2018-2023
Market Estimates & Forecast, by Country, 2018-2023
8.3 Portable Digital X-Ray Systems
Market Estimates & Forecast, by Region, 2018-2023
Market Estimates & Forecast, by Country, 2018-2023
8.3.1 Mobile X-Ray Systems
Market Estimates & Forecast, by Region, 2018-2023
Market Estimates & Forecast, by Country, 2018-2023
8.3.2 Handheld X-Ray Systems
Market Estimates & Forecast, by Region, 2018-2023
Market Estimates & Forecast, by Country, 2018-2023
Chapter 9. Global Digital X-rays Market, by End user
9.1 Introduction
9.2 Diagnostic Centers
Market Estimates & Forecast, by Region, 2018-2023
Market Estimates & Forecast, by Country, 2018-2023
9.3 Hospitals & Clinics
Market Estimates & Forecast, by Region, 2018-2023
Market Estimates & Forecast, by Country, 2018-2023
9.4 Others
Market Estimates & Forecast, by Region, 2018-2023
Market Estimates & Forecast, by Country, 2018-2023
Chapter 10. Global Digital X-rays Market, by Region
10.1 Introduction
10.2 Americas
10.2.1 North America
10.2.1.1 US
10.2.1.2 Canada
10.2.2 South America
10.3 Europe
10.3.1 Western Europe
10.3.1.1 Germany
10.3.1.2 France
10.3.1.3 Italy
10.3.1.4 Spain
10.3.1.5 UK
10.3.1.6 Rest of Western Europe
10.3.2 Eastern Europe
10.4 Asia-Pacific
10.4.1 Japan
10.4.2 China
10.4.3 India
10.4.4 Australia
10.4.5 South Korea
10.4.6 Rest of Asia-Pacific
10.5 Middle East & Africa
10.5.1 Middle East
10.5.2 Africa
Chapter 11. Company Landscape
11.1 Introduction
11.2 Market Share Analysis
11.3 Key Development & Strategies
Chapter 12. Company Profiles
12.1 GE Healthcare
12.1.1 Company Overview
12.1.2 Product Overview
12.1.3 Financials Overview
12.1.4 Key Developments
12.1.5 SWOT Analysis
12.2 Koninklijke Philips N.V.
12.2.1 Company Overview
12.2.2 Product Overview
12.2.3 Financial Overview
12.2.4 Key Developments
12.2.5 SWOT Analysis
12.3 Canon Inc
12.3.1 Company Overview
12.3.2 Product Overview
12.3.3 Financial Overview
12.3.4 Key Development
12.3.5 SWOT Analysis
12.4 Carestream Health
12.4.1 Company Overview
12.4.2 Technology/Business Segment Overview
12.4.3 Financial Overview
12.4.4 Key Development
12.4.5 SWOT Analysis
12.5 Philips Healthcare
12.5.1 Company Overview
12.5.2 Product Overview
12.5.3 Financial overview
12.5.4 Key Developments
12.5.5 SWOT Analysis
12.6 SEIMENS AG
12.6.1 Company Overview
12.6.2 Product Overview
12.6.3 Financial Overview
12.6.4 Key Developments
12.6.5 SWOT Analysis
12.7 Konica Minolta Inc
12.7.1 Overview
12.7.2 Product Overview
12.7.3 Financial Overview
12.7.4 Key Developments
12.7.5 SWOT Analysis
12.8 Hitachi Medical Corporation
12.8.1 Overview
12.8.2 Product/ Technology Overview
12.8.3 Financials
12.8.4 Key Developments
12.8.5 SWOT Analysis
12.9 Shimadzu Corporation
12.9.1 Overview
12.9.2 Product Overview
12.9.3 Financials
12.9.4 Key Developments
12.9.5 SWOT Analysis
12.10 Fujifilm Corporation
12.10.1 Overview
12.10.2 Product Overview
12.10.3 Financials
12.10.4 Key Developments
12.10.5 SWOT Analysis
12. 11 Toshiba Medical Systems Corporation
12. 11.1 Overview
12. 11.2 Product Overview
12. 11.3 Financials
12. 11.4 Key Developments
12. 11.5 SWOT Analysis
12.12 Samsung Medison Co. Ltd
12.12.1 Overview
12.12.2 Product Overview
12.12.3 Financials
12.12.4 Key Developments
12.12.5 SWOT Analysis
12.13 Siemens Healthineers
13.13.1 Overview
13.13.2 Product Overview
13.13.3 Financials
13.13.4 Key Developments
13.13.5 SWOT Analysis
12.14 Hologic
12.14.1 Overview
12.14.2 Product Overview
12.14.3 Financials
12.14.4 Key Developments
12.14.5 SWOT Analysis
12.15 Agfa-Gevaert
12.15.1 Overview
12.15.2 Product Overview
12.15.3 Financials
12.15.4 Key Developments
12.15.5 SWOT Analysis
Chapter 13 MRFR Conclusion
13.1 Key Findings
13.1.1 From CEO’s Viewpoint
13.1.2 Unmet Needs of the Market
13.2 Key Companies to Watch
13.3 Predictions for the Multiplex Assay Industry
Chapter 14. Appendix
LIST OF TABLES
Table 1 Global Digital X-rays Market Synopsis, 2018-2023
Table 2 Global Digital X-rays Market Estimates and Forecast, 2018-2023(USD Million)
Table 3 Global Digital X-rays Market, by Region, 2018-2023(USD Million)
Table 4 Global Digital X-rays Market, by Application, 2018-2023(USD Million)
Table 5 Global Digital X-rays Market, by Technology, 2018-2023(USD Million
Table 6 Global Digital X-rays Market, by Portability, 2018-2023(USD Million)
Table 7 Global Digital X-rays Market, by System, 2018-2023(USD Million)
Table 8 Global Digital X-rays Market, by End-User, 2018-2023(USD Million)
Table 9 North America: Multiplex Assay Market, by Application, 2018-2023(USD
Million)
Table 10 North America: Multiplex Assay Market, by Technology, 2018-2023(USD
Million)
Table 11 North America: Multiplex Assay Market, by Portability, 2018-2023(USD
Million)
Table 12 North America: Multiplex Assay Market, by System, 2018-2023(USD
Million)
Table 13 North America: Multiplex Assay Market, by End-User, 2018-2023(USD
Million)
Table 14 US: Multiplex Assay Market, by Application, 2018-2023(USD Million)
Table 15 US: Multiplex Assay Market, by Technology, 2018-2023(USD Million)
Table 16 US: Multiplex Assay Market, by Portability, 2018-2023(USD Million)
Table 17 US: Multiplex Assay Market, by System, 2018-2023(USD Million)
Table 18 US: Multiplex Assay Market, by End-User, 2018-2023(USD Million)
Table 19 Canada: Multiplex Assay Market, by Application, 2018-2023(USD Million)
Table 20 Canada: Multiplex Assay Market, by Technology, 2018-2023(USD Million)
Table 21 Canada: Multiplex Assay Market, by Portability, 2018-2023(USD Million)
Table 22 Canada: Multiplex Assay Market, by System, 2018-2023(USD
Million)
Table 23 Canada: Multiplex Assay Market, by End-User, 2018-2023(USD
Million)
Table 24 South America: Multiplex Assay Market, by Application, 2018-2023(USD
Million)
Table 25 South America: Multiplex Assay Market, by Technology, 2018-2023(USD
Million)
Table 26 South America: Multiplex Assay Market, by Portability, 2018-2023(USD
Million)
Table 27 South America: Multiplex Assay Market, by System, 2018-2023(USD
Million)
Table 28 South America: Multiplex Assay Market, by End-User, 2018-2023(USD
Million)
Table 29 Europe: Multiplex Assay Market, by Application, 2018-2023(USD Million)
Table 30 Europe: Multiplex Assay Market, by Technology, 2018-2023(USD Million)
Table 31 Europe: Multiplex Assay Market, by Portability, 2018-2023(USD Million)
Table 32 Europe: Multiplex Assay Market, by System, 2018-2023(USD Million)
Table 33 Europe: Multiplex Assay Market, by End-User, 2018-2023(USD Million)
Table 34 Western Europe: Multiplex Assay Market, by Application, 2018-2023(USD
Million)
Table 35 Western Europe: Multiplex Assay Market, by Technology, 2018-2023(USD
Million)
Table 36 Western Europe: Multiplex Assay Market, by Portability, 2018-2023(USD
Million)
Table 37 Western Europe: Multiplex Assay Market, by System, 2018-2023
(USD Million)
Table 38 Western Europe: Multiplex Assay Market, by End-Users, 2018-2023
(USD Million)
Table 39 Eastern Europe: Multiplex Assay Market, by Application, 2018-2023(USD
Million)
Table 40 Eastern Europe: Multiplex Assay Market, by Technology, 2018-2023(USD
Million)
Table 41 Eastern Europe: Multiplex Assay Market, by Portability, 2018-2023(USD
Million)
Table 42 Eastern Europe: Multiplex Assay Market, by System, 2018-2023
(USD Million)
Table 43 Eastern Europe: Multiplex Assay Market, by End-Users, 2018-2023
(USD Million)
Table 44 Asia-Pacific: Multiplex Assay Market, by Application, 2018-2023(USD
Million)
Table 45 Asia-Pacific: Multiplex Assay Market, by Technology, 2018-2023(USD
Million)
Table 46 Asia-Pacific: Multiplex Assay Market, by Portability, 2018-2023(USD
Million)
Table 47 Asia-Pacific: Multiplex Assay Market, by System, 2018-2023(USD
Million)
Table 48 Asia-Pacific: Multiplex Assay Market, by End-Users, 2018-2023(USD
Million)
Table 49 Middle East & Africa: Multiplex Assay Market, by Application, 2018-2023
(USD Million)
Table 51 Middle East & Africa: Multiplex Assay Market, by Technology, 2018-2023
(USD Million)
Table 52 Middle East & Africa: Multiplex Assay Market, by Portability, 2018-2023
(USD Million)
Table 53 Middle East & Africa: Multiplex Assay Market, by System, 2018-2023
(USD Million)
Table 54 Middle East & Africa: Multiplex Assay Market, by End-Users, 2018-2023
(USD Million)
LIST OF FIGURES
Figure 1 Research Process
Figure 2 Segmentation for Global Digital X-rays Market
Figure 3 Segmentation Market Dynamics for Global Digital X-rays Market
Figure 4 Global Digital X-rays Market Share, by Application, 2017
Figure 4 Global Digital X-rays Market Share, by Technology, 2017
Figure 5 Global Digital X-rays Market Share, by Portability, 2017
Figure 6 Global Digital X-rays Market Share, by System, 2017
Figure 7 Global Digital X-rays Market Share, by End-User, 2017
Figure 8 Global Digital X-rays Market Share, by Region, 2017
Figure 9 North America: Multiplex Assay Market Share, by Country, 2017
Figure 10 Europe: Multiplex Assay Market Share, by Country, 2017
Figure 11 Asia-Pacific: Multiplex Assay Market Share, by Country, 2017
Figure 12 Middle East & Africa: Multiplex Assay Market Share, by Country, 2017
Figure 13 Global Digital X-rays Market: Company Share Analysis, 2017 (%)
Figure 14 GE Healthcare.: Key Financials
Figure 15 GE Healthcare.: Segmental Revenue
Figure 16 GE Healthcare.: Geographical Revenue
Figure 17 Koninklijke Philips N.V..: Key Financials
Figure 18 Koninklijke Philips N.V..: Segmental Revenue
Figure 19 Koninklijke Philips N.V..: Geographical Revenue
Figure 20 Canon Inc: Key Financials
Figure 21 Canon Inc.: Segmental Revenue
Figure 22 Canon Inc.: Geographical Revenue
Figure 23 Carestream Health: Key Financials
Figure 24 Carestream Health: Segmental Revenue
Figure 25 Carestream Health: Geographical Revenue
Figure 26 Philips Healthcare: Key Financials
Figure 27 Philips Healthcare: Segmental Revenue
Figure 28 Philips Healthcare: Geographical Revenue
Figure 29 SEIMENS AG: Key Financials
Figure 30 SEIMENS AG: Segmental Revenue
Figure 31 SEIMENS AG: Geographical Revenue
Figure 32 Konica Minolta Inc: Key Financials
Figure 33 Konica Minolta Inc: Segmental Revenue
Figure 34 Konica Minolta Inc: Geographical Revenue
Figure 35 Hitachi Medical Corporation: Key Financials
Figure 36 Hitachi Medical Corporation: Segmental Revenue
Figure 37 Hitachi Medical Corporation: Geographical Revenue
Figure 38 Shimadzu Corporation: Key Financials
Figure 39 Shimadzu Corporation: Segmental Revenue
Figure 40 Shimadzu Corporation: Geographical Revenue
Figure 41 Fujifilm Corporation: Key Financials
Figure 42 Fujifilm Corporation: Segmental Revenue
Figure 43 Fujifilm Corporation: Geographical Revenue
Figure 44 Toshiba Medical Systems Corporation: Key Financials
Figure 45 Toshiba Medical Systems Corporation: Segmental Revenue
Figure 46 Toshiba Medical Systems Corporation: Geographical Revenue
Figure 47 Samsung Medison Co. Ltd: Key Financials
Figure 48 Samsung Medison Co. Ltd: Segmental Revenue
Figure 49 Samsung Medison Co. Ltd: Geographical Revenue
Figure 50 Siemens Healthineers: Key Financials
Figure 51 Siemens Healthineers: Segmental Revenue
Figure 52 Siemens Healthineers: Geographical Revenue
Figure 53 Hologic: Key Financials
Figure 54 Hologic: Segmental Revenue
Figure 55 Hologic: Geographical Revenue
Figure 56 Agfa-Gevaert: Key Financials
Figure 57 Agfa-Gevaert: Segmental Revenue
Figure 58 Agfa-Gevaert: Geographical Revenue