Digital Signage Market Summary
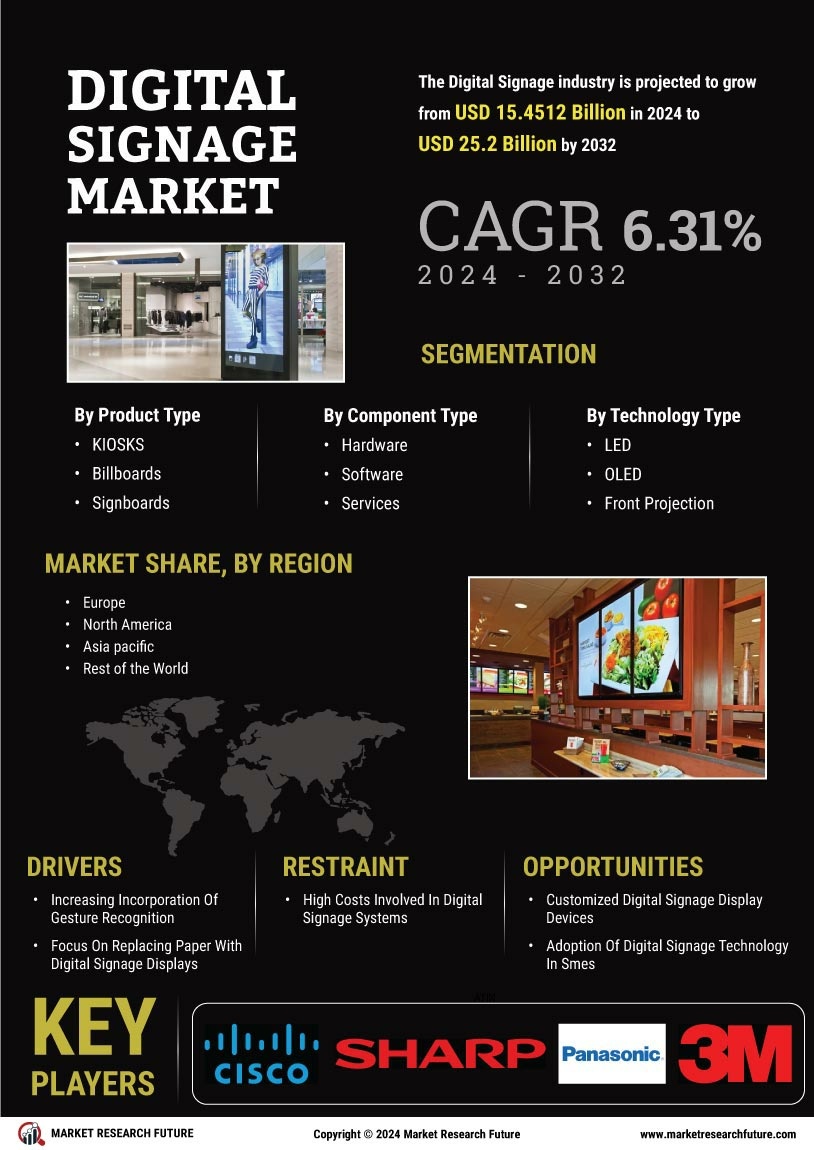
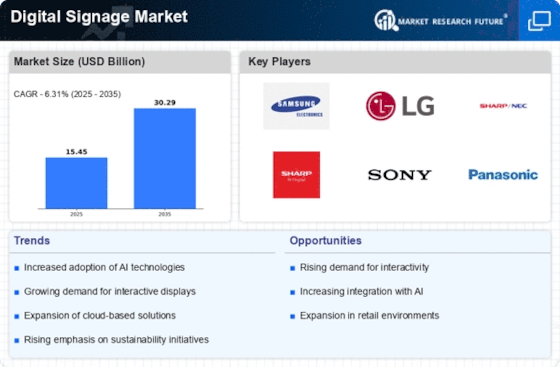
As per Market Research Future Analysis, the Global Digital Signage Market was valued at USD 14.4 Billion in 2023 and is projected to reach USD 25.2 Billion by 2032, growing at a CAGR of 6.31% from 2024 to 2032. Key drivers include advancements in gesture recognition technology and increased demand for digitized promotions. The market is segmented by component type into Hardware, Software, and Service, with Hardware expected to dominate. The Commercial vertical is anticipated to lead market influence, while North America holds the largest market share due to high demand in the retail sector. However, challenges such as high initial costs and lack of standardization may hinder growth.
Key Market Trends & Highlights
The Digital Signage Market is experiencing significant growth driven by technological advancements and increasing demand across various sectors.
- Market Size in 2023: USD 14.4 Billion
- Projected Market Size by 2032: USD 25.2 Billion
- CAGR from 2024 to 2032: 6.31%
- North America holds the largest market share due to retail sector demand.
Market Size & Forecast
2023 Market Size: USD 14.4 Billion
2024 Market Size: USD 15.4512 Billion
2032 Market Size: USD 25.2 Billion
CAGR (2024-2032): 6.31%
Largest Regional Market Share in 2024: North America
Major Players
Key players include Redbox Automated Retail LLC, LG Electronics, Daktronics, Samsung Electronics Co. Ltd, Barco, Panasonic Corporation, Sony Corporation, NEC Corporation, Goodview Company, Leyard, AUO Corporation, Exceptional 3D, Scala, and Deepsky Corporation Ltd.

Source: Secondary Research, Primary Research, MRFR Database and Analyst Review
Digital Signage Market Trends
The growing incorporation of gesture recognition is driving market growth.
Market CAGR for digital signage is being driven by the rising incorporation of gesture recognition. Digital signage provides a new way for consumers to interact with the information given by advertisements and entertainment companies. Several manufacturers are involved in R&D to innovate and develop display processors inclusive of gesture recognition technology. There is an increased demand for the digitized promotion of products and services to get the attention of the target audience effectively.
The gesture recognition technology is anticipated to be the most largely utilized technology in digital signage systems. The main adopter of this technology is the automotive and transportation sectors. Without touching the screen, this technology can be utilized by performing recognizable hand and finger gestures in the allotted space. The 3D designs can be recognized by gesture recognition and can interact with the system via hand movement. An invisible user interface and gesture technology with digital signage can help change the way customers interact with technology, as they limit the superiority of screens in front of the face of user.
In the education system, for learning more interactive and interesting gesture-enabled digital signage is used.
No paper waste, audience engagement, overcoming spatial limitations, dynamic content control and cost-effectiveness, targeted content, and interactive digital signage are some of the benefits given by digital signage. There is an increasing demand in public and commercial sectors for digital signage because of its cost-effectiveness and assured return upon investing is increasing the demand for digital signage in the market. In order to make the brand value, there is an increase in the demandreigital signage in the infrastructure industry and rising digital technology.
However, the major factors hindering the growth of the digital signage market are a lack of technical expertise and large initial cost and lack of standardization. The research and development of display designers and advertisement companies are investing largely to enhance the display technology of products. The evolution of LED, LCD, UHD, OLED, and super AMOLED with the development in display technology is strengthening the industry growth; these help in improving the quality of the advertisement content, attracting customers. Thus, driving the Digital Signage market revenue.
Digital Signage Market Segment Insights:
Digital Signage Component Type Insights
The Digital Signage Market segmentation, based on component type, includes Hardware, Software, and Service. The hardware category is expected to dominate the market due to technological advancement during the forecast period. The hardware component includes banners, LED, display panels, LCD screens, and others. The software segment is foreseen to experience steady growth throughout the forecast years because of its increasing requirement. The recent development of cloud-based digital signage software is anticipated to fuel the growth of market revenue.
Figure 1: Digital Signage Market by Component Type, 2022 & 2032 (USD Billion)

Source: Secondary Research, Primary Research, MRFR Database, and Analyst Review
Digital Signage Vertical Insights
The Digital Signage Market segmentation, based on vertical, includes Commercial, Institutional, Infrastructure, and Institutional. The commercial segment is anticipated to influence the market throughout the forecast period. Businesses utilize commercial digital signage to display a large range of content forms, like videos, text, photos, animations, social media, live news, emergency alerts, event listings, and more.
Digital Signage Regional Insights
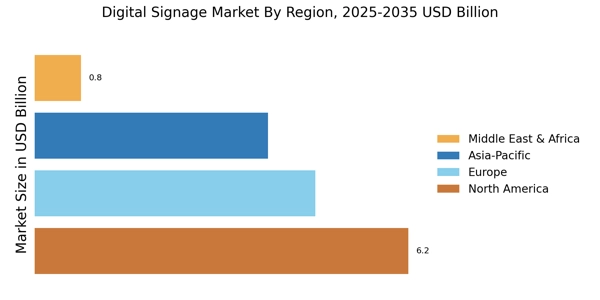
By region, the study provides market insights into North America, Europe, Asia-Pacific, and the Rest of the World. The North American Digital Signage market dominates the market due to the increasing presence of dedicated product suppliers with the rising requirements for signage in the retail industry. There is the growth of research and development by the key market participants to enhance the quality of products. The government is taking initiatives to install digital signage at various offices to maintain a continuous flow system of information.
Further, the major countries studied in the market report are The US, Canada, German, France, the UK, Italy, Spain, China, Japan, India, Australia, South Korea, and Brazil.
Figure 2: Digital Signage Market SHARE BY REGION 2022 (USD Billion)

Source: Secondary Research, Primary Research, MRFR Database, and Analyst Review
Europe's Digital Signage market accounts for the second-largest market share due to the constant manufacturing industry development and high investments in digitization by market players. Further, the German Digital Signage market held the largest market share, and the UK Digital Signage market was the rapid-growing market in the European region.
The Asia-Pacific Digital Signage Market is anticipated to grow at the fastest CAGR from 2024 to 2032. This is due to the growing adoption of digital signage solutions in developing countries and rising housing, commercial and corporate trends. Moreover, China’s Digital Signage market held the largest market share, and the Indian Digital Signage market was the rapid-growing market in the Asia-Pacific region.
Digital Signage Key Market Players & Competitive Insights
Leading market players are investing heavily in research and development in order to spread their product lines, which will help the Digital Signage market grow even more. Market participants are also undertaking a various strategic activities to expand their global footprint, with important market developments including new product launches, contractual agreements, mergers and acquisitions, higher investments, and collaboration with other organizations. To expand and survive in a more competitive and rising market climate, the Digital Signage industry must offer cost-effective items.
Manufacturing locally to minimize operational costs is one of the key business tactics used by manufacturers in the global Digital Signage industry to benefit clients and increase the market sector. In recent years, the Digital Signage industry has offered some of the most significant advantages to the advertisement industry. Major players in the Digital Signage market, including Redbox Automated Retail LLC, LG Electronics, Daktronics, Samsung Electronics Co.
Ltd, Barco, Panasonic Corporation, Sony Corporation, NEC Corporation, Goodview Company, Leyard, AUO Corporation, Exceptional 3D, Scala, Deepsky Corporation Ltd., and others, are attempting to increase market demand by investing in research and development operations.
LG, a South Korean multinational electronic company headquartered in Yeouido-dong, Seoul, which is a global leader in manufacturing consumer and commercial products ranging from TVs, home appliances, air solutions, service robots, monitors, automotive components, and it's premium LG SIGNATURE and intelligent LG ThinQ brands. In January, LG Electronics launched the LG: One Quick, which is an easy-to-use, all-in-one solution for homes and offices. In order to avail the requirements of the new ways how individual lives and work, the company developed the LG: One Quick.
It has the capability to alter and extend how individuals, co-workers, and teams communicate in the modern reality of remote working. It has three different models, including One: Quick Works (55CT5WJ), which is an advanced 55 4K Ultra High Definition all-in-one video conferencing touch display and all-round productivity tool applicable to a variety of workplace environments; one: Quick Flex (43HT3WWJ), and One: Quick Share (SC-00DA).
Redbox Automated Retail LLC is an American video-on-demand streaming and video rental company that specializes in DVD, Blu-ray, 4K UHD rentals and purchases and formerly video games through automated retail kiosks and TVOD, AVOD, and FAST services in its website, Android and iOSapps. Redbox, a leading entertainment company, stated in December 2021, announced that it had installed digital video signage on over 2,000 kiosks throughout the US, with 4000 total installations.
The partnership with a managed service company, Velocity, the new video screens provide the company with a powerful, innovative way to partner with Hollywood studios in order to promote the movies that are newly released. The rapidly rising free streaming service, as well as the advertisement opportunities for national and hyper-local media campaigns, will be seen in the traffic location by millions of people.
Key Companies in the Digital Signage market includes
Digital Signage Industry Developments
-
Q2 2024: Samsung Unveils 'The Wall for Virtual Production' at InfoComm 2024 Samsung launched a new version of its microLED display, 'The Wall for Virtual Production,' targeting film and broadcast studios, at InfoComm 2024 in Las Vegas. The product is designed to enhance digital signage applications in virtual production environments.
-
Q2 2024: LG Launches Transparent OLED Digital Signage Displays for Commercial Use LG Electronics announced the global launch of its new transparent OLED digital signage displays, aimed at retail, hospitality, and corporate environments, expanding its commercial display portfolio.
-
Q2 2024: Sony Electronics Introduces New BRAVIA Professional Displays for Digital Signage Sony Electronics launched a new line of BRAVIA professional displays designed for digital signage and corporate communication, featuring enhanced connectivity and energy efficiency.
-
Q2 2024: Panasonic Debuts New 4K Digital Signage Displays at InfoComm 2024 Panasonic introduced its latest 4K digital signage displays at InfoComm 2024, focusing on improved brightness and durability for retail and transportation sectors.
-
Q2 2024: NEC Launches New LED-FE Series for Large-Format Digital Signage NEC Display Solutions announced the release of its LED-FE Series, designed for large-format digital signage installations in airports, stadiums, and shopping malls.
-
Q3 2024: BrightSign and Bluefin Announce Strategic Partnership for Integrated Digital Signage Solutions BrightSign, a leading digital signage media player manufacturer, entered a strategic partnership with Bluefin to deliver integrated display and player solutions for retail and hospitality clients.
-
Q3 2024: Stratacache Acquires Scala China to Expand Digital Signage Presence in Asia Stratacache, a global digital signage solutions provider, acquired Scala China, strengthening its footprint in the Asian market and expanding its product offerings for local clients.
-
Q3 2024: Raydiant Raises $30M Series B to Expand Digital Signage Platform Raydiant, a digital signage and experience platform startup, secured $30 million in Series B funding to accelerate product development and expand its market reach in North America and Europe.
-
Q4 2024: Peerless-AV Opens New Manufacturing Facility for Digital Signage Solutions in Illinois Peerless-AV, a manufacturer of AV and digital signage solutions, opened a new manufacturing facility in Illinois to increase production capacity and support growing demand for digital signage products.
-
Q1 2025: Four Winds Interactive Appoints New CEO to Drive Digital Signage Innovation Four Winds Interactive, a digital signage software provider, announced the appointment of a new CEO to lead the company’s next phase of growth and product innovation.
-
Q2 2025: Samsung Signs Multi-Year Digital Signage Contract with Major U.S. Retailer Samsung secured a multi-year contract to supply digital signage displays and solutions to a major U.S. retail chain, marking a significant expansion of its commercial display business.
-
Q2 2025: LG Electronics Announces Partnership with Google for AI-Powered Digital Signage LG Electronics entered a partnership with Google to integrate AI-powered features into its digital signage displays, aiming to enhance customer engagement and analytics capabilities for enterprise clients.
Digital Signage Market Segmentation:
Digital Signage Component Type Outlook
Digital Signage Vertical Outlook
Digital Signage Regional Outlook
Attribute/Metric |
Details |
Market Size 2023 |
USD 14.4 Billion |
Market Size 2024 |
USD 15.4512 Billion |
Market Size 2032 |
USD 25.2 Billion |
Compound Annual Growth Rate (CAGR) |
6.31% (2024-2032) |
Base Year |
2023 |
Market Forecast Period |
2024-2032 |
Historical Data |
2018- 2022 |
Market Forecast Units |
Value (USD Billion) |
Report Coverage |
Revenue Forecast, Market Competitive Landscape, Growth Factors, and Trends |
Segments Covered |
Component Type, Vertical, and Region |
Geographies Covered |
North America, Europe, Asia Pacific, and the Rest of the World |
Countries Covered |
The US, Canada, German, France, UK, Italy, Spain, China, Japan, India, Australia, South Korea, and Brazil |
Key Companies Profiled |
Redbox Automated Retail LLC, LG Electronics, Daktronics, Samsung Electronics Co. Ltd, Barco, Panasonic Corporation, Sony Corporation, NEC Corporation, Goodview Company, Leyard, AUO Corporation, Exceptional 3D, Scala, Deepsky Corporation Ltd. Â |
Key Market Opportunities |
Rising adoption of digital signage technology in SMEs. |
Key Market Dynamics |
Growing incorporation of gesture recognition. |
Frequently Asked Questions (FAQ):
The Digital Signage Market size valued at USD 14.4 Billion in 2023.
The global market is foreseen to grow at a CAGR of 6.31% during the forecast period, 2024-2032.
North America had largest share of the global market
The key players in the market are Redbox Automated Retail LLC, LG Electronics, Daktronics, Samsung Electronics Co. Ltd, Barco, Panasonic Corporation, Sony Corporation, NEC Corporation, Goodview Company, Leyard, AUO Corporation, Exceptional 3D, Scala, Deepsky Corporation Ltd.
The hardware category dominated the market in 2023.
The commercial had the largest share of the global market.
TABLE OF CONTENTS
1 EXECUTIVE SUMMARY 17
1.1 MARKET ATTRACTIVENESS ANALYSIS 18
2 MARKET INTRODUCTION 19
2.1 DEFINITION 19
2.2 SCOPE OF THE STUDY 19
2.3 RESEARCH OBJECTIVE 19
2.4 MARKET STRUCTURE 20
3 RESEARCH METHODOLOGY 21
3.1 RESEARCH PROCESS 21
3.2 PRIMARY RESEARCH 22
3.3 SECONDARY RESEARCH 23
3.4 MARKET SIZE ESTIMATION 23
3.5 TOP-DOWN AND BOTTOM-UP APPROACH 24
3.6 FORECASTING TECHNIQUES 26
3.7 LIST OF ASSUMPTIONS 27
4 MARKET DYNAMICS 28
4.1 OVERVIEW 28
4.2 DRIVERS 29
4.2.1 INCREASING INCORPORATION OF GESTURE RECOGNITION 29
4.2.2 FOCUS ON REPLACING PAPER WITH DIGITAL SIGNAGE DISPLAYS 29
4.3 RESTRAINT 30
4.3.1 HIGH COSTS INVOLVED IN DIGITAL SIGNAGE SYSTEMS 30
4.4 OPPORTUNITY 31
4.4.1 CUSTOMIZED DIGITAL SIGNAGE DISPLAY DEVICES 31
4.4.2 ADOPTION OF DIGITAL SIGNAGE TECHNOLOGY IN SMES 31
4.5 IMPACT OF COVID-19 32
4.5.1 IMPACT ON DISPLAY SUPPLY 32
4.5.2 USE OF DIGITAL SIGNAGE AS REAL-TIME CUSTOMER SERVICE AMIDST THE PANDEMIC 32
4.5.3 DIGITAL SIGNAGE IN THE RETAIL INDUSTRY POST-COVID 33
4.5.4 IMPACT ON THE OVERALL DIGITAL SIGNAGE TECHNOLOGY 33
5 MARKET FACTOR ANALYSIS 35
5.1 VALUE CHAIN ANALYSIS 35
5.1.1 COMPONENT MANUFACTURERS 35
5.1.2 ASSEMBLERS/INTEGRATORS 36
5.1.3 SALES & DISTRIBUTION 36
5.1.4 END USER 36
5.2 PORTERS FIVE FORCES 37
5.2.1 THREAT OF NEW ENTRANTS 37
5.2.2 BARGAINING POWER OF SUPPLIERS 37
5.2.3 THREAT OF SUBSTITUTES 38
5.2.4 BARGAINING POWER OF BUYERS 38
5.2.5 INTENSITY OF RIVALRY 38
6 GLOBAL DIGITAL SIGNAGE MARKET, BY PRODUCT TYPE 39
6.1 OVERVIEW 39
6.2 MARKET ESTIMATES AND FORECAST, BY PRODUCT TYPE, 2024–2032 39
6.3 KIOSKS 40
6.4 BILLBOARDS 40
6.5 SIGNBOARDS 40
6.6 MENU BOARDS 40
7 GLOBAL DIGITAL SIGNAGE MARKET, BY COMPONENT TYPE 41
7.1 OVERVIEW 41
7.2 MARKET ESTIMATES AND FORECAST, BY COMPONENT TYPE, 2024–2032 41
7.3 HARDWARE 42
7.4 SOFTWARE 42
7.5 SERVICES 42
8 GLOBAL DIGITAL SIGNAGE MARKET, BY TECHNOLOGY 43
8.1 OVERVIEW 43
8.2 MARKET ESTIMATES AND FORECAST, BY TECHNOLOGY, 2024–2032 43
8.3 LCD 44
8.4 LED 44
8.5 OLED 44
8.6 FRONT PROJECTION 44
9 GLOBAL DIGITAL SIGNAGE MARKET, BY APPLICATION 45
9.1 OVERVIEW 45
9.2 MARKET ESTIMATES AND FORECAST, BY APPLICATION, 2024–2032 45
9.3 OUTDOOR 46
9.4 INDOOR 46
10 GLOBAL DIGITAL SIGNAGE MARKET, BY VERTICAL 47
10.1 OVERVIEW 47
10.2 MARKET ESTIMATES AND FORECAST, BY VERTICAL, 2024–2032 47
10.3 ENTERTAINMENT 48
10.4 TRANSPORTATION 48
10.5 RETAIL 48
10.6 HEALTHCARE 48
10.7 BANKING 48
10.8 EDUCATION 49
10.9 GOVERNMENT 49
11 GLOBAL DIGITAL SIGNAGE MARKET, BY REGION 50
11.1 OVERVIEW 50
11.2 MARKET ESTIMATES AND FORECAST, BY REGION, 2024–2032 50
11.3 NORTH AMERICA 52
11.3.1 MARKET ESTIMATES AND FORECAST, BY COUNTRY, 2024–2032 52
11.3.2 MARKET ESTIMATES AND FORECAST, BY PRODUCT TYPE, 2024–2032 53
11.3.3 MARKET ESTIMATES AND FORECAST, BY COMPONENT TYPE, 2024–2032 54
11.3.4 MARKET ESTIMATES AND FORECAST, BY TECHNOLOGY TYPE, 2024–2032 54
11.3.5 MARKET ESTIMATES AND FORECAST, BY APPLICATION, 2024–2032 55
11.3.6 MARKET ESTIMATES AND FORECAST, BY VERTICAL, 2024–2032 56
11.3.7 US 57
11.3.7.1 MARKET ESTIMATES AND FORECAST, BY PRODUCT TYPE, 2024–2032 57
11.3.7.2 MARKET ESTIMATES AND FORECAST, BY COMPONENT TYPE, 2024–2032 57
11.3.7.3 MARKET ESTIMATES AND FORECAST, BY TECHNOLOGY TYPE, 2024–2032 57
11.3.7.4 MARKET ESTIMATES AND FORECAST, BY APPLICATION, 2024–2032 58
11.3.7.5 MARKET ESTIMATES AND FORECAST, BY VERTICAL, 2024–2032 58
11.3.8 CANADA 59
11.3.8.1 MARKET ESTIMATES AND FORECAST, BY PRODUCT TYPE, 2024–2032 59
11.3.8.2 MARKET ESTIMATES AND FORECAST, BY COMPONENT TYPE, 2024–2032 59
11.3.8.3 MARKET ESTIMATES AND FORECAST, BY TECHNOLOGY TYPE, 2024–2032 59
11.3.8.4 MARKET ESTIMATES AND FORECAST, BY APPLICATION, 2024–2032 60
11.3.8.5 MARKET ESTIMATES AND FORECAST, BY VERTICAL, 2024–2032 60
11.3.9 MEXICO 61
11.3.9.1 MARKET ESTIMATES AND FORECAST, BY PRODUCT TYPE, 2024–2032 61
11.3.9.2 MARKET ESTIMATES AND FORECAST, BY COMPONENT TYPE, 2024–2032 61
11.3.9.3 MARKET ESTIMATES AND FORECAST, BY TECHNOLOGY TYPE, 2024–2032 61
11.3.9.4 MARKET ESTIMATES AND FORECAST, BY APPLICATION, 2024–2032 62
11.3.9.5 MARKET ESTIMATES AND FORECAST, BY VERTICAL, 2024–2032 62
11.4 EUROPE 63
11.4.1 MARKET ESTIMATES AND FORECAST, BY COUNTRY, 2024–2032 63
11.4.2 MARKET ESTIMATES AND FORECAST, BY PRODUCT TYPE, 2024–2032 64
11.4.3 MARKET ESTIMATES AND FORECAST, BY COMPONENT TYPE, 2024–2032 65
11.4.4 MARKET ESTIMATES AND FORECAST, BY TECHNOLOGY TYPE, 2024–2032 65
11.4.5 MARKET ESTIMATES AND FORECAST, BY APPLICATION, 2024–2032 66
11.4.6 MARKET ESTIMATES AND FORECAST, BY VERTICAL, 2024–2032 67
11.4.7 UK 68
11.4.7.1 MARKET ESTIMATES AND FORECAST, BY PRODUCT TYPE, 2024–2032 68
11.4.7.2 MARKET ESTIMATES AND FORECAST, BY COMPONENT TYPE, 2024–2032 68
11.4.7.3 MARKET ESTIMATES AND FORECAST, BY TECHNOLOGY TYPE, 2024–2032 68
11.4.7.4 MARKET ESTIMATES AND FORECAST, BY APPLICATION, 2024–2032 69
11.4.7.5 MARKET ESTIMATES AND FORECAST, BY VERTICAL, 2024–2032 69
11.4.8 GERMANY 70
11.4.8.1 MARKET ESTIMATES AND FORECAST, BY PRODUCT TYPE, 2024–2032 70
11.4.8.2 MARKET ESTIMATES AND FORECAST, BY COMPONENT TYPE, 2024–2032 70
11.4.8.3 MARKET ESTIMATES AND FORECAST, BY TECHNOLOGY TYPE, 2024–2032 70
11.4.8.4 MARKET ESTIMATES AND FORECAST, BY APPLICATION, 2024–2032 71
11.4.8.5 MARKET ESTIMATES AND FORECAST, BY VERTICAL, 2024–2032 71
11.4.9 FRANCE 72
11.4.9.1 MARKET ESTIMATES AND FORECAST, BY PRODUCT TYPE, 2024–2032 72
11.4.9.2 MARKET ESTIMATES AND FORECAST, BY COMPONENT TYPE, 2024–2032 72
11.4.9.3 MARKET ESTIMATES AND FORECAST, BY TECHNOLOGY TYPE, 2024–2032 72
11.4.9.4 MARKET ESTIMATES AND FORECAST, BY APPLICATION, 2024–2032 73
11.4.9.5 MARKET ESTIMATES AND FORECAST, BY VERTICAL, 2024–2032 73
11.4.10 ITALY 74
11.4.10.1 MARKET ESTIMATES AND FORECAST, BY PRODUCT TYPE, 2024–2032 74
11.4.10.2 MARKET ESTIMATES AND FORECAST, BY COMPONENT TYPE, 2024–2032 74
11.4.10.3 MARKET ESTIMATES AND FORECAST, BY TECHNOLOGY TYPE, 2024–2032 74
11.4.10.4 MARKET ESTIMATES AND FORECAST, BY APPLICATION, 2024–2032 75
11.4.10.5 MARKET ESTIMATES AND FORECAST, BY VERTICAL, 2024–2032 75
11.4.11 SPAIN 76
11.4.11.1 MARKET ESTIMATES AND FORECAST, BY PRODUCT TYPE, 2024–2032 76
11.4.11.2 MARKET ESTIMATES AND FORECAST, BY COMPONENT TYPE, 2024–2032 76
11.4.11.3 MARKET ESTIMATES AND FORECAST, BY TECHNOLOGY TYPE, 2024–2032 76
11.4.11.4 MARKET ESTIMATES AND FORECAST, BY APPLICATION, 2024–2032 77
11.4.11.5 MARKET ESTIMATES AND FORECAST, BY VERTICAL, 2024–2032 77
11.4.12 REST OF EUROPE 78
11.4.12.1 MARKET ESTIMATES AND FORECAST, BY PRODUCT TYPE, 2024–2032 78
11.4.12.2 MARKET ESTIMATES AND FORECAST, BY COMPONENT TYPE, 2024–2032 78
11.4.12.3 MARKET ESTIMATES AND FORECAST, BY TECHNOLOGY TYPE, 2024–2032 78
11.4.12.4 MARKET ESTIMATES AND FORECAST, BY APPLICATION, 2024–2032 79
11.4.12.5 MARKET ESTIMATES AND FORECAST, BY VERTICAL, 2024–2032 79
11.5 ASIA-PACIFIC 80
11.5.1 MARKET ESTIMATES AND FORECAST, BY COUNTRY, 2024–2032 80
11.5.2 MARKET ESTIMATES AND FORECAST, BY PRODUCT TYPE, 2024–2032 81
11.5.3 MARKET ESTIMATES AND FORECAST, BY COMPONENT TYPE, 2024–2032 82
11.5.4 MARKET ESTIMATES AND FORECAST, BY TECHNOLOGY TYPE, 2024–2032 82
11.5.5 MARKET ESTIMATES AND FORECAST, BY APPLICATION, 2024–2032 83
11.5.6 MARKET ESTIMATES AND FORECAST, BY VERTICAL, 2024–2032 84
11.5.7 CHINA 85
11.5.7.1 MARKET ESTIMATES AND FORECAST, BY PRODUCT TYPE, 2024–2032 85
11.5.7.2 MARKET ESTIMATES AND FORECAST, BY COMPONENT TYPE, 2024–2032 85
11.5.7.3 MARKET ESTIMATES AND FORECAST, BY TECHNOLOGY TYPE, 2024–2032 85
11.5.7.4 MARKET ESTIMATES AND FORECAST, BY APPLICATION, 2024–2032 86
11.5.7.5 MARKET ESTIMATES AND FORECAST, BY VERTICAL, 2024–2032 86
11.5.8 JAPAN 87
11.5.8.1 MARKET ESTIMATES AND FORECAST, BY PRODUCT TYPE, 2024–2032 87
11.5.8.2 MARKET ESTIMATES AND FORECAST, BY COMPONENT TYPE, 2024–2032 87
11.5.8.3 MARKET ESTIMATES AND FORECAST, BY TECHNOLOGY TYPE, 2024–2032 87
11.5.8.4 MARKET ESTIMATES AND FORECAST, BY APPLICATION, 2024–2032 88
11.5.8.5 MARKET ESTIMATES AND FORECAST, BY VERTICAL, 2024–2032 88
11.5.9 INDIA 89
11.5.9.1 MARKET ESTIMATES AND FORECAST, BY PRODUCT TYPE, 2024–2032 89
11.5.9.2 MARKET ESTIMATES AND FORECAST, BY COMPONENT TYPE, 2024–2032 89
11.5.9.3 MARKET ESTIMATES AND FORECAST, BY TECHNOLOGY TYPE, 2024–2032 89
11.5.9.4 MARKET ESTIMATES AND FORECAST, BY APPLICATION, 2024–2032 90
11.5.9.5 MARKET ESTIMATES AND FORECAST, BY VERTICAL, 2024–2032 90
11.5.10 REST OF ASIA-PACIFIC 91
11.5.10.1 MARKET ESTIMATES AND FORECAST, BY PRODUCT TYPE, 2024–2032 91
11.5.10.2 MARKET ESTIMATES AND FORECAST, BY COMPONENT TYPE, 2024–2032 91
11.5.10.3 MARKET ESTIMATES AND FORECAST, BY TECHNOLOGY TYPE, 2024–2032 91
11.5.10.4 MARKET ESTIMATES AND FORECAST, BY APPLICATION, 2024–2032 92
11.5.10.5 MARKET ESTIMATES AND FORECAST, BY VERTICAL, 2024–2032 92
11.6 REST OF THE WORLD 93
11.6.1 MARKET ESTIMATES AND FORECAST, BY REGION, 2024–2032 93
11.6.2 MARKET ESTIMATES AND FORECAST, BY PRODUCT TYPE, 2024–2032 94
11.6.3 MARKET ESTIMATES AND FORECAST, BY COMPONENT TYPE, 2024–2032 95
11.6.4 MARKET ESTIMATES AND FORECAST, BY TECHNOLOGY TYPE, 2024–2032 95
11.6.5 MARKET ESTIMATES AND FORECAST, BY APPLICATION, 2024–2032 96
11.6.6 MARKET ESTIMATES AND FORECAST, BY VERTICAL, 2024–2032 97
11.6.7 MIDDLE EAST & AFRICA 98
11.6.7.1 MARKET ESTIMATES AND FORECAST, BY PRODUCT TYPE, 2024–2032 98
11.6.7.2 MARKET ESTIMATES AND FORECAST, BY COMPONENT TYPE, 2024–2032 98
11.6.7.3 MARKET ESTIMATES AND FORECAST, BY TECHNOLOGY TYPE, 2024–2032 98
11.6.7.4 MARKET ESTIMATES AND FORECAST, BY APPLICATION, 2024–2032 99
11.6.7.5 MARKET ESTIMATES AND FORECAST, BY VERTICAL, 2024–2032 99
11.6.8 SOUTH AMERICA 100
11.6.8.1 MARKET ESTIMATES AND FORECAST, BY PRODUCT TYPE, 2024–2032 100
11.6.8.2 MARKET ESTIMATES AND FORECAST, BY COMPONENT TYPE, 2024–2032 100
11.6.8.3 MARKET ESTIMATES AND FORECAST, BY TECHNOLOGY TYPE, 2024–2032 100<