ID: MRFR/A&D/4853-HCR | February 2021 | Region: Global | 100 pages
Market Scenario
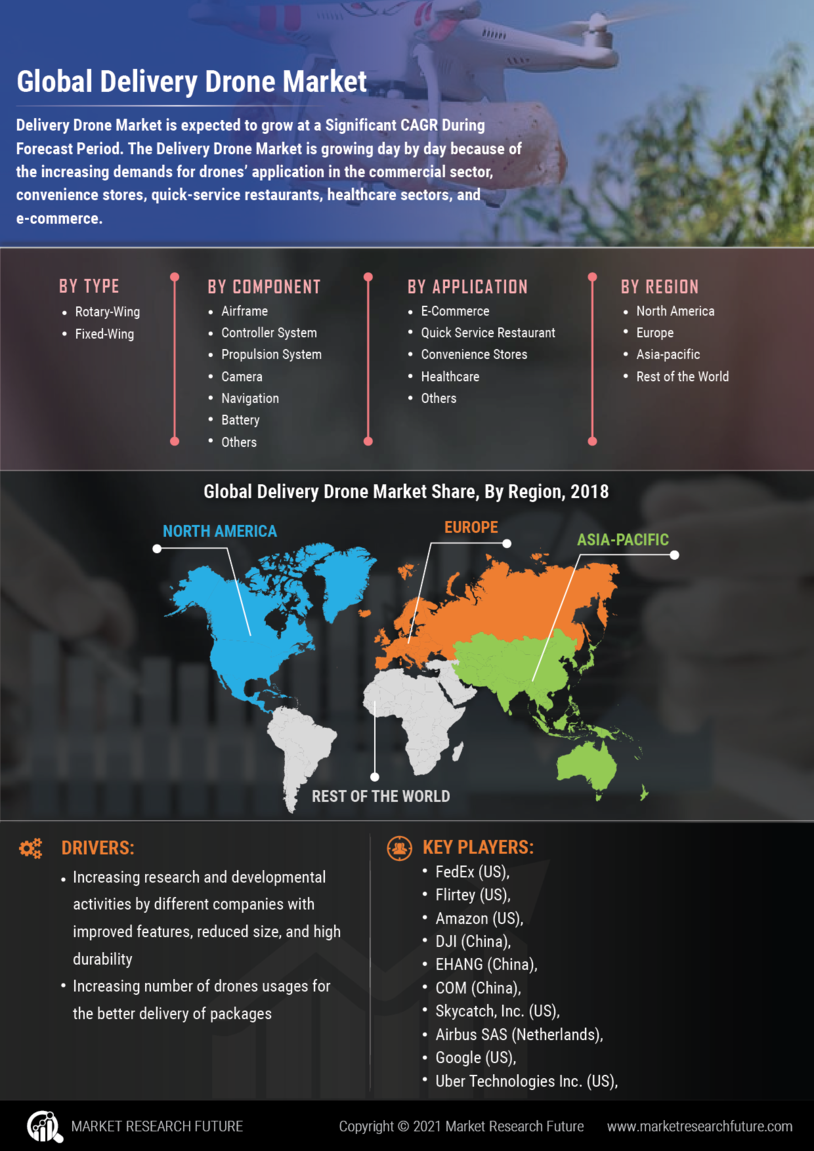
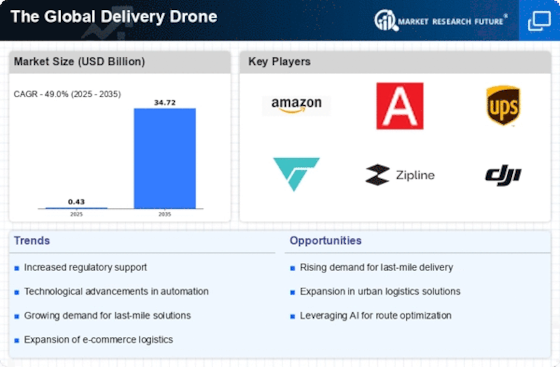
The delivery drones market is expected to grow at a significant pace during the forecast period due to the surging application of drones in the commercial sector. With innovation in cargo transportation, there has been increased usage of delivery drones in e-commerce, quick service restaurants, convenience stores, and healthcare sectors, among others. As a result, it is estimated that by the end of the forecast period, the usage of delivery drones will rise significantly.
Moreover, companies such as Amazon, UPS, Google, and other delivery service providers are experimenting with Unmanned Aerial Vehicles (UAV) for home delivery of goods. Recently, Airbus unveiled Skyways drone delivery services in Singapore, which is expected to fuel market growth.
However, stringent regulations by the Federal Aviation Administration (FAA) and logistical challenges are restricting the use of delivery drones. It is also expected that poor infrastructure and complex terrain will be one of the major logistic issues for delivery drones. Therefore, high expertise and proper knowledge are required to maneuver delivery drones. Furthermore, the limited range of delivery drones (within ten km) is a major restraint for the market growth.
Segmentation of the Global Delivery Drone Market
Based on type, the market has been segmented into fixed-wing and rotary-wing. The rotary-wing segment dominated the market in 2018 and is expected to witness a higher CAGR during the forecast period. Rotary-wing drones are much suited for commercial applications, due to their VTOL (vertical takeoff and landing) capability, ease of control and use, among others. Hence, the segment is expected to propel during the forecast period.
Based on capacity, the market has been bifurcated into <10kg and >10kg. The <10kg segment accounted for the largest market share in 2018 and is expected to grow at a higher CAGR from 2019 to 2025. Stringent regulations implemented by the Federal Aviation Administration (FAA) regarding the limitations on the weight carrying capacity of delivery drones to under 10kgs, the segment is expected to grow at a higher CAGR during the forecast period.
On the basis of application, the market has been divided into E-commerce, quick service restaurant, convenience stores, healthcare, and others. The E-commerce segment dominated the market in 2018 and is expected to grow at the highest CAGR during the forecast period. The growing adoption of drones or the delivery of products in the E-commerce industry is driving the growth of the segment. For instance, in June 2019, Amazon launched the latest version of Prime Air Delivery Drone.
Based on component, the market has been segregated into the airframe, controller system, propulsion system, camera, navigation, battery, and others. The airframe held the largest market share in 2018 and is expected to grow at the highest CAGR during the forecast period. Increased R&D activities undertaken by companies for developing drone airframe structures with reduced size, high durability, and other improved features are driving the growth of the segment.
Based on end user, the market has been classified as food & beverages, healthcare, retail & logistics, and others. The food & beverages accounted for the largest market share in 2018. However, the healthcare segment is expected to grow at the highest CAGR during the forecast period. Increasing adoption of delivery drones for delivering emergency medical services and equipment is expected to drive the growth of the segment. For example, in Mach 2019, UPS launched a new service to transport blood and other medical samples.
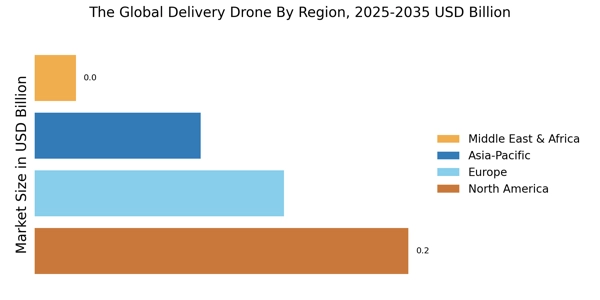
Based on the region, the market has been categorized as North America, Europe, Asia-Pacific, Middle East & Africa, and Latin America. North America is estimated to acquire the most significant market share in 2018 and is expected to grow at the highest CAGR during the forecast period from 2019 to 2028. High production and increasing applications of delivery drones in commercial sectors are driving the growth of the market in the region.
Intended Audience
Table of Contents
1. Executive Summary
1.1. Market Attractiveness Analysis
1.1.1. Global Delivery Drone Market, by Type
1.1.2. Global Delivery Drone Market, by Component
1.1.3. Global Delivery Drone Market, by Capacity
1.1.4. Global Delivery Drone Market, by End User
1.1.5. Global Delivery Drone Market, by Application
1.1.6. Global Delivery Drone Market, by Region
2. Market Introduction
2.1. Market Definition
2.2. Scope of the Study
2.3. Market Structure
2.4. Key Buying Criteria
2.5. Market Factor Indicator Analysis
3. Research Methodology
3.1. Research Process
3.2. Primary Research
3.3. Secondary Research
3.4. Market Size Estimation
3.5. Forecast Model
3.6. List of Assumptions
4. Market Insights
5. Market Dynamics
5.1. Introduction
5.2. Drivers
5.3. Restraints
5.4. Opportunities
5.5. Challenges
5.6. Market/Technological Trends
5.7. Patent Trends
5.8. Regulatory Landscape/Standards
6. Market Factor Analysis
6.1. Value Chain/Supply Chain Analysis
6.1.1. R&D
6.1.2. Manufacturing
6.1.3. Distribution & Sales
6.1.4. Post–Sales Monitoring
6.2. Porter’s Five Forces Analysis
6.2.1. Threat of New Entrants
6.2.2. Bargaining Power of Buyers
6.2.3. Threat of Substitutes
6.2.4. Rivalry
6.2.5. Bargaining Power of Supplies
7. Global Delivery Drone Market, by Type
7.1. Introduction
7.2. Fixed-Wing
7.2.1. Market Estimates & Forecast, 2019–2025
7.2.2. Market Estimates & Forecast, by Region, 2019–2025
7.3. Rotary-Wing
7.3.1. Market Estimates & Forecast, 2019–2025
7.3.2. Market Estimates & Forecast, by Region, 2019–2025
8. Global Delivery Drone Market, by Component
8.1. Introduction
8.2. Airframe
8.2.1. Market Estimates & Forecast, 2019–2025
8.2.2. Market Estimates & Forecast, by Region, 2019–2025
8.3. Controller System
8.3.1. Market Estimates & Forecast, 2019–2025
8.3.2. Market Estimates & Forecast, by Region, 2019–2025
8.4. Propulsion System
8.4.1. Market Estimates & Forecast, 2019–2025
8.4.2. Market Estimates & Forecast, by Region, 2019–2025
8.5. Navigation
8.5.1. Market Estimates & Forecast, 2019–2025
8.5.2. Market Estimates & Forecast, by Region, 2019–2025
8.6. Camera
8.6.1. Market Estimates & Forecast, 2019–2025
8.6.2. Market Estimates & Forecast, by Region, 2019–2025
8.7. Battery
8.7.1. Market Estimates & Forecast, 2019–2025
8.7.2. Market Estimates & Forecast, by Region, 2019–2025
8.8. Others
8.8.1. Market Estimates & Forecast, 2019–2025
8.8.2. Market Estimates & Forecast, by Region, 2019–2025
9. Global Delivery Drone Market, by End User
9.1. Introduction
9.2. Food & Beverages
9.2.1. Market Estimates & Forecast, 2019–2025
9.2.2. Market Estimates & Forecast, by Region, 2019–2025
9.3. Healthcare
9.3.1. Market Estimates & Forecast, 2019–2025
9.3.2. Market Estimates & Forecast, by Region, 2019–2025
9.4. Retail & Logistics
9.4.1. Market Estimates & Forecast, 2019–2025
9.4.2. Market Estimates & Forecast, by Region, 2019–2025
9.5. Others
9.5.1. Market Estimates & Forecast, 2019–2025
9.5.2. Market Estimates & Forecast, by Region, 2019–2025
10. Global Delivery Drone Market, by Application
10.1. Introduction
10.2. E-Commerce
10.2.1. Market Estimates & Forecast, 2019–2025
10.2.2. Market Estimates & Forecast, by Region, 2019–2025
10.3. Quick Service Restaurant
10.3.1. Market Estimates & Forecast, 2019–2025
10.3.2. Market Estimates & Forecast, by Region, 2019–2025
10.4. Healthcare
10.4.1. Market Estimates & Forecast, 2019–2025
10.4.2. Market Estimates & Forecast, by Region, 2019–2025
10.5. Convenience Store
10.5.1. Market Estimates & Forecast, 2019–2025
10.5.2. Market Estimates & Forecast, by Region, 2019–2025
10.6. Others
10.6.1. Market Estimates & Forecast, 2019–2025
10.6.2. Market Estimates & Forecast, by Region, 2019–2025
11. Global Delivery Drone Market, by Capacity
11.1. Introduction
11.2. <10kg
11.2.1. Market Estimates & Forecast, 2019–2025
11.2.2. Market Estimates & Forecast, by Region, 2019–2025
11.3. >10kg
11.3.1. Market Estimates & Forecast, 2019–2025
11.3.2. Market Estimates & Forecast, by Region, 2019–2025
12. Global Delivery Drone Market, by Region
12.1. Introduction
12.2. North America
12.2.1. Market Estimates & Forecast, by Country, 2019–2025
12.2.2. Market Estimates & Forecast, by Type, 2019–2025
12.2.3. Market Estimates & Forecast, by Component, 2019–2025
12.2.4. Market Estimates & Forecast, by Application, 2019–2025
12.2.5. Market Estimates & Forecast, by Capacity, 2019–2025
12.2.6. Market Estimates & Forecast, by End User, 2019–2025
12.2.7. US
12.2.7.1. Market Estimates & Forecast, by Type, 2019–2025
12.2.7.2. Market Estimates & Forecast, by Component, 2019–2025
12.2.7.3. Market Estimates & Forecast, by Application, 2019–2025
12.2.7.4. Market Estimates & Forecast, by Capacity, 2019–2025
12.2.7.5. Market Estimates & Forecast, by End User, 2019–2025
12.2.8. Canada
12.2.8.1. Market Estimates & Forecast, by Type, 2019–2025
12.2.8.2. Market Estimates & Forecast, by Component, 2019–2025
12.2.8.3. Market Estimates & Forecast, by Application, 2019–2025
12.2.8.4. Market Estimates & Forecast, by Capacity, 2019–2025
12.2.8.5. Market Estimates & Forecast, by End User, 2019–2025
12.3. Europe
12.3.1. Market Estimates & Forecast, by Country, 2019–2025
12.3.2. Market Estimates & Forecast, by Type, 2019–2025
12.3.3. Market Estimates & Forecast, by Component, 2019–2025
12.3.4. Market Estimates & Forecast, by Application, 2019–2025
12.3.5. Market Estimates & Forecast, by Capacity, 2019–2025
12.3.6. Market Estimates & Forecast, by End User, 2019–2025
12.3.7. UK
12.3.7.1. Market Estimates & Forecast, by Type, 2019–2025
12.3.7.2. Market Estimates & Forecast, by Component, 2019–2025
12.3.7.3. Market Estimates & Forecast, by Application, 2019–2025
12.3.7.4. Market Estimates & Forecast, by Capacity, 2019–2025
12.3.7.5. Market Estimates & Forecast, by End User, 2019–2025
12.3.8. Germany
12.3.8.1. Market Estimates & Forecast, by Type, 2019–2025
12.3.8.2. Market Estimates & Forecast, by Component, 2019–2025
12.3.8.3. Market Estimates & Forecast, by Application, 2019–2025
12.3.8.4. Market Estimates & Forecast, by Capacity, 2019–2025
12.3.8.5. Market Estimates & Forecast, by End User, 2019–2025
12.3.9. France
12.3.9.1. Market Estimates & Forecast, by Type, 2019–2025
12.3.9.2. Market Estimates & Forecast, by Component, 2019–2025
12.3.9.3. Market Estimates & Forecast, by Application, 2019–2025
12.3.9.4. Market Estimates & Forecast, by Capacity, 2019–2025
12.3.9.5. Market Estimates & Forecast, by End User, 2019–2025
12.3.10. Italy
12.3.10.1. Market Estimates & Forecast, by Type, 2019–2025
12.3.10.2. Market Estimates & Forecast, by Component, 2019–2025
12.3.10.3. Market Estimates & Forecast, by Application, 2019–2025
12.3.10.4. Market Estimates & Forecast, by Capacity, 2019–2025
12.3.10.5. Market Estimates & Forecast, by End User, 2019–2025
12.3.11. Rest of Europe
12.3.11.1. Market Estimates & Forecast, by Type, 2019–2025
12.3.11.2. Market Estimates & Forecast, by Component, 2019–2025
12.3.11.3. Market Estimates & Forecast, by Application, 2019–2025
12.3.11.4. Market Estimates & Forecast, by Capacity, 2019–2025
12.3.11.5. Market Estimates & Forecast, by End User, 2019–2025
12.4. Asia-Pacific
12.4.1. Market Estimates & Forecast, by Country, 2019–2025
12.4.2. Market Estimates & Forecast, by Type, 2019–2025
12.4.3. Market Estimates & Forecast, by Component, 2019–2025
12.4.4. Market Estimates & Forecast, by Application, 2019–2025
12.4.5. Market Estimates & Forecast, by Capacity, 2019–2025
12.4.6. Market Estimates & Forecast, by End User, 2019–2025
12.4.7. China
12.4.7.1. Market Estimates & Forecast, by Type, 2019–2025
12.4.7.2. Market Estimates & Forecast, by Component, 2019–2025
12.4.7.3. Market Estimates & Forecast, by Application, 2019–2025
12.4.7.4. Market Estimates & Forecast, by Capacity, 2019–2025
12.4.7.5. Market Estimates & Forecast, by End User, 2019–2025
12.4.8. Japan
12.4.8.1. Market Estimates & Forecast, by Type, 2019–2025
12.4.8.2. Market Estimates & Forecast, by Component, 2019–2025
12.4.8.3. Market Estimates & Forecast, by Application, 2019–2025
12.4.8.4. Market Estimates & Forecast, by Capacity, 2019–2025
12.4.8.5. Market Estimates & Forecast, by End User, 2019–2025
12.4.9. India
12.4.9.1. Market Estimates & Forecast, by Type, 2019–2025
12.4.9.2. Market Estimates & Forecast, by Component, 2019–2025
12.4.9.3. Market Estimates & Forecast, by Application, 2019–2025
12.4.9.4. Market Estimates & Forecast, by Capacity, 2019–2025
12.4.9.5. Market Estimates & Forecast, by End User, 2019–2025
12.4.10. Singapore
12.4.10.1. Market Estimates & Forecast, by Type, 2019–2025
12.4.10.2. Market Estimates & Forecast, by Component, 2019–2025
12.4.10.3. Market Estimates & Forecast, by Application, 2019–2025
12.4.10.4. Market Estimates & Forecast, by Capacity, 2019–2025
12.4.10.5. Market Estimates & Forecast, by End User, 2019–2025
12.4.11. Australia
12.4.11.1. Market Estimates & Forecast, by Type, 2019–2025
12.4.11.2. Market Estimates & Forecast, by Component, 2019–2025
12.4.11.3. Market Estimates & Forecast, by Application, 2019–2025
12.4.11.4. Market Estimates & Forecast, by Capacity, 2019–2025
12.4.11.5. Market Estimates & Forecast, by End User, 2019–2025
12.4.12. Rest of Asia-Pacific
12.4.12.1. Market Estimates & Forecast, by Type, 2019–2025
12.4.12.2. Market Estimates & Forecast, by Component, 2019–2025
12.4.12.3. Market Estimates & Forecast, by Application, 2019–2025
12.4.12.4. Market Estimates & Forecast, by Capacity, 2019–2025
12.4.12.5. Market Estimates & Forecast, by End User, 2019–2025
12.5. Middle East & Africa
12.5.1. Market Estimates & Forecast, by Country, 2019–2025
12.5.2. Market Estimates & Forecast, by Type, 2019–2025
12.5.3. Market Estimates & Forecast, by Component, 2019–2025
12.5.4. Market Estimates & Forecast, by Application, 2019–2025
12.5.5. Market Estimates & Forecast, by Capacity, 2019–2025
12.5.6. Market Estimates & Forecast, by End User, 2019–2025
12.5.7. UAE
12.5.7.1. Market Estimates & Forecast, by Type, 2019–2025
12.5.7.2. Market Estimates & Forecast, by Component, 2019–2025
12.5.7.3. Market Estimates & Forecast, by Application, 2019–2025
12.5.7.4. Market Estimates & Forecast, by Capacity, 2019–2025
12.5.7.5. Market Estimates & Forecast, by End User, 2019–2025
12.5.8. Saudi Arabia
12.5.8.1. Market Estimates & Forecast, by Type, 2019–2025
12.5.8.2. Market Estimates & Forecast, by Component, 2019–2025
12.5.8.3. Market Estimates & Forecast, by Application, 2019–2025
12.5.8.4. Market Estimates & Forecast, by Capacity, 2019–2025
12.5.8.5. Market Estimates & Forecast, by End User, 2019–2025
12.5.9. Israel
12.5.9.1. Market Estimates & Forecast, by Type, 2019–2025
12.5.9.2. Market Estimates & Forecast, by Component, 2019–2025
12.5.9.3. Market Estimates & Forecast, by Application, 2019–2025
12.5.9.4. Market Estimates & Forecast, by Capacity, 2019–2025
12.5.9.5. Market Estimates & Forecast, by End User, 2019–2025
12.5.10. Rest of the Middle East & Africa
12.5.10.1. Market Estimates & Forecast, by Type, 2019–2025
12.5.10.2. Market Estimates & Forecast, by Component, 2019–2025
12.5.10.3. Market Estimates & Forecast, by Application, 2019–2025
12.5.10.4. Market Estimates & Forecast, by Capacity, 2019–2025
12.5.10.5. Market Estimates & Forecast, by End User, 2019–2025
12.6. Latin America
12.6.1. Market Estimates & Forecast, by Country, 2019–2025
12.6.2. Market Estimates & Forecast, by Type, 2019–2025
12.6.3. Market Estimates & Forecast, by Component, 2019–2025
12.6.4. Market Estimates & Forecast, by Application, 2019–2025
12.6.5. Market Estimates & Forecast, by Capacity, 2019–2025
12.6.6. Market Estimates & Forecast, by End User, 2019–2025
12.6.7. Brazil
12.6.7.1. Market Estimates & Forecast, by Type, 2019–2025
12.6.7.2. Market Estimates & Forecast, by Component, 2019–2025
12.6.7.3. Market Estimates & Forecast, by Application, 2019–2025
12.6.7.4. Market Estimates & Forecast, by Capacity, 2019–2025
12.6.7.5. Market Estimates & Forecast, by End User, 2019–2025
12.6.8. Rest of Latin America
12.6.8.1. Market Estimates & Forecast, by Type, 2019–2025
12.6.8.2. Market Estimates & Forecast, by Component, 2019–2025
12.6.8.3. Market Estimates & Forecast, by Application, 2019–2025
12.6.8.4. Market Estimates & Forecast, by Capacity, 2019–2025
12.6.8.5. Market Estimates & Forecast, by End User, 2019–2025
13. Competitive Landscape
13.1. Competitive Overview
13.2. Competitor Dashboard
13.3. Major Growth Strategies in the Global Delivery Drone Market
13.4. Competitive Benchmarking
13.5. Market Share Analysis
13.6. Airbus SAS: The Leading Player in Terms of Number of Developments in the Global Delivery Drone Market
13.7. Key Developments & Growth Strategies
13.7.1. Product Launches/Service Deployments
13.7.2. Mergers & Acquisitions
13.7.3. Joint Ventures
14. Company Profiles
14.1. Airbus SAS
14.1.1. Company Overview
14.1.2. Products/Services Offered
14.1.3. Financial Overview
14.1.4. Key Developments
14.1.5. SWOT Analysis
14.1.6. Key Strategies
14.2. Alibaba
14.2.1. Company Overview
14.2.2. Products/Services Offered
14.2.3. Financial Overview
14.2.4. Key Developments
14.2.5. SWOT Analysis
14.2.6. Key Strategies
14.3. Amazon
14.3.1. Company Overview
14.3.2. Products/Services Offered
14.3.3. Financial Overview
14.3.4. Key Developments
14.3.5. SWOT Analysis
14.3.6. Key Strategies
14.4. Deutsche Post AG
14.4.1. Company Overview
14.4.2. Products/Services Offered
14.4.3. Financial Overview
14.4.4. Key Developments
14.4.5. SWOT Analysis
14.4.6. Key Strategies
14.5. DJI
14.5.1. Company Overview
14.5.2. Products/Services Offered
14.5.3. Financial Overview
14.5.4. Key Developments
14.5.5. SWOT Analysis
14.5.6. Key Strategies
14.6. EHANG
14.6.1. Company Overview
14.6.2. Products/Services Offered
14.6.3. Financial Overview
14.6.4. Key Developments
14.6.5. SWOT Analysis
14.6.6. Key Strategies
14.7. FedEx
14.7.1. Company Overview
14.7.2. Products/Services Offered
14.7.3. Financial Overview
14.7.4. Key Developments
14.7.5. SWOT Analysis
14.7.6. Key Strategies
14.8. Flirtey
14.8.1. Company Overview
14.8.2. Products/Services Offered
14.8.3. Financial Overview
14.8.4. Key Developments
14.8.5. SWOT Analysis
14.8.6. Key Strategies
14.9. Google
14.9.1. Company Overview
14.9.2. Products/Services Offered
14.9.3. Financial Overview
14.9.4. Key Developments
14.9.5. SWOT Analysis
14.9.6. Key Strategies
14.10. JD.COM
14.10.1. Company Overview
14.10.2. Products/Services Offered
14.10.3. Financial Overview
14.10.4. Key Developments
14.10.5. SWOT Analysis
14.10.6. Key Strategies
14.11. Skycatch, Inc.
14.11.1. Company Overview
14.11.2. Products/Services Offered
14.11.3. Financial Overview
14.11.4. Key Developments
14.11.5. SWOT Analysis
14.11.6. Key Strategies
14.12. Uber Technologies Inc.
14.12.1. Company Overview
14.12.2. Products/Services Offered
14.12.3. Financial Overview
14.12.4. Key Developments
14.12.5. SWOT Analysis
14.12.6. Key Strategies
14.13. United Parcel Service of America, Inc.
14.13.1. Company Overview
14.13.2. Products/Services Offered
14.13.3. Financial Overview
14.13.4. Key Developments
14.13.5. SWOT Analysis
14.13.6. Key Strategies
14.14. Zipline
14.14.1. Company Overview
14.14.2. Products/Services Offered
14.14.3. Financial Overview
14.14.4. Key Developments
14.14.5. SWOT Analysis
14.14.6. Key Strategies
14.15. Zomato
14.15.1. Company Overview
14.15.2. Products/Services Offered
14.15.3. Financial Overview
14.15.4. Key Developments
14.15.5. SWOT Analysis
14.15.6. Key Strategies
15. Appendix
15.1. References
15.2. Related Reports
15.3. List of Abbreviations
16. Industry Insights
Note: This table of contents is tentative and subject to change as the research progresses.
List of Tables
Table 1 Global Delivery Drone Market, by Region, 2019–2025
Table 2 North America: Delivery Drone Market, by Country, 2019–2025
Table 3 Europe: Delivery Drone Market, by Country, 2019–2025
Table 4 Asia-Pacific: Delivery Drone Market, by Country, 2019–2025
Table 5 Middle East & Africa: Delivery Drone Market, by Country, 2019–2025
Table 6 Latin America: Delivery Drone Market, by Country, 2019–2025
Table 7 Global Delivery Drone Market Size, by Region, 2019–2025
Table 8 North America: Delivery Drone Market Size, by Country, 2019–2025
Table 9 Europe: Delivery Drone Market Size, by Country, 2019–2025
Table 10 Asia-Pacific: Delivery Drone Market Size, by Country, 2019–2025
Table 11 Middle East & Africa: Delivery Drone Market Size, by Country, 2019–2025
Table 12 Latin America: Delivery Drone Market Size, by Country, 2019–2025
Table 13 Global Delivery Drone Type Market, by Region, 2019–2025
Table 14 North America: Delivery Drone Type Market, by Country, 2019–2025
Table 15 Europe: Delivery Drone Type Market, by Country, 2019–2025
Table 16 Asia-Pacific: Delivery Drone Type Market, by Country, 2019–2025
Table 17 Middle East & Africa: Delivery Drone Type Market, by Country, 2019–2025
Table 18 Latin America: Delivery Drone Type Market, by Country, 2019–2025
Table 19 Global Delivery Drone Component Market, by Region, 2019–2025
Table 20 North America: Delivery Drone Component Market, by Country, 2019–2025
Table 21 Europe: Delivery Drone Component Market, by Country, 2019–2025
Table 22 Asia-Pacific: Delivery Drone Component Market, by Country, 2019–2025
Table 23 Middle East & Africa: Delivery Drone Component Market, by Country, 2019–2025
Table 24 Latin America: Delivery Drone Component Market, by Country, 2019–2025
Table 25 Global Delivery Drone Application Market, by Region, 2019–2025
Table 26 North America: Delivery Drone Application Market, by Country, 2019–2025
Table 27 Europe: Delivery Drone Application Market, by Country, 2019–2025
Table 28 Asia-Pacific: Delivery Drone Application Market, by Country, 2019–2025
Table 29 Middle East & Africa: Delivery Drone Application Market, by Country, 2019–2025
Table 30 Latin America: Delivery Drone Application Market, by Country, 2019–2025
Table 31 Global Delivery Drone End User Market, by Region, 2019–2025
Table 32 North America: Delivery Drone End User Market, by Country, 2019–2025
Table 33 Europe: Delivery Drone End User Market, by Country, 2019–2025
Table 34 Asia-Pacific: Delivery Drone End User Market, by Country, 2019–2025
Table 35 Middle East & Africa: Delivery Drone End User Market, by Country, 2019–2025
Table 36 Latin America: Delivery Drone End User Market, by Country, 2019–2025
Table 37 Global Delivery Drone Capacity Market, by Region, 2019–2025
Table 38 North America: Delivery Drone Capacity Market, by Country, 2019–2025
Table 39 Europe: Delivery Drone Capacity Market, by Country, 2019–2025
Table 40 Asia-Pacific: Delivery Drone Capacity Market, by Country, 2019–2025
Table 41 Middle East & Africa: Delivery Drone Capacity Market, by Country, 2019–2025
Table 42 Latin America: Delivery Drone Capacity Market, by Country, 2019–2025
Table 43 Global Delivery Drone Market, by Region, 2019–2025
Table 44 Global Delivery Drone Market, by Type, 2019–2025
Table 45 Global Delivery Drone Market, by Component, 2019–2025
Table 46 Global Delivery Drone Market, by Application, 2019–2025
Table 47 Global Delivery Drone Market, by Capacity, 2019–2025
Table 48 Global Delivery Drone Market, by End User, 2019–2025
Table 49 North America: Delivery Drone Market, by Country, 2019–2025
Table 50 North America: Delivery Drone Market, by Type, 2019–2025
Table 51 North America: Delivery Drone Market, by Component, 2019–2025
Table 52 North America: Delivery Drone Market, by Application, 2019–2025
Table 53 North America: Delivery Drone Market, by Capacity, 2019–2025
Table 54 North America: Delivery Drone Market, by End User, 2019–2025
Table 55 Europe: Delivery Drone Market, by Country, 2019–2025
Table 56 Europe: Delivery Drone Market, by Type, 2019–2025
Table 57 Europe: Delivery Drone Market, by Component, 2019–2025
Table 58 Europe: Delivery Drone Market, by Application, 2019–2025
Table 59 Europe: Delivery Drone Market, by Capacity, 2019–2025
Table 60 Europe: Delivery Drone Market, by End User, 2019–2025
Table 61 Asia-Pacific: Delivery Drone Market, by Country, 2019–2025
Table 62 Asia-Pacific: Delivery Drone Market, by Type, 2019–2025
Table 63 Asia-Pacific: Delivery Drone Market, by Component, 2019–2025
Table 64 Asia-Pacific: Delivery Drone Market, by Application, 2019–2025
Table 65 Asia-Pacific: Delivery Drone Market, by Capacity, 2019–2025
Table 66 Asia-Pacific: Delivery Drone Market, by End User, 2019–2025
Table 67 Middle East & Africa: Delivery Drone Market, by Country, 2019–2025
Table 68 Middle East & Africa: Delivery Drone Market, by Type, 2019–2025
Table 69 Middle East & Africa: Delivery Drone Market, by Component, 2019–2025
Table 70 Middle East & Africa: Delivery Drone Market, by Application, 2019–2025
Table 71 Middle East & Africa: Delivery Drone Market, by Capacity, 2019–2025
Table 72 Middle East & Africa: Delivery Drone Market, by End User, 2019–2025
Table 73 Latin America: Delivery Drone Market, by Country, 2019–2025
Table 74 Latin America: Delivery Drone Market, by Type, 2019–2025
Table 75 Latin America: Delivery Drone Market, by Component, 2019–2025
Table 76 Latin America: Delivery Drone Market, by Application, 2019–2025
Table 77 Latin America: Delivery Drone Market, by Capacity, 2019–2025
Table 78 Latin America: Delivery Drone Market, by End User, 2019–2025
List of Figures
FIGURE 1 Research Process of MRFR
FIGURE 2 Top-Down & Bottom-Up Approaches
FIGURE 3 Market Dynamics
FIGURE 4 Impact Analysis: Market Drivers
FIGURE 5 Impact Analysis: Market Restraints
FIGURE 6 Porter's Five Forces Analysis
FIGURE 7 Value Chain Analysis
FIGURE 8 Global Delivery Drone Market Share, by Type, 2018 (%)
FIGURE 9 Global Delivery Drone Market, by Type, 2019–2025 (USD Million)
FIGURE 10 Global Delivery Drone Market Share, by Component, 2018 (%)
FIGURE 11 Global Delivery Drone Market, by Component, 2019–2025 (USD Million)
FIGURE 12 Global Delivery Drone Market Share, by Application, 2018 (%)
FIGURE 13 Global Delivery Drone Market, by Application, 2019–2025 (USD Million)
FIGURE 14 Global Delivery Drone Market Share, by Capacity, 2018 (%)
FIGURE 15 Global Delivery Drone Market, by Capacity, 2019–2025 (USD Million)
FIGURE 16 Global Delivery Drone Market Share, by End User, 2018 (%)
FIGURE 17 Global Delivery Drone Market, by End User, 2019–2025 (USD Million)
FIGURE 18 Global Delivery Drone Market Share (%), by Region, 2018
FIGURE 19 Global Delivery Drone Market, by Region, 2019–2025 (USD Million)
FIGURE 20 North America: Delivery Drone Market Share (%), 2018
FIGURE 21 North America: Delivery Drone Market, by Country, 2019–2025 (USD Million)
FIGURE 22 Europe: Delivery Drone Market Share (%), 2018
FIGURE 23 Europe: Delivery Drone Market, by Country, 2019–2025 (USD Million)
FIGURE 24 Asia-Pacific: Delivery Drone Market Share (%), 2018
FIGURE 25 Asia-Pacific: Delivery Drone Market, by Country, 2019–2025 (USD Million)
FIGURE 26 Middle East & Africa: Delivery Drone Market Share (%), 2018
FIGURE 27 Middle East & Africa: Delivery Drone Market, by Country, 2019–2025 (USD Million)
FIGURE 28 Latin America: Delivery Drone Market Share (%), 2018
FIGURE 29 Latin America: Delivery Drone Market, by Country, 2019–2025 (USD Million)