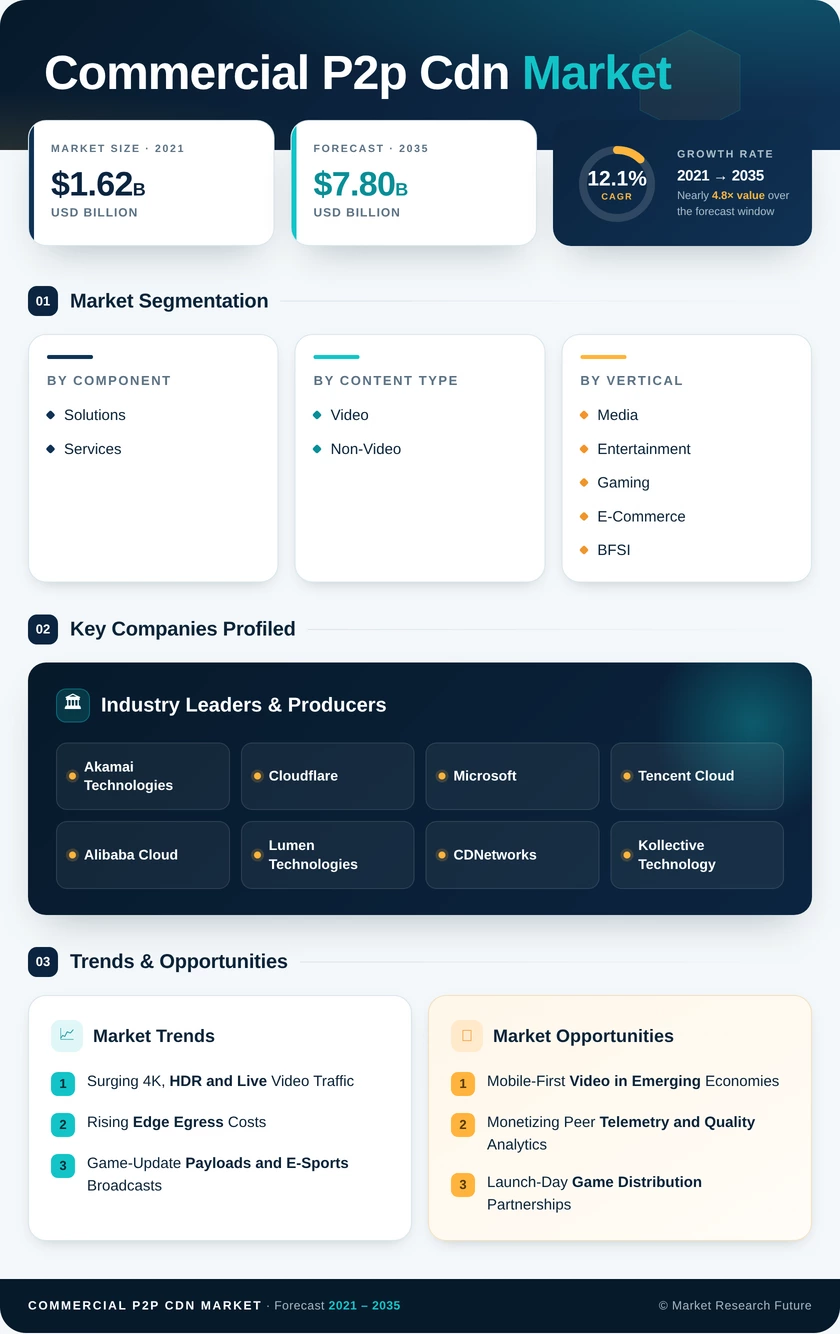
Segmentation Quick Reference
| Dimension | Sub-Segments | Dominant Segment | Fastest Growing Segment |
|---|---|---|---|
| By Component | Solutions; Services | Solutions (57.9% share) | Services (13.3% CAGR) |
| By Content Type | Video; Non-Video | Video (71.5% share) | Video (71.5% share) |
| By Vertical | Media and Entertainment; Gaming; E-Commerce; BFSI; Education; Other Verticals | Media and Entertainment (43.9% share) | Gaming (16.6% CAGR) |
| By Revenue Model | Subscription-Based; Pay-Per-Use; Ad-supported/Freemium | Subscription-Based (57.5% share) | Pay-Per-Use (14.2% CAGR) |
| By End-User | SMEs; Large Enterprises | Large Enterprises (72.4% share) | SMEs (13.7% CAGR) |
| By Region | North America; Europe; Asia-Pacific; South America; Middle East & Africa | North America (36.5% share) | Asia-Pacific (14.3% CAGR (2026–2035)) |
Market Segmentation Overview
By Component
| Sub-Segment | Key Trend |
|---|---|
| Solutions | Consolidation of peer coordination, multi-CDN failover and analytics into single consoles |
| Services | Rising demand for managed onboarding, swarm tuning and 24×7 security operations |
Solutions lead because streaming operators want peer logic managed from the same console as their existing edge capacity. Services grow fastest as buyers without in-house specialists outsource swarm tuning and security monitoring, turning software licenses into larger managed contracts.
By Content Type
| Sub-Segment | Key Trend |
|---|---|
| Video | Higher 4K and HDR bitrates multiplying cacheable segment requests |
| Non-Video | Event-driven demand from software patches and firmware rollouts |
Video both leads and grows fastest, since adaptive bitrate ladders and live concurrency create the repeated segment requests that peers cache most efficiently. Non-Video delivery follows a burstier pattern tied to operating-system releases and firmware campaigns, where checksum integrity outweighs latency.
By Vertical
| Sub-Segment | Key Trend |
|---|---|
| Media and Entertainment | Live sports and premieres driving concurrency peaks |
| Gaming | Patch sizes above 50 GB and synchronized e-sports feeds |
| E-Commerce | Product-media bursts during seasonal sales |
| BFSI | Internal research video under strict security review |
| Education | Campus-seeded lecture distribution |
| Other Verticals | Government and healthcare communications |
Media and Entertainment leads as OTT platforms manage predictable spikes around sports and premieres. Gaming grows fastest because simultaneous global releases overload single origins, while BFSI and Education adopt more slowly due to security reviews and budget cycles.
By Revenue Model
| Sub-Segment | Key Trend |
|---|---|
| Subscription-Based | Preference for predictable monthly budgeting |
| Pay-Per-Use | Spend aligned with unpredictable traffic peaks |
| Ad-supported/Freemium | Low-cost entry for margin-sensitive publishers |
Subscription-Based plans lead because finance teams value forecastable delivery costs. Pay-Per-Use grows fastest among event-driven streamers and seasonal retailers that burst without over-provisioning, while Ad-supported/Freemium tiers help smaller publishers protect thin margins.
By End-User
| Sub-Segment | Key Trend |
|---|---|
| SMEs | Self-service portals and auto-generated embed scripts |
| Large Enterprises | Peer integration into CI/CD pipelines and analytics suites |
Large Enterprises lead through multi-region OTT operators, studios and cloud-gaming hosts that embed peers into mature engineering workflows. SMEs grow fastest as simplified dashboards and automated onboarding remove the need for dedicated network specialists.


 Noah Malgeri
Co-Founder

 Peter Groot koerkamp
Account and Business Manager

 Younghwan Choi
Senior Retail Manager

 Mark Irwin
Management Consultant

 Akif Moroglu
Strategy & Business Development Director

 Guilherme Gomes Martins
Product Management Director

 Joseph Aguayo
Sales Operations & Pricing Manager

 La Terria Dodd
Program Support Specialist

 Rob Kooiker
Group Product Manager HVAC & Fire Protection GMA