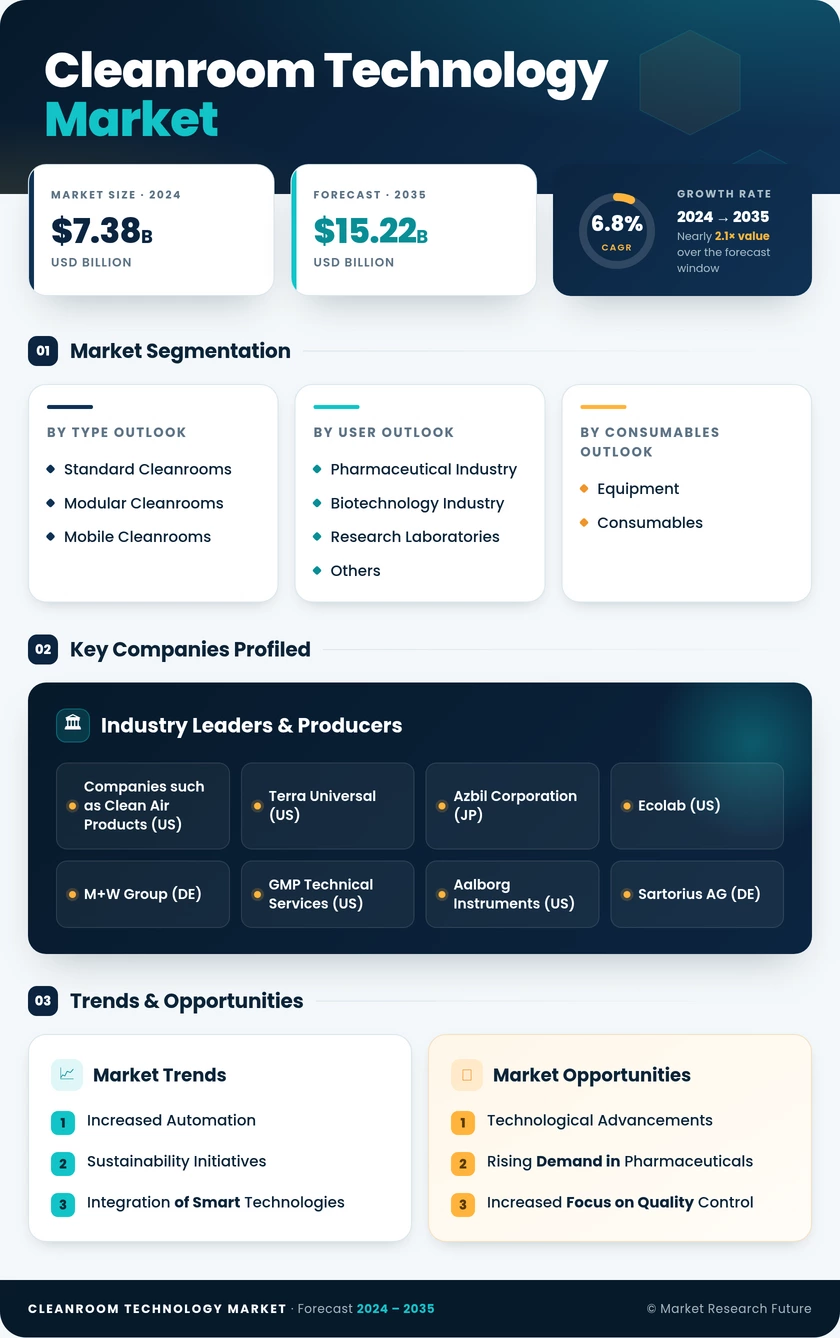
Cleanroom Technology Market (2026 - 2035)

ID: MRFR/HCIT/1615-CR 208 Pages Satyendra Maurya Last Updated: September 15, 2026
Cleanroom Technology Market Research Report Information by Equipment and Consumables (Equipment (Laminar Air Flow, HEPA Filters, Cleanroom Air Showers, Cleanroom Filters, and Others) and Consumables (Head-Caps, Gloves, Face Masks, Lab Suits, and Others), by Type (Standard Cleanrooms, Modular Cleanrooms (Hardwall Cleanrooms and Softwall Cleanrooms), and Mobile Cleanrooms), and by End User (Pharmaceutical Industry, Biotechnology Industry, Research Laboratories, and Others - Competitor Industry Analysis and Trends Forecast Till 2035
Cleanroom Technology Market
Market Size
Forecast Period2026-2035
CAGR (2026-2035)7.26%
2025 Market SizeUSD 10.74 Billion
2035 Market SizeUSD 21.55 Billion
Key Players
Exyte AG
Azbil Corporation
DuPont de Nemours
Kimberly-Clark
Taikisha Ltd.
Camfil Group
Opportunities
  • Prefabricated Delivery as a Schedule Product
  • Battery and Silicon-Carbide Dry Rooms
  • Environmental Monitoring Data Services
  1. 1 Market Overview |
    1. 1.1 Study Assumptions & Market Definition |
    2. 1.2 Scope of the Study |
    3. 1.3 Research Methodology
  2. 2 Market Summary & Key Takeaways |
    1. 2.1 By Technology |
    2. 2.2 By Sector |
    3. 2.3 By Geography
  3. 3 Market Size & Forecast (2021–2035) |
    1. 3.1 Historical Market Size (2021–2024) |
    2. 3.2 Base Year Assessment (2025) |
    3. 3.3 Forecast Market Size (2026–2035) |
    4. 3.4 Year-over-Year Growth Analysis
  4. 4 Market Drivers Analysis |
    1. 4.1 Semiconductor Fabrication Capacity Expansion |
    2. 4.2 Advanced Therapy Manufacturing |
    3. 4.3 Regulatory Tightening in Sterile Manufacturing |
    4. 4.4 Energy Cost Pressure and Efficiency Retrofits
  5. 5 Market Restraints Analysis |
    1. 5.1 Skilled Commissioning Capacity |
    2. 5.2 PFAS Regulation and Filter Media Redesign |
    3. 5.3 Capital Intensity in Emerging Economies
  6. 6 Market Opportunity Analysis |
    1. 6.1 Prefabricated Delivery as a Schedule Product |
    2. 6.2 Battery and Silicon-Carbide Dry Rooms |
    3. 6.3 Environmental Monitoring Data Services |
    4. 6.4 Emerging-Market Contract Manufacturing |
    5. 6.5 Decarbonisation-Linked Retrofit Contracts |
    6. 6.6 Industry Value Chain Analysis |
    7. 6.7 Porter's Five Forces Analysis
  7. 7 Regional Analysis |
    1. 7.1 North America | |
      1. 7.1.1 US | |
      2. 7.1.2 Canada | |
      3. 7.1.3 Mexico |
    2. 7.2 Europe | |
      1. 7.2.1 Germany | |
      2. 7.2.2 UK | |
      3. 7.2.3 France | |
      4. 7.2.4 Italy | |
      5. 7.2.5 Spain | |
      6. 7.2.6 Nordic Countries | |
      7. 7.2.7 Russia | |
      8. 7.2.8 Rest of Europe |
    3. 7.3 Asia-Pacific | |
      1. 7.3.1 China | |
      2. 7.3.2 India | |
      3. 7.3.3 Japan | |
      4. 7.3.4 South Korea | |
      5. 7.3.5 ASEAN | |
      6. 7.3.6 Rest of Asia-Pacific |
    4. 7.4 South America | |
      1. 7.4.1 Brazil | |
      2. 7.4.2 Argentina | |
      3. 7.4.3 Rest of South America |
    5. 7.5 Middle East & Africa | |
      1. 7.5.1 Saudi Arabia | |
      2. 7.5.2 UAE | |
      3. 7.5.3 South Africa | |
      4. 7.5.4 Egypt | |
      5. 7.5.5 Rest of Middle East & Africa
  8. 8 Future Outlook (2026–2035) |
    1. 8.1 Autonomous Monitoring and Predictive Control |
    2. 8.2 Platform Economics in Modular Supply |
    3. 8.3 The Electrification Supercycle |
    4. 8.4 Sustainability Disclosure and Energy Accountability
  9. 9 Segmentation Analysis |
    1. 9.1 By Component | |
      1. 9.1.1 Equipment | |
      2. 9.1.2 Consumables |
    2. 9.2 By Construction Type | |
      1. 9.2.1 Standard Stick-Built Cleanrooms | |
      2. 9.2.2 Modular Hardwall Cleanrooms | |
      3. 9.2.3 Modular Softwall Cleanrooms | |
      4. 9.2.4 Mobile/Portable Cleanrooms | |
      5. 9.2.5 Rigid-wall Cleaners |
    3. 9.3 By Cleanroom Classification (ISO 14644) | |
      1. 9.3.1 ISO Class 1–3 | |
      2. 9.3.2 ISO Class 4–5 | |
      3. 9.3.3 ISO Class 6–7 | |
      4. 9.3.4 ISO Class 8–9 |
    4. 9.4 By End-User | |
      1. 9.4.1 Pharmaceutical Manufacturing | |
      2. 9.4.2 Biotechnology R&D and Production | |
      3. 9.4.3 Semiconductor Fabrication | |
      4. 9.4.4 Medical Device Manufacturing | |
      5. 9.4.5 Hospitals & Clinical Laboratories | |
      6. 9.4.6 Food & Beverage | |
      7. 9.4.7 Aerospace & Others
  10. 10 Competitive Landscape |
    1. 10.1 Market Share Analysis (2026) |
    2. 10.2 Competitive Benchmarking Matrix |
    3. 10.3 Company Profiles | |
      1. 10.3.1 Exyte AG | |
      2. 10.3.2 Azbil Corporation | |
      3. 10.3.3 DuPont de Nemours | |
      4. 10.3.4 Kimberly-Clark | |
      5. 10.3.5 Taikisha Ltd. | |
      6. 10.3.6 Camfil Group | |
      7. 10.3.7 Illinois Tool Works (Texwipe) | |
      8. 10.3.8 Ardmac | |
      9. 10.3.9 Terra Universal | |
      10. 10.3.10 Clean Air Products | |
      11. 10.3.11 ABN Cleanroom Technology | |
      12. 10.3.12 Daldrop + Dr. Ing. Huber
  11. 11 Recent Developments & News
  12. 12 Report Scope & Methodology |
    1. 12.1 Study Period & Base Year |
    2. 12.2 Data Sources & Citations |
    3. 12.3 Abbreviations
  13. 13 Detailed Sources and Citations
  14. 14 Frequently Asked Questions
  15. 15 LIST OF TABLES |
  16. TABLE 1 Global Cleanroom Technology Market Size & Forecast, by Revenue (USD Billion), 2021–2035 |
  17. TABLE 2 Global Cleanroom Technology Market – Year-over-Year Growth Analysis, 2021–2035 |
  18. TABLE 3 Driver Impact Analysis – Contribution to Growth Rate, 2026–2035 |
  19. TABLE 4 Restraint Impact Analysis – Drag on Growth Rate, 2026–2035 |
  20. TABLE 5 Global Market Size, by Region, 2021–2035 (USD Billion) |
  21. TABLE 6 North America Market Size, by Country, 2021–2035 (USD Billion) |
  22. TABLE 7 Europe Market Size, by Country, 2021–2035 (USD Billion) |
  23. TABLE 8 Asia-Pacific Market Size, by Country, 2021–2035 (USD Billion) |
  24. TABLE 9 South America Market Size, by Country, 2021–2035 (USD Billion) |
  25. TABLE 10 Middle East & Africa Market Size, by Country, 2021–2035 (USD Billion) |
  26. TABLE 11 Global Market Size, by Component, 2021–2035 (USD Billion) |
  27. TABLE 12 Global Market Size, by Construction Type, 2021–2035 (USD Billion) |
  28. TABLE 13 Global Market Size, by Cleanroom Classification (ISO 14644), 2021–2035 (USD Billion) |
  29. TABLE 14 Global Market Size, by End-User, 2021–2035 (USD Billion) |
  30. TABLE 15 North America Market Size, by Component and End-User, 2021–2035 (USD Billion) |
  31. TABLE 16 Europe Market Size, by Component and End-User, 2021–2035 (USD Billion) |
  32. TABLE 17 Asia-Pacific Market Size, by Component and End-User, 2021–2035 (USD Billion) |
  33. TABLE 18 South America Market Size, by Component and End-User, 2021–2035 (USD Billion) |
  34. TABLE 19 Middle East & Africa Market Size, by Component and End-User, 2021–2035 (USD Billion) |
  35. TABLE 20 Competitive Benchmarking Matrix, 2026 |
  36. TABLE 21 Company Profiles – Key Players |
  37. TABLE 22 Recent Developments & Strategic Announcements, 2023–2025 |
  38. TABLE 23 Report Scope & Methodology Summary |
  39. TABLE 24 Detailed Sources and Citations Index
  40. 16 LIST OF FIGURES |
  41. FIGURE 1 Market Dynamics – Drivers, Restraints and Opportunities Overview |
  42. FIGURE 2 Industry Value Chain Analysis |
  43. FIGURE 3 Porter's Five Forces Assessment |
  44. FIGURE 4 Global Market Size Trend, 2021–2035 (USD Billion) |
  45. FIGURE 5 Year-over-Year Growth Trajectory, 2022–2035 |
  46. FIGURE 6 Segment Share by Component, 2025 vs 2035 |
  47. FIGURE 7 Segment Share by Construction Type, 2025 |
  48. FIGURE 8 Segment Share by Cleanroom Classification, 2025 |
  49. FIGURE 9 Segment Share by End-User, 2025 vs 2035 |
  50. FIGURE 10 Regional Share Distribution, 2025 |
  51. FIGURE 11 Regional Growth Rate Comparison, 2026–2035 |
  52. FIGURE 12 Country-Level Contribution Within Asia-Pacific, 2025 |
  53. FIGURE 13 Competitive Landscape – Estimated Revenue Share Bands, 2026 |
  54. FIGURE 14 Strategic Positioning Matrix – Scale versus Specialisation

Segmentation Quick Reference

DimensionSub-SegmentsDominant SegmentFastest Growing Segment
By ComponentEquipment; ConsumablesConsumablesEquipment
By Construction TypeStandard Stick-Built Cleanrooms; Modular Hardwall Cleanrooms; Softwall Cleanrooms; Mobile/Portable CleanroomsModular Hardwall CleanroomsMobile/Portable Cleanrooms
By Cleanroom Classification (ISO 14644)ISO Class 1–3; ISO Class 4–5; ISO Class 6–7; ISO Class 8–9ISO Class 6–7ISO Class 1–3
By End-UserPharmaceutical Manufacturing; Biotechnology R&D and Production; Semiconductor Fabrication; Medical Device Manufacturing; Hospitals & Clinical Laboratories; Food & Beverage; Aerospace & OthersPharmaceutical ManufacturingSemiconductor Fabrication
By GeographyNorth America; Europe; Asia-Pacific; South America; Middle East & AfricaNorth AmericaAsia-Pacific


Market Segmentation Overview

By Component

Sub-SegmentKey Trend
EquipmentMigration to electronically commutated fan-filter units and integrated monitoring hardware
ConsumablesSterile garment standardisation and single-use packaging formats gaining share


Component mix determines revenue rhythm. Consumables deliver predictable recurring volume tied to headcount and entry frequency, while equipment revenue tracks construction cycles and retrofit waves. Suppliers holding both lines smooth the cyclicality that pure-play equipment vendors absorb in full.

By Construction Type

Sub-SegmentKey Trend
Standard Stick-Built CleanroomsReserved for very large fabrication halls where module logistics become impractical
Modular Hardwall CleanroomsPrefabricated panels and interchangeable interfaces compressing site programmes
Softwall CleanroomsLow-cost containment upgrades within existing building envelopes
Mobile/Portable CleanroomsRental and clinical-stage deployments with short qualification horizons


Construction format is increasingly a schedule decision rather than a cost decision. Owners facing narrow launch windows pay a premium for factory-built certainty, and that preference has steadily shifted volume away from traditional site fabrication.

By Cleanroom Classification (ISO 14644)

Sub-SegmentKey Trend
ISO Class 1–3Advanced-node lithography driving airborne molecular contamination control
ISO Class 4–5Barrier and isolator adoption reshaping aseptic core design
ISO Class 6–7Largest installed area, expanding under broadened regulatory scope
ISO Class 8–9Gowning and staging zones upgraded alongside critical-zone projects


Classification demand follows the cascade principle: every critical zone pulls background area with it. Tightening at the top of the scale therefore lifts volume across all four bands rather than substituting between them.

By End-User

Sub-SegmentKey Trend
Pharmaceutical ManufacturingContamination control strategy documentation expanding project scope
Biotechnology R&D and ProductionMulti-suite autologous therapy layouts multiplying airlock counts
Semiconductor FabricationRecord fabrication starts driving ISO Class 1–3 construction
Medical Device ManufacturingRecertification cycles under tightened European rules
Hospitals & Clinical LaboratoriesCompounding pharmacy standards raising baseline requirements
Food & BeverageExtended shelf-life packaging adopting controlled filling zones
Aerospace & OthersOptics, satellite and precision assembly niches


End-user concentration in regulated pharmaceutical production gives the sector its defensive character, since compliance spending resists deferral. Semiconductor demand supplies the upside, though it arrives in large, uneven tranches tied to fabrication announcements rather than steady annual budgets.




Download PDF ×

We do not share your information with anyone. However, we may send you emails based on your report interest from time to time. You may contact us at any time to opt-out.