×
Request Free Sample ×

Kindly complete the form below to receive a free sample of this Report

Leading companies partner with us for data-driven Insights

clients tt-cursor
Hero Background

China Graph Analytics Market

ID: MRFR/ICT/63480-HCR
200 Pages
Aarti Dhapte
October 2025

China Graph Analytics Market Research Report By Application (Fraud Detection, Social Network Analysis, Recommendation Systems, Risk Management, Knowledge Graphs), By Deployment Mode (On-Premises, Cloud-Based, Hybrid), By End User (BFSI, Retail, Telecommunications, Healthcare, Government) and By Component (Software, Services)- Forecast to 2035

Share:
Download PDF ×

We do not share your information with anyone. However, we may send you emails based on your report interest from time to time. You may contact us at any time to opt-out.

Purchase Options

China Graph Analytics Market Summary

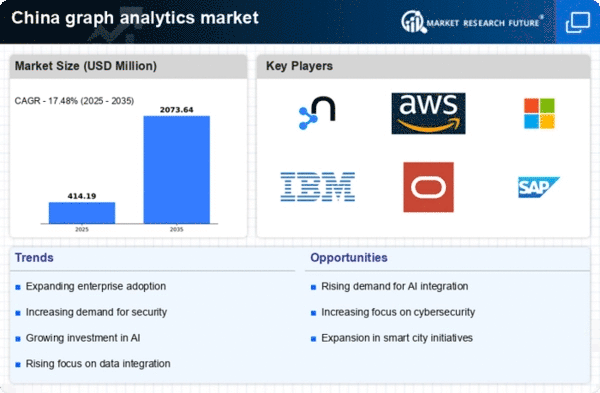
As per MRFR analysis, the graph analytics market size was estimated at 352.56 USD Million in 2024. The graph analytics market is projected to grow from 414.19 USD Million in 2025 to 2073.64 USD Million by 2035, exhibiting a compound annual growth rate (CAGR) of 17.48% during the forecast period 2025 - 2035.

Key Market Trends & Highlights

The China graph analytics market is poised for substantial growth driven by technological advancements and increasing data complexity.

  • The integration with Artificial Intelligence is transforming the capabilities of graph analytics solutions.
  • Real-time analytics is becoming a focal point, enabling businesses to make timely decisions based on dynamic data.
  • The expansion of use cases across various industries indicates the market's versatility. It also shows adaptability.
  • Rising demand for data-driven insights and government initiatives are key drivers propelling the market forward.

Market Size & Forecast

2024 Market Size 352.56 (USD Million)
2035 Market Size 2073.64 (USD Million)

Major Players

Neo4j (US), Amazon Web Services (US), Microsoft (US), IBM (US), Oracle (US), SAP (DE), TigerGraph (US), DataStax (US), ArangoDB (DE)

China Graph Analytics Market Trends

The graph analytics market is experiencing notable growth. This growth is driven by the increasing demand for data-driven decision-making across various sectors. Organizations are recognizing the value of visualizing complex data relationships, which enhances their ability to derive insights and make informed choices. This trend is particularly evident in industries such as finance, healthcare, and telecommunications, where the ability to analyze interconnected data points can lead to improved operational efficiency and strategic planning. Furthermore, advancements in technology, including artificial intelligence and machine learning, are facilitating the development of sophisticated graph analytics tools that cater to diverse business needs. In addition, The rising emphasis on big data analytics is propelling the adoption of graph analytics solutions. As companies accumulate vast amounts of data, the necessity to analyze and interpret this information effectively is crucial. As companies accumulate vast amounts of data, the necessity to analyze and interpret this information effectively is crucial. Graph analytics provides a unique approach to understanding data relationships, enabling organizations to uncover hidden patterns and trends. This capability is essential for enhancing customer experiences, optimizing supply chains, and mitigating risks. Overall, the graph analytics market is poised for continued expansion, as businesses increasingly leverage these tools to gain a competitive edge in their respective fields.

Integration with Artificial Intelligence

The integration of artificial intelligence into graph analytics tools is transforming how organizations analyze data. AI algorithms enhance the ability to identify patterns and anomalies within complex datasets. AI algorithms enhance the ability to identify patterns and anomalies within complex datasets, leading to more accurate predictions and insights. This trend is likely to drive further innovation in the graph analytics market, as companies seek to harness the power of AI to improve their analytical capabilities.

Focus on Real-Time Analytics

There is a growing emphasis on real-time analytics within the graph analytics market. Organizations are increasingly requiring immediate insights to respond to dynamic market conditions and customer behaviors. This shift towards real-time data processing allows businesses to make timely decisions, thereby enhancing their operational agility and responsiveness.

Expansion of Use Cases

The range of applications for graph analytics is expanding across various sectors. Industries such as cybersecurity, fraud detection, and social network analysis are increasingly adopting graph analytics to address specific challenges. This diversification of use cases indicates a broader recognition of the value that graph analytics can provide in solving complex problems.

China Graph Analytics Market Drivers

Growing Focus on Cybersecurity

With the rise in cyber threats, organizations in China are increasingly turning to graph analytics for enhanced cybersecurity measures. The ability to analyze relationships between various data points allows for the identification of potential vulnerabilities and threats in real-time. This focus on cybersecurity is expected to significantly impact the graph analytics market, as businesses seek to protect sensitive information and maintain customer trust. The market is projected to expand as organizations invest in graph analytics solutions that provide comprehensive security insights. This trend highlights the critical role of graph analytics in safeguarding data integrity and enhancing overall security posture.

Government Initiatives and Support

The Chinese government is actively promoting the adoption of advanced analytics technologies, including graph analytics, as part of its broader digital transformation strategy. Initiatives aimed at fostering innovation and technological advancement are likely to create a conducive environment for the growth of the graph analytics market. For instance, funding programs and incentives for research and development in data analytics are expected to encourage businesses to invest in graph analytics solutions. This governmental support is anticipated to enhance the capabilities of organizations in utilizing data effectively, thereby contributing to the expansion of the graph analytics market in China.

Emergence of Advanced Analytical Tools

The development of sophisticated analytical tools tailored for graph analytics is transforming the landscape of data analysis in China. These tools offer enhanced capabilities for visualizing and interpreting complex data relationships, making them increasingly attractive to organizations. The graph analytics market is likely to see a surge in adoption as businesses recognize the potential of these advanced tools to drive innovation and improve operational efficiency. In 2025, the market is projected to grow by approximately 30%, driven by the introduction of user-friendly interfaces and powerful algorithms that simplify the analysis process. This trend indicates a shift towards more accessible and effective graph analytics solutions.

Rising Demand for Data-Driven Insights

The increasing need for data-driven decision-making is propelling the graph analytics market in China. Organizations across various sectors are recognizing the value of leveraging complex data relationships to gain insights. In 2025, the market is projected to reach approximately $1.5 billion, reflecting a growth rate of around 25% annually. This demand is particularly evident in industries such as finance, healthcare, and telecommunications, where understanding intricate data connections can lead to improved operational efficiency and customer satisfaction. As businesses strive to enhance their competitive edge, the adoption of graph analytics tools is becoming a strategic priority, thereby driving the growth of the graph analytics market.

Increased Complexity of Data Structures

As organizations in China generate and collect vast amounts of data, the complexity of data structures is increasing. Traditional data analysis methods often fall short in handling these complexities, leading to a growing reliance on graph analytics. This market is expected to benefit from the need to analyze interconnected data points, which is crucial for sectors such as social media, e-commerce, and logistics. The ability to visualize and interpret complex relationships among data entities is becoming essential for effective decision-making. Consequently, the rising complexity of data structures is a significant driver for the graph analytics market, as businesses seek solutions that can provide deeper insights.

Market Segment Insights

By Application: Fraud Detection (Largest) vs. Recommendation Systems (Fastest-Growing)

In the China graph analytics market, the application segment is characterized by a diverse distribution of values including Fraud Detection, Social Network Analysis, Recommendation Systems, Risk Management, and Knowledge Graphs. Currently, Fraud Detection holds the largest market share, driven by the increasing need for secure transactions and the prevention of financial crimes. In contrast, Recommendation Systems are witnessing significant growth, fueled by advancements in AI and machine learning, allowing for more personalized user experiences. Growth trends show that as businesses continue to digitalize, the demand for graph analytics in applications like Social Network Analysis and Risk Management is also on the rise. Companies are increasingly relying on these tools to derive insights from complex data relationships. Additionally, the expansion of e-commerce and social media platforms in China is creating new opportunities for Recommendation Systems, positioning them as the fastest-growing segment within the market, driven by their ability to enhance customer engagement and satisfaction.

Fraud Detection (Dominant) vs. Recommendation Systems (Emerging)

Fraud Detection represents the dominant force in the China graph analytics market, primarily because of its crucial role in safeguarding financial transactions and minimizing losses against fraud. Organizations are adopting advanced analytics solutions to combat fraudulent activities effectively. On the other hand, Recommendation Systems are emerging strongly, leveraging graph analytics to offer personalized recommendations based on user behavior and preferences. This segment is capitalizing on the growing trend of big data and AI, as companies aim to tailor their offerings and boost retention rates. Both segments are essential, but while Fraud Detection is deeply established, Recommendation Systems are rapidly evolving due to technological innovations and changing consumer expectations.

By Deployment Mode: Cloud-Based (Largest) vs. Hybrid (Fastest-Growing)

In the China graph analytics market, the deployment mode segment showcases a diverse distribution of options. Currently, Cloud-Based solutions hold the largest market share due to their scalability and cost-effectiveness, making them highly appealing for enterprises looking to harness the power of graph analytics without heavy upfront investments. Meanwhile, On-Premises solutions have a significant but shrinking presence, as organizations transition towards more flexible and agile deployment models. Growth trends indicate that the Hybrid deployment mode is emerging as the fastest-growing segment, driven by the increasing demand for versatile solutions that offer both secure local control and the benefits of cloud scalability. Factors such as the rising adoption of remote work and the need for real-time analytics further fuel the growth of Hybrid deployments, positioning them as a preferred choice among organizations aiming for digital transformation.

Cloud-Based (Dominant) vs. On-Premises (Emerging)

The Cloud-Based deployment mode is currently the dominant force in the China graph analytics market, largely due to its ability to provide seamless integration, automatic updates, and reduced infrastructure costs. Companies benefit from the flexibility of scaling resources according to their needs, allowing for efficient data processing and analysis. In contrast, On-Premises solutions are deemed an emerging segment, appealing to organizations with strict data governance and security requirements. While they have a dedicated user base, the limitations in scalability and higher maintenance costs make them less favorable compared to Cloud-Based options. Thus, the market is leaning towards cloud-centric approaches, but On-Premises solutions still have a critical role in specific industries.

By End User: BFSI (Largest) vs. Retail (Fastest-Growing)

In the China graph analytics market, the BFSI sector holds the largest share, reflecting its substantial investment in data analysis for fraud detection, risk management, and customer service optimization. Retail also plays a significant role, leveraging graph analytics for understanding consumer behavior and inventory management. The telecommunications and healthcare sectors are growing, but their share remains smaller compared to BFSI and retail. Growth trends in the China graph analytics market are driven by the increasing need for advanced analytics in BFSI to handle large volumes of transaction data efficiently. Retail is rapidly adopting these technologies to enhance customer experiences and streamline operations, making it the fastest-growing segment. The government sector, while emerging, is focusing on data-driven decision-making, contributing to overall market expansion.

BFSI: Dominant vs. Retail: Emerging

The BFSI segment is dominant in the China graph analytics market due to its extensive use of data-driven strategies for risk assessment and customer relationship management. Financial institutions are increasingly relying on complex data models, allowing them to identify patterns and insights crucial for regulatory compliance and operational efficiency. On the other hand, the retail segment is emerging, characterized by its adoption of graph analytics to understand customer preferences and optimize supply chains. Retailers are leveraging these insights to improve personalization in marketing strategies and enhance customer satisfaction, thus driving the growth of this segment significantly in the competitive landscape.

By Component: Software (Largest) vs. Services (Fastest-Growing)

In the China graph analytics market, the distribution of market share among the component segment values showcases a significant preference for Software. This category dominates, capturing a considerable share due to its established solutions and wide adoption across industries. Conversely, Services, while smaller in market share, is rapidly gaining traction as companies increasingly seek specialized analytics services to enhance their operational efficiency and insights.

Software (Dominant) vs. Services (Emerging)

Software remains the dominant force in the component segment, characterized by a wide array of applications that enable organizations to leverage data effectively. Its integration capabilities and user-friendly interfaces have solidified its market position, making it a go-to choice for businesses aiming to harness graph analytics. On the other hand, Services represents an emerging segment, driven by the rising demand for customized analytics solutions and consulting services. This trend is fueled by the complexities of data management and the need for tailored insights, positioning Services as a vital counterpart to traditional software offerings in the evolving landscape of the China graph analytics market.

Get more detailed insights about China Graph Analytics Market

Key Players and Competitive Insights

The graph analytics market in China is characterized by a dynamic competitive landscape, driven by the increasing demand for data-driven decision-making across various sectors. Key players are actively pursuing strategies that emphasize innovation, partnerships, and regional expansion to enhance their market presence. Companies such as Neo4j (US), Amazon Web Services (US), and Microsoft (US) are at the forefront, leveraging their technological capabilities to offer advanced graph analytics solutions. Their collective focus on integrating artificial intelligence (AI) and machine learning (ML) into their offerings appears to be shaping the competitive environment, fostering a culture of continuous improvement and adaptation.

In terms of business tactics, companies are increasingly localizing their operations to better serve the Chinese market, optimizing supply chains to enhance efficiency and responsiveness. The market structure is moderately fragmented, with several players vying for market share, yet the influence of major companies remains substantial. This competitive structure encourages innovation and drives companies to differentiate their offerings, thereby enhancing the overall market dynamics.

In October 2025, Neo4j (US) announced a strategic partnership with a leading Chinese telecommunications firm to develop tailored graph analytics solutions aimed at enhancing network optimization. This collaboration is significant as it not only expands Neo4j's footprint in the region but also aligns with the growing trend of telecommunications companies seeking advanced analytics to improve service delivery and customer experience. Such partnerships are likely to bolster Neo4j's competitive positioning in the market.

In September 2025, Amazon Web Services (US) launched a new suite of graph analytics tools specifically designed for the Chinese market, focusing on scalability and ease of integration with existing systems. This move underscores AWS's commitment to catering to local needs and enhancing its service offerings. By providing localized solutions, AWS is poised to capture a larger share of the market, appealing to businesses looking for robust and adaptable analytics capabilities.

In August 2025, Microsoft (US) unveiled a new initiative aimed at integrating its graph analytics platform with AI-driven insights for Chinese enterprises. This initiative is particularly noteworthy as it reflects Microsoft's strategy to leverage AI to enhance data analysis capabilities, thereby enabling businesses to derive actionable insights more efficiently. The integration of AI into graph analytics is likely to set a new standard in the market, pushing competitors to innovate further.

As of November 2025, current trends in the graph analytics market are heavily influenced by digitalization, sustainability, and the integration of AI technologies. Strategic alliances among key players are reshaping the competitive landscape, fostering collaboration that enhances innovation and market responsiveness. Looking ahead, it is anticipated that competitive differentiation will increasingly pivot from price-based strategies to a focus on technological innovation, reliability in supply chains, and the ability to deliver tailored solutions that meet the evolving needs of businesses.

Industry Developments

In recent developments in the China Graph Analytics Market, companies such as Huawei, Tencent, and Alibaba are intensifying their efforts in enhancing data-driven solutions. As of September 2023, Huawei announced advancements in AI-enhanced graph analytics capabilities within its cloud service offerings, aiming to improve data insights for businesses. In August 2023, Tencent launched a new graph database designed to provide real-time processing for social network data, positioning itself as a leader in this space. Neusoft and Inspur have recently secured contracts with local governments to implement graph analytics for urban management and public safety initiatives.

Mergers and acquisitions have played a crucial role, with Ping An Technology acquiring a minority stake in Digiwin Software in July 2023, enhancing their analytical capacities in the healthcare domain. Additionally, in April 2023, Alibaba's acquisition of a small tech firm specializing in graph databases was aimed at streamlining its cloud services to better serve enterprise clients. The market has seen substantial growth, driven by increased demand for data integration and analytics, particularly fueled by advancements in AI technologies, which facilitated better decision-making and operational efficiency among businesses in China.

Future Outlook

China Graph Analytics Market Future Outlook

The graph analytics market in China is projected to grow at a 17.48% CAGR from 2024 to 2035, driven by increasing data complexity and demand for real-time insights.

New opportunities lie in:

  • Development of AI-driven graph analytics platforms for predictive modeling.
  • Integration of graph analytics in supply chain optimization solutions.
  • Expansion of graph-based cybersecurity tools for threat detection.

By 2035, the market is expected to achieve substantial growth, reflecting its critical role in data-driven decision-making.

Market Segmentation

China Graph Analytics Market End User Outlook

  • BFSI
  • Retail
  • Telecommunications
  • Healthcare
  • Government

China Graph Analytics Market Component Outlook

  • Software
  • Services

China Graph Analytics Market Application Outlook

  • Fraud Detection
  • Social Network Analysis
  • Recommendation Systems
  • Risk Management
  • Knowledge Graphs

China Graph Analytics Market Deployment Mode Outlook

  • On-Premises
  • Cloud-Based
  • Hybrid

Report Scope

MARKET SIZE 2024 352.56(USD Million)
MARKET SIZE 2025 414.19(USD Million)
MARKET SIZE 2035 2073.64(USD Million)
COMPOUND ANNUAL GROWTH RATE (CAGR) 17.48% (2024 - 2035)
REPORT COVERAGE Revenue Forecast, Competitive Landscape, Growth Factors, and Trends
BASE YEAR 2024
Market Forecast Period 2025 - 2035
Historical Data 2019 - 2024
Market Forecast Units USD Million
Key Companies Profiled Neo4j (US), Amazon Web Services (US), Microsoft (US), IBM (US), Oracle (US), SAP (DE), TigerGraph (US), DataStax (US), ArangoDB (DE)
Segments Covered Application, Deployment Mode, End User, Component
Key Market Opportunities Integration of artificial intelligence in the graph analytics market enhances data insights and decision-making capabilities.
Key Market Dynamics Rising demand for real-time data insights drives innovation in the graph analytics market.
Countries Covered China

Leave a Comment

FAQs

What is the expected market size of the China Graph Analytics Market in 2024?

In 2024, the China Graph Analytics Market is expected to be valued at 496.12 USD Million.

What will be the projected market value of the China Graph Analytics Market by 2035?

By 2035, the overall market value is expected to reach 5110.15 USD Million.

What is the expected CAGR for the China Graph Analytics Market from 2025 to 2035?

The expected compound annual growth rate for the China Graph Analytics Market from 2025 to 2035 is 23.617%.

Which application is projected to have the highest market value in 2035?

The Fraud Detection application is projected to reach a market value of 1350.0 USD Million by 2035.

What are the key players in the China Graph Analytics Market?

Some major players in the market include Huawei, Tencent, Alibaba, and Neusoft among others.

What is the forecasted market value for Social Network Analysis in 2035?

The market value for Social Network Analysis in 2035 is anticipated to be 1200.0 USD Million.

How much is the Knowledge Graphs application expected to grow by 2035?

The Knowledge Graphs application is expected to grow to a market value of 1510.15 USD Million by 2035.

What is the projected market size for Recommendation Systems by 2035?

By 2035, the Recommendation Systems application is projected to reach a market size of 950.0 USD Million.

What market value is expected for Risk Management in 2035?

The Risk Management application is expected to achieve a market value of 1100.0 USD Million by 2035.

What challenges and opportunities are present in the China Graph Analytics Market?

The market presents opportunities driven by data analytics advancements but faces challenges from rapid technological changes and competition.

Download Free Sample

Kindly complete the form below to receive a free sample of this Report

Compare Licence

×
Features License Type
Single User Multiuser License Enterprise User
Price $4,950 $5,950 $7,250
Maximum User Access Limit 1 User Upto 10 Users Unrestricted Access Throughout the Organization
Free Customization
Direct Access to Analyst
Deliverable Format
Platform Access
Discount on Next Purchase 10% 15% 15%
Printable Versions