×
Request Free Sample ×

Kindly complete the form below to receive a free sample of this Report

Leading companies partner with us for data-driven Insights

clients tt-cursor
Hero Background

Germany Graph Analytics Market

ID: MRFR/ICT/63472-HCR
200 Pages
Aarti Dhapte
October 2025

Germany Graph Analytics Market Research Report By Application (Fraud Detection, Social Network Analysis, Recommendation Systems, Risk Management, Knowledge Graphs), By Deployment Mode (On-Premises, Cloud-Based, Hybrid), By End User (BFSI, Retail, Telecommunications, Healthcare, Government) and By Component (Software, Services)- Forecast to 2035

Share:
Download PDF ×

We do not share your information with anyone. However, we may send you emails based on your report interest from time to time. You may contact us at any time to opt-out.

Purchase Options

Germany Graph Analytics Market Summary

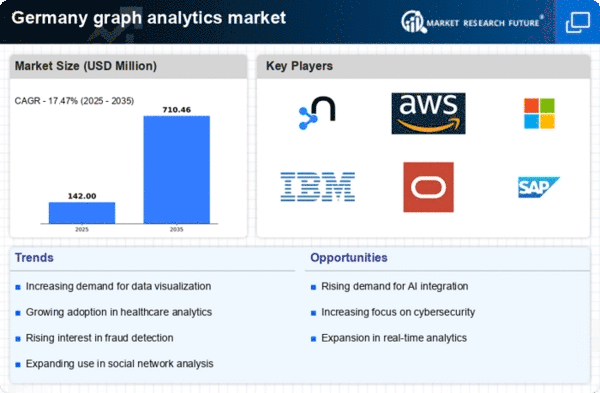
As per MRFR analysis, the Germany graph analytics market size was estimated at 120.88 USD Million in 2024. The Germany graph analytics market is projected to grow from 142.0 USD Million in 2025 to 710.46 USD Million by 2035, exhibiting a compound annual growth rate (CAGR) of 17.47% during the forecast period 2025 - 2035.

Key Market Trends & Highlights

The Germany graph analytics market is experiencing robust growth driven by technological advancements and increasing demand for data insights.

  • The market is witnessing increased adoption of AI and machine learning technologies across various sectors.
  • Real-time data processing is becoming a critical requirement, particularly in the finance and healthcare segments.
  • The largest segment is anticipated to be the finance sector, while the fastest-growing segment is likely to be healthcare.
  • Key market drivers include the integration of graph analytics with IoT and advancements in cloud computing technologies.

Market Size & Forecast

2024 Market Size 120.88 (USD Million)
2035 Market Size 710.46 (USD Million)

Major Players

Neo4j (US), Amazon Web Services (US), Microsoft (US), IBM (US), Oracle (US), SAP (DE), TigerGraph (US), DataStax (US), ArangoDB (DE)

Germany Graph Analytics Market Trends

the graph analytics market in Germany is currently experiencing significant growth., driven by the increasing demand for data-driven decision-making across various sectors. Organizations are recognizing the value of visualizing complex relationships within their data, which enhances their ability to derive actionable insights. This trend is particularly evident in industries such as finance, healthcare, and telecommunications, where the ability to analyze interconnected data points can lead to improved operational efficiency and strategic planning. Furthermore, advancements in technology, including artificial intelligence and machine learning, are facilitating more sophisticated graph analytics solutions, enabling businesses to tackle intricate data challenges with greater ease. In addition, the regulatory landscape in Germany is fostering a conducive environment for the growth of the graph analytics market. With stringent data protection laws, companies are increasingly focused on ensuring compliance while leveraging analytics to gain competitive advantages. This dual focus on compliance and innovation is likely to drive investments in graph analytics tools and platforms. As organizations continue to prioritize data security and privacy, the demand for solutions that can effectively manage and analyze data within these frameworks is expected to rise, further propelling the market forward. Overall, the graph analytics market in Germany is expected to experience substantial growth., reflecting broader trends in data utilization and technological advancement.

Increased Adoption of AI and Machine Learning

The integration of artificial intelligence and machine learning technologies into graph analytics tools is becoming more prevalent. This trend allows organizations to automate complex data analysis processes, leading to faster and more accurate insights. As businesses seek to enhance their analytical capabilities, the demand for AI-driven graph analytics solutions is likely to grow.

Focus on Data Privacy and Compliance

With stringent data protection regulations in place, organizations are prioritizing compliance in their analytics strategies. The graph analytics market is witnessing a shift towards solutions that not only provide insights but also ensure adherence to legal requirements. This focus on data privacy is shaping the development of new tools and methodologies.

Expansion in Industry Applications

Various sectors, including finance, healthcare, and logistics, are increasingly utilizing graph analytics to improve decision-making processes. The versatility of graph analytics tools enables organizations to uncover hidden patterns and relationships within their data, leading to enhanced operational efficiency and strategic insights. This trend indicates a broadening scope of applications across industries.

Germany Graph Analytics Market Drivers

Integration of Graph Analytics with IoT

The integration of graph analytics with the Internet of Things (IoT) is emerging as a pivotal driver for the graph analytics market in Germany. As IoT devices proliferate, the volume of interconnected data generated increases exponentially. Graph analytics provides a robust framework for understanding complex relationships within this data, facilitating insights that are crucial for sectors such as smart cities and industrial automation. The market for IoT analytics is expected to reach €10 billion by 2026, with graph analytics playing a significant role in this growth. This integration not only enhances data interpretation but also supports predictive maintenance and operational efficiency, thereby propelling the graph analytics market forward.

Rising Demand for Real-Time Data Processing

The graph analytics market in Germany experiences a notable surge in demand for real-time data processing capabilities. Organizations increasingly recognize the necessity of analyzing data as it flows, enabling them to make timely decisions. This trend is particularly evident in sectors such as finance and telecommunications, where the ability to process and analyze vast amounts of data in real-time can lead to competitive advantages. According to recent estimates, the market for real-time analytics is projected to grow at a CAGR of approximately 25% over the next five years. This growth is likely to drive investments in graph analytics solutions that can efficiently handle real-time data streams, thereby enhancing the overall performance of the graph analytics market in Germany.

Advancements in Cloud Computing Technologies

The advancements in cloud computing technologies are reshaping the landscape of the graph analytics market in Germany. With the increasing adoption of cloud-based solutions, organizations are now able to access powerful graph analytics tools without the need for extensive on-premises infrastructure. This shift not only reduces operational costs but also enhances scalability and flexibility. The cloud segment of the graph analytics market is projected to grow at a CAGR of around 20% over the next few years. As more businesses migrate to the cloud, the demand for graph analytics solutions that can seamlessly integrate with cloud platforms is expected to rise, further driving market growth.

Emergence of Advanced Visualization Techniques

The emergence of advanced visualization techniques is becoming a crucial driver for the graph analytics market in Germany. As organizations seek to derive actionable insights from complex data sets, the ability to visualize relationships and patterns becomes paramount. Innovative visualization tools enable users to interact with data in intuitive ways, facilitating better decision-making processes. The market for data visualization is anticipated to grow significantly, with graph analytics playing a central role in this evolution. Enhanced visualization capabilities not only improve user engagement but also empower businesses to communicate insights effectively, thereby fostering the growth of the graph analytics market.

Growing Focus on Fraud Detection and Risk Management

In Germany, the graph analytics market is significantly influenced by the growing focus on fraud detection and risk management across various industries. Financial institutions, in particular, are leveraging graph analytics to identify suspicious patterns and relationships that may indicate fraudulent activities. The ability to visualize and analyze complex networks of transactions allows organizations to enhance their security measures effectively. Recent studies suggest that the implementation of graph analytics can reduce fraud-related losses by up to 30%. As regulatory pressures increase, the demand for advanced analytics solutions that can provide deeper insights into risk management is likely to bolster the graph analytics market.

Market Segment Insights

By Application: Fraud Detection (Largest) vs. Recommendation Systems (Fastest-Growing)

In the Germany graph analytics market, Fraud Detection is the largest application segment, commanding a significant share due to its critical role in financial security. Growing concerns over financial fraud have propelled investments in advanced graph analytics solutions, allowing businesses to detect anomalies and prevent fraudulent activities more effectively. Meanwhile, Social Network Analysis and Risk Management also hold substantial shares, reflecting their importance in various industries. Emerging trends in the Germany graph analytics market indicate that Recommendation Systems are growing at the fastest rate, driven by the need for personalized customer experiences in e-commerce and social media. Businesses increasingly leverage graph analytics to enhance user engagement through targeted recommendations, establishing this segment as a key growth driver. Knowledge Graphs are also gaining traction, as they enable organizations to derive insights from complex data relationships, further contributing to market diversification.

Fraud Detection: Dominant vs. Recommendation Systems: Emerging

Fraud Detection has established itself as the dominant application in the Germany graph analytics market, primarily utilized by financial institutions and insurance companies to combat rising fraud trends. It employs intricate algorithms to analyze relationships and pinpoint suspicious activity patterns, thus minimizing losses. On the other hand, Recommendation Systems are an emerging segment that utilizes user interaction data to provide tailored suggestions, enhancing customer satisfaction and loyalty. This segment has been gaining rapid traction as industries strive to optimize user experiences and interactions through data-driven insights. Both segments highlight the evolving landscape of the market, reflecting the increasing importance of advanced analytics in decision-making.

By Deployment Mode: Cloud-Based (Largest) vs. On-Premises (Fastest-Growing)

In the Germany graph analytics market, the deployment mode segment is primarily dominated by cloud-based solutions, which command a significant market share due to their scalability and flexibility. In contrast, on-premises solutions, while slightly trailing, are witnessing a surge in adoption as enterprises seek heightened control and security over their data. Hybrid solutions also cater to niche requirements, combining benefits of both cloud and on-premises deployment, but remain a smaller portion of the market share. The growth trends within this segment are influenced by several factors, including the increasing demand for real-time data analytics and the drive towards digital transformation across industries. Cloud-based solutions are experiencing rapid growth as organizations prioritize agility and cost-effectiveness. Meanwhile, on-premises solutions are poised for growth as traditional businesses recognize their need to maintain sensitive data locally while leveraging analytics capabilities. The hybrid deployment model is also gaining traction as it offers a balanced approach for businesses with varying needs.

Cloud-Based (Dominant) vs. On-Premises (Emerging)

Cloud-based deployment solutions have carved a dominant position in the Germany graph analytics market, providing businesses with advanced capabilities, lower upfront costs, and seamless updates. These solutions enable organizations to leverage powerful analytics without the need for significant hardware investments. On the other hand, on-premises deployment solutions are considered emerging as they cater to businesses that require strict data governance and customized performance settings. The shift towards on-premises is propelled by increased concerns regarding data privacy and compliance, ensuring that sensitive information remains securely within the organization's infrastructure. While cloud solutions dominate, the future may see a more balanced landscape with businesses adopting a mix of both solutions based on their unique needs.

By End User: BFSI (Largest) vs. Retail (Fastest-Growing)

In the Germany graph analytics market, the distribution of market share among end user segments is primarily led by the BFSI sector, which holds the largest share due to its significant reliance on data analytics for risk management and customer insights. Retail follows closely behind, experiencing a surge in market share as businesses increasingly adopt analytics to enhance customer experiences and optimize operations. The growth trends within the end user segments indicate a rising interest in graph analytics in sectors like retail and telecommunications, driven by advancements in technology and a growing emphasis on data-driven decision making. Healthcare and government sectors are also exploring graph analytics to improve efficiency and data interoperability, contributing to a broader adoption across multiple industries in the coming years.

BFSI: Dominant vs. Retail: Emerging

The BFSI sector stands as the dominant force in the Germany graph analytics market, leveraging advanced analytics to enhance fraud detection, risk assessment, and customer relationship management. This sector benefits from strict regulatory demands, necessitating sophisticated data solutions. In contrast, retail is emerging rapidly as businesses in this segment harness graph analytics for insights into purchasing patterns and inventory optimization. The shift towards omnichannel retailing necessitates real-time analytics, thus driving demand in this sector. Both segments exhibit unique characteristics: BFSI focuses on security and compliance, while retail emphasizes customer engagement and experience, reflecting their different operational priorities and market dynamics.

By Component: Software (Largest) vs. Services (Fastest-Growing)

In the Germany graph analytics market, the Software segment commands the largest share, reflecting its critical role in facilitating data visualization and analytics capabilities. The dominance of software solutions in this market is driven by their ability to integrate with various data sources and provide real-time insights, making them indispensable for businesses aiming to enhance decision-making processes. Conversely, the Services segment, while smaller in terms of market share, is experiencing rapid growth as organizations increasingly seek specialized expertise to implement and optimize their graph analytics solutions, indicating a strong demand for consulting, training, and support services. Growing investment in advanced analytics tools and a focus on data-driven business strategies are key drivers behind the expansion of both segments. The demand for Software is sustained by continuous innovations and the need for organizations to harness large amounts of data effectively. Meanwhile, the Services segment benefits from the rising complexity of data environments, prompting businesses to outsource their analytics needs to experts who can deliver tailored solutions and enhance functionality. As such, organizations are progressively investing in both Software and Services to stay ahead in a competitive market.

Software (Dominant) vs. Services (Emerging)

The Software segment in the Germany graph analytics market is characterized by its robust integration capabilities and comprehensive analytics functionalities, positioning it as the go-to solution for businesses looking to leverage data. Leading software solutions provide a rich set of features including data visualization, predictive analytics, and machine learning algorithms, which help organizations extract valuable insights and drive strategic decisions. On the other hand, the Services segment has emerged as a crucial partner for companies aiming to implement graph analytics efficiently. This segment offers essential support, from professional services for setup to ongoing maintenance and training, enabling clients to maximize the utility of their analytics investments. As organizations navigate the complexities of their data ecosystems, the collaborative relationship between Software and Services is becoming increasingly vital, effectively bridging technological capabilities with user expertise.

Get more detailed insights about Germany Graph Analytics Market

Key Players and Competitive Insights

The graph analytics market in Germany is characterized by a dynamic competitive landscape, driven by the increasing demand for data-driven decision-making and the growing complexity of data relationships. Key players such as Neo4j (US), Amazon Web Services (US), and SAP (DE) are at the forefront, each adopting distinct strategies to enhance their market positioning. Neo4j (US) focuses on innovation through continuous product development, emphasizing its graph database technology's capabilities in handling complex queries efficiently. Meanwhile, Amazon Web Services (US) leverages its extensive cloud infrastructure to offer scalable graph analytics solutions, catering to a diverse clientele. SAP (DE), with its strong local presence, emphasizes integration with enterprise resource planning systems, thereby enhancing its value proposition in the market. Collectively, these strategies contribute to a competitive environment that is increasingly centered around technological advancement and customer-centric solutions.

In terms of business tactics, companies are increasingly localizing their operations to better serve the German market, optimizing supply chains to enhance efficiency. the competitive structure of the market is moderately fragmented., with several players vying for market share. However, the influence of major companies is substantial, as they set benchmarks for innovation and service delivery, thereby shaping the overall market dynamics.

In October 2025, Neo4j (US) announced a strategic partnership with a leading telecommunications provider to enhance its graph analytics capabilities for network optimization. This collaboration is expected to leverage Neo4j's advanced algorithms to improve network performance and customer experience, indicating a significant move towards industry-specific applications of graph analytics. Such partnerships may enhance Neo4j's competitive edge by expanding its reach into new sectors.

In September 2025, SAP (DE) launched a new version of its graph analytics tool, integrating advanced machine learning features aimed at improving predictive analytics for enterprise customers. This development underscores SAP's commitment to innovation and its strategy to provide comprehensive solutions that address the evolving needs of businesses. By enhancing its product offerings, SAP positions itself as a leader in the integration of graph analytics within enterprise systems.

In August 2025, Amazon Web Services (US) expanded its graph database services by introducing a new pricing model that allows customers to pay only for the resources they use. This strategic move is likely to attract a broader range of customers, particularly small and medium-sized enterprises, by lowering the entry barrier for utilizing advanced graph analytics. Such pricing strategies may significantly influence market dynamics by fostering greater adoption of cloud-based solutions.

As of November 2025, the competitive trends in the graph analytics market are increasingly defined by digitalization, sustainability, and the integration of artificial intelligence. Strategic alliances are becoming more prevalent, as companies recognize the value of collaboration in enhancing their technological capabilities. Looking ahead, competitive differentiation is expected to evolve, with a shift from price-based competition towards innovation, technological advancement, and supply chain reliability. This transition suggests that companies that prioritize these aspects will likely gain a competitive advantage in the rapidly evolving landscape.

Industry Developments

In recent months, the Germany Graph Analytics Market has witnessed significant developments, particularly with major players like Oracle, Neo4j, and Microsoft expanding their footprint. In September 2023, Oracle announced enhancements to its cloud services, emphasizing graph database capabilities. Meanwhile, Neo4j has celebrated the launch of its latest version, aimed at improving data visualization and integration within business intelligence frameworks. Companies in the region are increasingly adopting graph analytics to gain insights into complex data relationships, driving growth in market valuation, particularly in sectors like finance and healthcare.

Notably, in August 2023, IBM's acquisition of a small German tech firm specialized in data science further cemented its position in the analytics landscape, with expectations of enhanced AI-driven graph analytics solutions. The interest in graph technologies has been bolstered by Germany's push for digital transformation across industries, leading to substantial investments in Research and Development, which encourages innovation in analytical tools. Other key players, such as TIBCO Software and DataStax, continue to innovate, offering solutions that cater to the growing demand for real-time data processing and analysis, setting a competitive tone for the market.

Future Outlook

Germany Graph Analytics Market Future Outlook

The graph analytics market is projected to grow at a 17.47% CAGR from 2024 to 2035, driven by increasing data complexity, demand for real-time insights, and advancements in AI technologies.

New opportunities lie in:

  • Development of AI-driven predictive analytics tools for real-time decision-making.
  • Integration of graph analytics in cybersecurity solutions to enhance threat detection.
  • Creation of tailored graph analytics platforms for specific industry verticals like healthcare and finance.

By 2035, the graph analytics market is expected to achieve substantial growth, driven by innovative applications and strategic investments.

Market Segmentation

Germany Graph Analytics Market End User Outlook

  • BFSI
  • Retail
  • Telecommunications
  • Healthcare
  • Government

Germany Graph Analytics Market Component Outlook

  • Software
  • Services

Germany Graph Analytics Market Application Outlook

  • Fraud Detection
  • Social Network Analysis
  • Recommendation Systems
  • Risk Management
  • Knowledge Graphs

Germany Graph Analytics Market Deployment Mode Outlook

  • On-Premises
  • Cloud-Based
  • Hybrid

Report Scope

MARKET SIZE 2024 120.88(USD Million)
MARKET SIZE 2025 142.0(USD Million)
MARKET SIZE 2035 710.46(USD Million)
COMPOUND ANNUAL GROWTH RATE (CAGR) 17.47% (2024 - 2035)
REPORT COVERAGE Revenue Forecast, Competitive Landscape, Growth Factors, and Trends
BASE YEAR 2024
Market Forecast Period 2025 - 2035
Historical Data 2019 - 2024
Market Forecast Units USD Million
Key Companies Profiled Neo4j (US), Amazon Web Services (US), Microsoft (US), IBM (US), Oracle (US), SAP (DE), TigerGraph (US), DataStax (US), ArangoDB (DE)
Segments Covered Application, Deployment Mode, End User, Component
Key Market Opportunities Integration of artificial intelligence in graph analytics enhances data insights and decision-making capabilities.
Key Market Dynamics Rising demand for real-time data insights drives innovation in graph analytics solutions across various industries.
Countries Covered Germany

Leave a Comment

FAQs

What is the expected market size of the Germany Graph Analytics Market in 2024?

The Germany Graph Analytics Market is expected to be valued at 162.0 million USD in 2024.

What will be the market size of the Germany Graph Analytics Market by 2035?

By 2035, the Germany Graph Analytics Market is projected to reach a valuation of 1045.0 million USD.

What is the expected CAGR for the Germany Graph Analytics Market from 2025 to 2035?

The Germany Graph Analytics Market is anticipated to grow at a compound annual growth rate of 18.468% from 2025 to 2035.

Which application is estimated to have the highest market value in 2035?

Recommendation Systems is expected to have the highest market value, forecasted at 300.0 million USD in 2035.

What is the market value for Fraud Detection in the Germany Graph Analytics Market in 2024?

In 2024, the market value for Fraud Detection is expected to be 30.0 million USD.

What are the major players in the Germany Graph Analytics Market?

Key players in the market include Oracle, Redis Labs, TigerGraph, and IBM among others.

How much is the market for Social Network Analysis expected to grow from 2024 to 2035?

The market for Social Network Analysis is projected to grow from 25.0 million USD in 2024 to 175.0 million USD by 2035.

What is the expected market value for Risk Management in 2035?

The expected market value for Risk Management in 2035 is projected to be 250.0 million USD.

How much is the Germany Graph Analytics Market estimated to be worth in 2025?

While specific figures for 2025 are not provided, the market is on a growth trajectory towards 1045.0 million USD by 2035.

What is the forecasted market size for Knowledge Graphs in 2035?

The forecasted market size for Knowledge Graphs in 2035 is anticipated to be 120.0 million USD.

Download Free Sample

Kindly complete the form below to receive a free sample of this Report

Compare Licence

×
Features License Type
Single User Multiuser License Enterprise User
Price $4,950 $5,950 $7,250
Maximum User Access Limit 1 User Upto 10 Users Unrestricted Access Throughout the Organization
Free Customization
Direct Access to Analyst
Deliverable Format
Platform Access
Discount on Next Purchase 10% 15% 15%
Printable Versions