• Cat-intel
  • MedIntelliX
  • Resources
  • About Us
  • Request Free Sample ×

    Kindly complete the form below to receive a free sample of this Report

    Leading companies partner with us for data-driven Insights

    clients tt-cursor
    Hero Background

    US Graph Analytics Market

    ID: MRFR/ICT/12932-HCR
    100 Pages
    Garvit Vyas
    October 2025

    US Graph Analytics Market Research Report: By Application (Fraud Detection, Social Network Analysis, Recommendation Systems, Risk Management, Knowledge Graphs), By Deployment Mode (On-Premises, Cloud-Based, Hybrid), By End User (BFSI, Retail, Telecommunications, Healthcare, Government) and By Component (Software, Services) - Forecast to 2035

    Share:
    Download PDF ×

    We do not share your information with anyone. However, we may send you emails based on your report interest from time to time. You may contact us at any time to opt-out.

    US Graph Analytics Market Infographic
    Purchase Options

    US Graph Analytics Market Summary

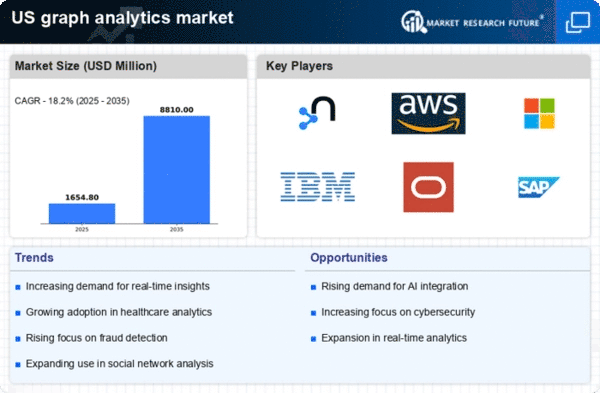
    The US Graph Analytics market is projected to grow from 1.02 billion USD in 2024 to 6.03 billion USD by 2035, reflecting a robust growth trajectory.

    Key Market Trends & Highlights

    US Graph Analytics Key Trends and Highlights

    • The market is expected to experience a compound annual growth rate of 17.53 percent from 2025 to 2035.
    • By 2035, the market valuation is anticipated to reach 6.03 billion USD, indicating substantial growth opportunities.
    • In 2024, the market is valued at 1.02 billion USD, laying a solid foundation for future expansion.
    • Growing adoption of advanced analytics technologies due to increasing data complexity is a major market driver.

    Market Size & Forecast

    2024 Market Size 1.02 (USD Billion)
    2035 Market Size 6.03 (USD Billion)
    CAGR (2025-2035) 17.53%

    Major Players

    SAP, ArangoDB, Neo4j, Oracle, Graphistry, TigerGraph, DataStax, IBM, Cytoscape, Microsoft, Google, TIBCO Software, Amazon, Hewlett Packard Enterprise, Ayasdi

    US Graph Analytics Market Trends

    The US Graph Analytics Market is currently experiencing significant trends driven by the growing need for data-driven decision-making across various sectors. Businesses in the United States are increasingly recognizing the importance of understanding complex relationships in their data, leading to a surge in the adoption of graph analytics. This trend is particularly evident in industries such as finance, healthcare, and social media, where the ability to analyze connections and interactions can provide valuable insights for improving customer experience, optimizing processes, and identifying risks.

    Market Segment Insights

    Graph Analytics Market Application Insights

    The Application segment of the US Graph Analytics Market plays a crucial role in providing insights and solutions across various industries. This segment encompasses several key areas, including Fraud Detection, Social Network Analysis, Recommendation Systems, Risk Management, and Knowledge Graphs, reflecting a versatile approach to harnessing graph-based data for improved decision-making and operational efficiency.

    Fraud Detection utilizes graph analytics to uncover complex patterns of suspicious behavior, thus significantly aiding organizations in mitigating financial risks and enhancing security measures.Social Network Analysis leverages graph analytics to map and interpret relationships among individuals, thereby enabling businesses to understand customer interactions and improve engagement strategies effectively. Recommendation Systems benefit immensely from graph analytics as they analyze user behavior and preferences through interconnected data points, leading to personalized product offerings that enhance customer satisfaction and drive sales.

    Risk Management relies on graph analytics to identify and assess potential risks by visualizing relationships between different entities, thus fostering better-informed risk mitigation strategies.Knowledge Graphs serve as a backbone for aggregating and visualizing vast amounts of information, facilitating improved data comprehension and access across organizations, which can translate into significant competitive advantages in today’s data-driven market. The growth dynamics in the US Graph Analytics Market are significantly influenced by the increasing complexity of data and the rapid advancement of technologies, driving the demand for sophisticated analytical tools across these applications.

    With the Federal Government focusing on enhancing data-driven decision-making processes, businesses are likely to invest more in graph analytics to comply with regulatory requirements while enhancing operational efficiencies.Furthermore, increasing digitalization and the need for real-time data analysis in organizations are likely to act as significant growth drivers for this market. Each area within the Application segment presents unique challenges and opportunities, thus highlighting the relevance of graph analytics in addressing modern analytical needs effectively. Overall, the Application segment showcases immense potential for growth and innovation, reflecting the evolving landscape of data utilization in the US market.

    Source: Primary Research, Secondary Research, Market Research Future Database and Analyst Review

    Graph Analytics Market Deployment Mode Insights

    The Deployment Mode segment of the US Graph Analytics Market plays a crucial role in shaping the overall landscape of data analytics solutions. With the growing emphasis on data-driven decision-making, businesses are increasingly adopting various deployment models to optimize their graph analytics capabilities. On-Premises solutions offer organizations enhanced control over their data and security, thereby attracting sectors such as finance and healthcare, which prioritize stringent data governance. Conversely, Cloud-Based deployments are witnessing a surge in popularity due to their scalability and lower upfront costs, making them appealing to small and medium-sized enterprises that seek flexibility without significant capital investment.

    The Hybrid approach emerges as a significant player, combining the strengths of both On-Premises and Cloud-Based models, allowing businesses to balance resource allocation and effectively manage sensitive data while benefiting from cloud scalability. The growing trend of digital transformation and the need for real-time analytics further drive this market, as organizations strive to derive actionable insights from complex data sets. As industries explore innovative solutions in a highly competitive environment, the Deployment Mode segment continues to evolve, presenting both challenges and opportunities for stakeholders in the US Graph Analytics Market.

    Graph Analytics Market End User Insights

    The US Graph Analytics Market is notably shaped by its diverse end user landscape, which includes critical sectors such as BFSI, Retail, Telecommunications, Healthcare, and Government. The BFSI sector leverages graph analytics to enhance fraud detection and risk management, reflecting the industry's ongoing need for robust data analysis tools. In Retail, graph analytics plays a pivotal role in enhancing customer experiences through personalized recommendations and targeted marketing strategies, ultimately driving sales growth. The Telecommunications sector utilizes these analytical capabilities to optimize network performance and improve customer service by establishing more effective communication patterns.

    In Healthcare, graph analytics aids in patient data analysis, ensuring better treatment outcomes and operational efficiency within healthcare facilities. Finally, the Government sector employs graph analytics to tackle complex issues such as public safety and resource allocation, making informed decisions based on interconnected data. Overall, these segments underscore the critical importance of graph analytics in driving innovation and efficiency across the US economy, significantly contributing to market expansion. Managing these interconnections effectively remains a central focus for stakeholders aiming to unlock the full potential of their data.

    Graph Analytics Market Component Insights

    The Component segment of the US Graph Analytics Market plays a vital role in shaping the industry's development and growth dynamics. This segment is primarily divided into Software and Services, each offering unique contributions to the market's expansion. Software solutions enable organizations to efficiently visualize and analyze complex data relationships, driving informed decision-making processes.

    This capability is crucial for various industries including finance, healthcare, and transportation, where analyzing interconnections can lead to improved operational efficiencies and risk management.On the other hand, Services encompass consulting, implementation, and support, which are essential for organizations looking to optimize their use of graph analytics tools. These Services often help in addressing specific business challenges and providing tailored solutions, thereby enhancing user engagement and satisfaction.

    As businesses increasingly recognize the value of data-driven insights, the importance of both Software and Services within the Component segment continues to grow, supported by advancements in technology and increased adoption of analytics frameworks.The combined offerings of Software and Services in the Graph Analytics sector underline a substantial demand for sophisticated analytics solutions that enable businesses to harness the potential of their data effectively.

    Get more detailed insights about US Graph Analytics Market Research Report - Forecast till 2035

    Key Players and Competitive Insights

    The competitive landscape of the US Graph Analytics Market is characterized by rapid advancements and the emergence of innovative technologies that cater to the growing demand for data-driven insights. Graph analytics, which focuses on analyzing relationships and connections within large data sets, has garnered significant attention from various industries such as finance, healthcare, social media, and telecommunications. In this dynamic market, companies are increasingly recognizing the potential of graph-based solutions to provide deeper insights and foster more efficient decision-making processes.

    The competition is fueled by the necessity for businesses to harness real-time data analysis capabilities while enhancing their operational efficiencies and customer experiences. Consequently, a variety of players are vying for market share, each focusing on developing unique features and enhancing the usability of their graph analytics platforms.SAP, recognized for its strong presence in the enterprise software sector, has successfully integrated graph analytics capabilities into its offerings tailored for the US market. Known for its robust enterprise resource planning systems, SAP leverages graph algorithms in its solutions to optimize business processes and deliver actionable insights.

    The company’s strengths lie in its comprehensive suite of tools that allow organizations to visualize complex data relationships and rapidly interpret results, thereby driving better decision-making. SAP’s existing client base spans numerous sectors, positioning it as a trusted provider in the US marketplace. Furthermore, its commitment to enhancing functionality through continuous innovations and strong customer support offers it an advantage over competitors, ensuring that it remains a prominent player in the graph analytics space.ArangoDB stands out in the US Graph Analytics Market with its unique hybrid database solution, which integrates document, key/value, and graph data models into a single platform.

    This versatility allows users to perform complex queries and achieve data analysis across various data types with ease. Key products from ArangoDB focus on simplifying the development process and enhancing access to relational data structures through its open-source platform. The company has established a solid market presence in the US, recognized for its strong community support and rapid deployment capabilities. Notable strengths include its scalability, performance, and ability to support diverse use cases across industries. Additionally, ArangoDB has strategically engaged in various partnerships and collaborations to expand its market reach, further establishing its presence in the sector.

    These initiatives and continuous innovations contribute to ArangoDB's position as a formidable competitor within the US graph analytics marketplace.

    Key Companies in the US Graph Analytics Market market include

    Industry Developments

    The US Graph Analytics Market has seen significant activity recently, particularly with companies like Neo4j, SAP, and Oracle enhancing their offerings to meet rising demand for data analysis and complex relationship mapping. In September 2023, Neo4j launched new features aimed at streamlining large-scale data analytics, while SAP announced collaborations to integrate graph analytics with enterprise resource planning solutions.

    The market is witnessing robust growth, attributed to increasing adoption of graph databases across sectors such as healthcare, finance, and telecommunications, enhancing decision-making and operational efficiency.Additionally, in August 2023, Amazon Web Services expanded its capabilities with new graph database solutions, positioning itself competitively among its peers. In terms of mergers and acquisitions, Graphistry and TIBCO Software announced an acquisition in July 2023, reflecting a trend toward consolidation in the technology sector to leverage advanced analytics capabilities.

    Overall, significant investments and partnerships among leading companies like Microsoft and IBM indicate a thriving landscape that is rapidly evolving to cater to complex business challenges, while the valuation of the sector continues to rise.

    Market Segmentation

    Outlook

    • Software
    • Services

    Graph Analytics Market End User Outlook

    • BFSI
    • Retail
    • Telecommunications
    • Healthcare
    • Government

    Graph Analytics Market Component Outlook

    • Software
    • Services

    Graph Analytics Market Application Outlook

    • Fraud Detection
    • Social Network Analysis
    • Recommendation Systems
    • Risk Management
    • Knowledge Graphs

    Graph Analytics Market Deployment Mode Outlook

    • On-Premises
    • Cloud-Based
    • Hybrid

    Report Scope

    Report Attribute/Metric Source: Details
    MARKET SIZE 2018 0.82(USD Billion)
    MARKET SIZE 2024 1.02(USD Billion)
    MARKET SIZE 2035 6.03(USD Billion)
    COMPOUND ANNUAL GROWTH RATE (CAGR) 17.536% (2025 - 2035)
    REPORT COVERAGE Revenue Forecast, Competitive Landscape, Growth Factors, and Trends
    BASE YEAR 2024
    MARKET FORECAST PERIOD 2025 - 2035
    HISTORICAL DATA 2019 - 2024
    MARKET FORECAST UNITS USD Billion
    KEY COMPANIES PROFILED SAP, ArangoDB, Neo4j, Oracle, Graphistry, TigerGraph, DataStax, IBM, Cytoscape, Microsoft, Google, TIBCO Software, Amazon, Hewlett Packard Enterprise, Ayasdi
    SEGMENTS COVERED Application, Deployment Mode, End User, Component
    KEY MARKET OPPORTUNITIES Real-time data processing needs, Growing demand for fraud detection, Enhanced customer segmentation strategies, Integration with AI and machine learning, Rise in social network analysis tools
    KEY MARKET DYNAMICS Increasing data complexity, Demand for real-time insights, Growth of social networks, Rising adoption of AI, Enhanced cybersecurity needs
    COUNTRIES COVERED US

    FAQs

    What is the expected market size of the US Graph Analytics Market in 2024?

    The US Graph Analytics Market is expected to be valued at 1.02 billion USD in 2024.

    What is the projected market size of the US Graph Analytics Market by 2035?

    By 2035, the US Graph Analytics Market is projected to reach a value of 6.03 billion USD.

    What is the expected CAGR for the US Graph Analytics Market from 2025 to 2035?

    The expected CAGR for the US Graph Analytics Market from 2025 to 2035 is 17.536 percent.

    Which applications are the major contributors to the US Graph Analytics Market?

    Fraud detection, social network analysis, recommendation systems, risk management, and knowledge graphs are key applications driving the market.

    What will the market value of fraud detection be in the US Graph Analytics Market by 2035?

    The market value of fraud detection in the US Graph Analytics Market is expected to reach 1.47 billion USD by 2035.

    What is the anticipated market size for social network analysis in the US Graph Analytics Market by 2035?

    The anticipated market size for social network analysis is projected to be 1.18 billion USD by 2035.

    Who are the key players in the US Graph Analytics Market?

    Major players in the US Graph Analytics Market include SAP, Neo4j, Oracle, and IBM among others.

    What challenges are expected to arise in the US Graph Analytics Market during the forecast period?

    Challenges may include handling data privacy concerns and the need for skilled professionals to manage graph analytics solutions.

    What market value is expected for recommendation systems within the US Graph Analytics Market by 2035?

    The market value for recommendation systems is anticipated to reach 0.89 billion USD by 2035.

    What impact does the current market trend suggest for the knowledge graphs application segment?

    The knowledge graphs segment is expected to grow significantly, with an estimated value of 1.31 billion USD by 2035.

    Download Free Sample

    Kindly complete the form below to receive a free sample of this Report

    Case Study
    Chemicals and Materials