×
Request Free Sample ×

Kindly complete the form below to receive a free sample of this Report

Leading companies partner with us for data-driven Insights

clients tt-cursor
Hero Background

South Korea Graph Analytics Market

ID: MRFR/ICT/63471-HCR
200 Pages
Aarti Dhapte
October 2025

South Korea Graph Analytics Market Research Report By Application (Fraud Detection, Social Network Analysis, Recommendation Systems, Risk Management, Knowledge Graphs), By Deployment Mode (On-Premises, Cloud-Based, Hybrid), By End User (BFSI, Retail, Telecommunications, Healthcare, Government) and By Component (Software, Services)- Forecast to 2035

Share:
Download PDF ×

We do not share your information with anyone. However, we may send you emails based on your report interest from time to time. You may contact us at any time to opt-out.

Purchase Options

South Korea Graph Analytics Market Summary

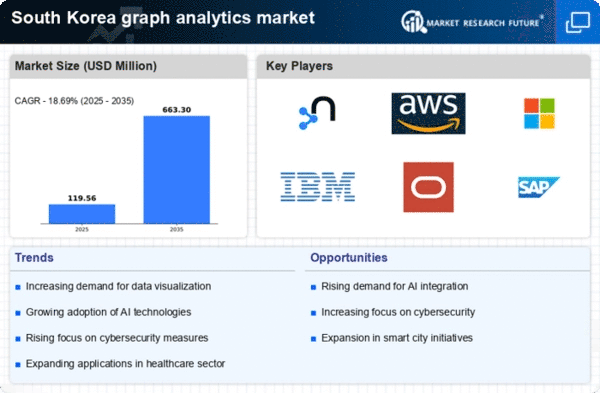
As per MRFR analysis, the South Korea graph analytics market size was estimated at 100.73 USD million in 2024.. The South Korea graph analytics market is projected to grow from 119.56 USD Million in 2025 to 663.3 USD Million by 2035, exhibiting a compound annual growth rate (CAGR) of 18.69% during the forecast period 2025 - 2035.

Key Market Trends & Highlights

the South Korea graph analytics market experiences robust growth driven by technological advancements and increasing data demands..

  • The market is witnessing increased adoption of AI and machine learning technologies, enhancing analytical capabilities.
  • Real-time data processing is becoming a focal point, enabling businesses to make timely decisions based on current data.
  • the demand for data privacy and security rises, reflecting a growing awareness of data protection among consumers and organizations..
  • Key market drivers include the growing need for enhanced data visualization and government initiatives supporting data-driven policies.

Market Size & Forecast

2024 Market Size 100.73 (USD Million)
2035 Market Size 663.3 (USD Million)

Major Players

Neo4j (US), Amazon Web Services (US), Microsoft (US), IBM (US), Oracle (US), SAP (DE), TigerGraph (US), DataStax (US)

South Korea Graph Analytics Market Trends

The graph analytics market in South Korea is experiencing notable growth, driven by the increasing demand for data-driven decision-making across various sectors. Organizations are recognizing the value of visualizing complex data relationships, which enhances their ability to derive insights and make informed choices. This trend is particularly evident in industries such as finance, healthcare, and telecommunications, where the ability to analyze interconnected data points can lead to improved operational efficiency and customer satisfaction. Furthermore, the rise of big data technologies and the proliferation of IoT devices are contributing to the expansion of this market, as businesses seek to harness the power of data analytics to gain a competitive edge. In addition, the South Korean government actively promotes initiatives aimed at fostering innovation in data analytics.. Investments in research and development, along with support for startups in the tech sector, are likely to create a conducive environment for the growth of the graph analytics market. As organizations increasingly adopt advanced analytics tools, the demand for skilled professionals in this field is also expected to rise. This evolving landscape suggests that the graph analytics market will continue to thrive, offering opportunities for both established companies and emerging players in the technology space.

Increased Adoption of AI and Machine Learning

The integration of artificial intelligence and machine learning technologies into the graph analytics market is becoming more prevalent. Organizations are leveraging these advanced tools to enhance their analytical capabilities, enabling them to uncover hidden patterns and trends within complex datasets. This trend is likely to drive innovation and improve decision-making processes across various sectors.

Focus on Real-Time Data Processing

There is a growing emphasis on real-time data processing within the graph analytics market. Businesses are increasingly seeking solutions that allow them to analyze data as it is generated, facilitating timely insights and responses. This shift towards real-time analytics is expected to enhance operational efficiency and customer engagement.

Rising Demand for Data Privacy and Security

As the graph analytics market expands, concerns regarding data privacy and security are becoming more pronounced. Organizations are prioritizing the implementation of robust security measures to protect sensitive information. This trend indicates a shift towards more responsible data management practices, ensuring compliance with regulations and fostering consumer trust.

South Korea Graph Analytics Market Drivers

Rising Importance of Fraud Detection

Fraud detection is emerging as a critical driver for the graph analytics market in South Korea. Financial institutions and e-commerce platforms are increasingly adopting graph analytics to identify and mitigate fraudulent activities. By analyzing relationships and patterns within transaction data, organizations can detect anomalies that may indicate fraudulent behavior. The financial services sector is projected to invest heavily in advanced analytics solutions, with spending expected to reach $2 billion by 2025. This focus on fraud detection not only enhances security but also builds consumer trust, which is vital for sustaining business growth. As the graph analytics market continues to evolve, its role in fraud detection is likely to become more pronounced, leading to further investments in this area.

Demand for Enhanced Customer Insights

The need for enhanced customer insights is driving growth in the graph analytics market in South Korea. Businesses are increasingly leveraging graph analytics to understand customer behavior and preferences better. By analyzing customer interactions and relationships, organizations can tailor their marketing strategies and improve customer engagement. This trend is particularly relevant in the retail and telecommunications sectors, where understanding customer journeys can lead to increased sales and customer loyalty. The market for customer analytics solutions is expected to grow by approximately 15% annually, reaching $1 billion by 2025. As companies strive to create personalized experiences, the graph analytics market is likely to play a crucial role in helping them achieve these objectives.

Integration of Graph Analytics with IoT

The integration of graph analytics with Internet of Things (IoT) technologies is becoming a pivotal driver for the graph analytics market in South Korea. As IoT devices proliferate, the volume of interconnected data generated is immense. Graph analytics provides a framework for understanding the relationships between these devices and the data they produce. This integration allows for real-time monitoring and predictive maintenance, which can lead to cost savings and improved operational efficiency. By 2025, the IoT market in South Korea is expected to exceed $10 billion, and the demand for graph analytics solutions to manage this data is likely to grow correspondingly. This synergy between IoT and graph analytics is expected to enhance decision-making processes across various sectors, including manufacturing, healthcare, and smart cities.

Growing Need for Enhanced Data Visualization

The graph analytics market in South Korea is experiencing a surge in demand for advanced data visualization tools. Organizations are increasingly recognizing the importance of visualizing complex data relationships to derive actionable insights. This trend is driven by the need for businesses to make data-driven decisions quickly and effectively. In 2025, the market for data visualization tools is projected to reach approximately $1.5 billion, reflecting a growth rate of around 20% annually. Enhanced visualization capabilities enable companies to identify patterns and trends that may not be apparent through traditional data analysis methods. As a result, the graph analytics market is likely to expand as organizations seek to leverage these tools for better strategic planning and operational efficiency.

Government Initiatives Supporting Data-Driven Policies

Government initiatives aimed at promoting data-driven policies are significantly influencing the graph analytics market in South Korea. The government is investing in digital transformation projects that leverage data analytics to improve public services and enhance decision-making processes. By 2025, government spending on data analytics is projected to reach $500 million, reflecting a commitment to harnessing data for societal benefits. These initiatives not only foster innovation but also encourage private sector participation in the graph analytics market. As public agencies adopt graph analytics to analyze complex datasets, the demand for these solutions is likely to increase, creating opportunities for vendors and service providers in the market.

Market Segment Insights

By Application: Fraud Detection (Largest) vs. Social Network Analysis (Fastest-Growing)

In the South Korea graph analytics market, Fraud Detection leads in market share, fueled by increasing digital transactions and the rising sophistication of cyber threats. Social Network Analysis, on the other hand, tilts towards rapid growth due to the heightened interest in understanding social dynamics and connections among users on various platforms. The growth trends are heavily influenced by advancements in technology and increased data availability. The rise of AI and machine learning facilitates better analysis and predictions, significantly impacting areas such as Recommendation Systems and Risk Management. As organizations seek to harness data insights for strategic decision-making, these segments are expected to see enhanced investments and innovations moving forward.

Fraud Detection (Dominant) vs. Recommendation Systems (Emerging)

Fraud Detection stands as a dominant segment within the South Korea graph analytics market, primarily due to its critical role in safeguarding financial transactions and personal data. Organizations are increasingly adopting sophisticated algorithms to detect fraudulent patterns, making it essential for operations in various sectors such as finance and e-commerce. On the other hand, Recommendation Systems are emerging, leveraging user data to deliver personalized content and experiences. Companies are investing more in this area to boost customer engagement and satisfaction. As both segments evolve, they contribute significantly to the overall advancement of graph analytics capabilities, with Fraud Detection maintaining its leadership while Recommendation Systems are rapidly becoming a key focus for many businesses.

By Deployment Mode: Cloud-Based (Largest) vs. Hybrid (Fastest-Growing)

In the South Korea graph analytics market, the deployment mode segment is characterized by a significant shift towards cloud-based solutions, which dominate the landscape with a substantial market share. On-premises solutions have seen a decline due to the rising demand for flexibility and scalability, while hybrid solutions are also gaining traction among businesses looking to balance between agility and control. Overall, cloud-based deployment is leading the trend toward modern analytics practices. Growth trends in the deployment mode segment are largely driven by the increased adoption of cloud technologies among organizations seeking to leverage data analytics without the burden of managing their own IT infrastructure. Hybrid deployments are regarded as the fastest-growing segment as they offer the best of both worlds, enabling companies to tailor their analytics solutions according to specific needs while ensuring compliance and security where necessary. The trend indicates a strong preference for cloud services as businesses aim for cost-effectiveness and innovation.

Cloud-Based (Dominant) vs. Hybrid (Emerging)

Cloud-based deployment is the dominant mode in the segment, allowing businesses in the South Korea graph analytics market to leverage modern technological advancements while minimizing the cost of infrastructure. It provides extensive scalability, ensuring that organizations can easily adjust their analytics capabilities according to changing demands. On the other hand, hybrid deployment is emerging as a preferred choice for companies desiring a balanced approach, incorporating both on-premises and cloud environments. This trend reflects a need for flexible solutions, combining the control of on-premises data handling with the innovation and automation possibilities offered by cloud services. As organizations increasingly embrace hybrid models, they position themselves to not only enhance operational efficiency but also to drive competitive advantage in a fast-evolving market.

By End User: BFSI (Largest) vs. Healthcare (Fastest-Growing)

In the South Korea graph analytics market, the BFSI sector holds the largest market share among end users, driven by the need for enhanced security and customer service optimization. Following closely is the retail sector, which leverages graph analytics for customer behavior insights and inventory management. Telecommunications is also significant, focusing on network optimization, while government and healthcare sectors are emerging players increasingly adopting analytics to improve service delivery. Growth in this segment is robust, particularly for healthcare, which is rapidly incorporating graph analytics to enhance patient outcomes through data insights. BFSI continues to expand, emphasizing fraud detection and risk management, while the telecommunications sector focuses on data-driven decision-making. Emerging technologies and the rising adoption of AI are prominent drivers for these sectors, pushing the demand for graph analytics solutions.

BFSI (Dominant) vs. Healthcare (Emerging)

The BFSI sector is recognized as the dominant player in the South Korea graph analytics market due to its extensive use of data to secure transactions and analyze customer behavior. This sector utilizes graph analytics to mitigate risks and enhance financial services, ensuring transactions are both efficient and secure. In contrast, the healthcare sector, while still emerging, is witnessing rapid adoption of graph analytics to improve patient care and operational efficiency. Hospitals and clinics are employing these tools for real-time data analysis, ultimately leading to enhanced service delivery. This shift in healthcare reflects a growing recognition of the power of data-driven insights, positioning it as a key area of growth for the future.

By Component: Software (Largest) vs. Services (Fastest-Growing)

In the South Korea graph analytics market, Software holds the largest share among component segments. Its widespread adoption across various industries showcases the critical role software plays in leveraging data insights for strategic decision-making. On the other hand, Services, though comprising a smaller portion of the market, are on a remarkable growth trajectory, with increasing demand from organizations looking for tailored analytics solutions to meet their evolving needs. The growth of Services within this segment is driven by a shift towards more customized and adaptive analytics frameworks. Companies are increasingly recognizing the value of expert support in implementing and optimizing graph analytics strategies. This trend is supported by the rise in complex data environments requiring advanced analytics capabilities, compelling service providers to expand their offerings and enhance their presence in the market.

Software (Dominant) vs. Services (Emerging)

Software serves as the dominant segment in the South Korea graph analytics market, characterized by robust capabilities for data visualization, integration, and analysis. Organizations benefit from a variety of software solutions that cater to their specific analytical needs, enabling a more nuanced understanding of their data landscapes. On the contrary, Services are emerging as a vital segment, focusing on consultancy, implementation, and support that enhance the utilization of software tools. Service providers are increasingly recognized for their expertise, playing a significant role in bridging the gap between raw data and actionable insights. Their offerings are becoming essential as companies strive for a competitive edge through advanced data analytics.

Get more detailed insights about South Korea Graph Analytics Market

Key Players and Competitive Insights

The graph analytics market in South Korea is characterized by a dynamic competitive landscape, driven by the increasing demand for data-driven decision-making and the growing complexity of data relationships. Major players such as Neo4j (US), Amazon Web Services (US), and Microsoft (US) are at the forefront, leveraging their technological prowess to enhance their offerings. Neo4j (US) focuses on innovation through continuous product development, particularly in enhancing its graph database capabilities, which positions it as a leader in the market. Meanwhile, Amazon Web Services (US) emphasizes regional expansion and partnerships, integrating graph analytics into its cloud services to provide comprehensive solutions for businesses. Microsoft (US) adopts a strategy centered on digital transformation, embedding graph analytics into its Azure platform, thereby enhancing its competitive edge in the cloud computing space.

The business tactics employed by these companies reflect a concerted effort to optimize their operations and adapt to local market needs. The competitive structure of the market appears moderately fragmented, with several key players vying for market share. This fragmentation is indicative of a landscape where innovation and customer-centric solutions are paramount, allowing companies to differentiate themselves through unique offerings and localized strategies.

In October 2025, Neo4j (US) announced a strategic partnership with a leading South Korean telecommunications company to enhance its graph database capabilities tailored for telecommunications applications. This collaboration is likely to bolster Neo4j's presence in the region, enabling it to tap into the growing demand for advanced analytics in the telecom sector. Such partnerships not only enhance product offerings but also facilitate deeper market penetration.

In September 2025, Amazon Web Services (US) launched a new suite of graph analytics tools specifically designed for the South Korean market, aimed at improving data integration and visualization for local enterprises. This move underscores AWS's commitment to providing tailored solutions that address the unique challenges faced by South Korean businesses, thereby strengthening its competitive position in the region.

In August 2025, Microsoft (US) unveiled enhancements to its Azure platform, incorporating advanced graph analytics features that leverage AI to provide predictive insights for businesses. This strategic enhancement is indicative of Microsoft's focus on integrating cutting-edge technology into its offerings, which may significantly improve customer engagement and satisfaction.

As of November 2025, the competitive trends in the graph analytics market are increasingly defined by digitalization, sustainability, and the integration of AI technologies. Strategic alliances among key players are shaping the landscape, fostering innovation and collaboration. The shift from price-based competition to a focus on technological advancement and supply chain reliability is evident, suggesting that future competitive differentiation will hinge on the ability to innovate and deliver robust, reliable solutions.

Industry Developments

In recent months, the South Korea Graph Analytics Market has experienced significant developments. Major companies such as Oracle and Google Cloud are expanding their offerings, focusing on enhanced data connectivity and advanced analytics capabilities, which are crucial for businesses leveraging big data. The market is seeing a rise in adoption across sectors, notably finance and healthcare, as organizations seek to establish robust data management frameworks. Notably, Neo4j announced partnerships in July 2023 aimed at integrating itssolutions with local enterprises to improve real-time data processing. 

In terms of mergers and acquisitions, TmaxSoft acquired a smaller analytics firm in March 2023 to strengthen its position in the market. Samsung SDS and LG CNS are also investing heavily in research and development to innovate their graph analytics services. Additionally, the South Korean government is pushing for advancements in artificial intelligence and data analytics through various initiatives launched in the last two years, ultimately impacting the market's growth trajectory. With the increasing demand for sophisticated data visualization and analysis tools among businesses, the graph analytics sector is poised for substantial growth in this tech-savvy region.

Future Outlook

South Korea Graph Analytics Market Future Outlook

the graph analytics market in South Korea is projected to grow at an 18.69% compound annual growth rate (CAGR) from 2024 to 2035., driven by increasing data complexity and demand for real-time insights.

New opportunities lie in:

  • Development of AI-driven graph analytics platforms for predictive modeling.
  • Integration of graph analytics in cybersecurity solutions to enhance threat detection.
  • Expansion of graph-based data visualization tools for improved decision-making.

By 2035, the market is expected to achieve substantial growth, positioning itself as a leader in data analytics.

Market Segmentation

South Korea Graph Analytics Market End User Outlook

  • BFSI
  • Retail
  • Telecommunications
  • Healthcare
  • Government

South Korea Graph Analytics Market Component Outlook

  • Software
  • Services

South Korea Graph Analytics Market Application Outlook

  • Fraud Detection
  • Social Network Analysis
  • Recommendation Systems
  • Risk Management
  • Knowledge Graphs

South Korea Graph Analytics Market Deployment Mode Outlook

  • On-Premises
  • Cloud-Based
  • Hybrid

Report Scope

MARKET SIZE 2024 100.73(USD Million)
MARKET SIZE 2025 119.56(USD Million)
MARKET SIZE 2035 663.3(USD Million)
COMPOUND ANNUAL GROWTH RATE (CAGR) 18.69% (2024 - 2035)
REPORT COVERAGE Revenue Forecast, Competitive Landscape, Growth Factors, and Trends
BASE YEAR 2024
Market Forecast Period 2025 - 2035
Historical Data 2019 - 2024
Market Forecast Units USD Million
Key Companies Profiled Neo4j (US), Amazon Web Services (US), Microsoft (US), IBM (US), Oracle (US), SAP (DE), TigerGraph (US), DataStax (US)
Segments Covered Application, Deployment Mode, End User, Component
Key Market Opportunities Integration of artificial intelligence in graph analytics enhances data insights and decision-making capabilities.
Key Market Dynamics Rising demand for real-time data insights drives innovation in the graph analytics market.
Countries Covered South Korea

Leave a Comment

FAQs

What is the expected market size of the South Korea Graph Analytics Market in 2024?

The South Korea Graph Analytics Market is expected to be valued at 141.75 million USD in 2024.

What is the projected market value for the South Korea Graph Analytics Market by 2035?

By 2035, the market is expected to reach a value of 706.15 million USD.

What is the expected compound annual growth rate (CAGR) for the South Korea Graph Analytics Market from 2025 to 2035?

The expected CAGR for the South Korea Graph Analytics Market from 2025 to 2035 is 15.717%.

Which application of graph analytics is expected to have the largest market size in 2035?

The Recommendation Systems application is projected to have the largest market size of 175 million USD in 2035.

What will be the market size for Fraud Detection in the South Korea Graph Analytics Market by 2035?

The market size for Fraud Detection is expected to reach 150 million USD by 2035.

Who are the key players in the South Korea Graph Analytics Market?

Major players include Oracle, Google Cloud, SAP, Neo4j, and IBM among others.

What is the estimated market value for Social Network Analysis in 2024?

The estimated market value for Social Network Analysis in 2024 is 25 million USD.

What is the market size for Risk Management in the South Korea Graph Analytics Market by 2035?

The market size for Risk Management is expected to grow to 100 million USD by 2035.

What opportunities exist in the South Korea Graph Analytics Market from 2025 to 2035?

There are significant growth opportunities driven by increasing demand for fraud detection and recommendation systems.

How does the South Korea Graph Analytics Market compare to global trends?

The South Korea Graph Analytics Market is expected to grow significantly, aligning with global trends towards data-driven analytics.

Download Free Sample

Kindly complete the form below to receive a free sample of this Report

Compare Licence

×
Features License Type
Single User Multiuser License Enterprise User
Price $4,950 $5,950 $7,250
Maximum User Access Limit 1 User Upto 10 Users Unrestricted Access Throughout the Organization
Free Customization
Direct Access to Analyst
Deliverable Format
Platform Access
Discount on Next Purchase 10% 15% 15%
Printable Versions