[email protected]   📞 +1 (855) 661-4441(US)   📞 +44 1720 412 167(UK)   📞 +91 2269738890(APAC)
Certified Global Research Member
Isomar 1 Iso 1
Key Questions Answered
  • Global Market Outlook
  • In-depth analysis of global and regional trends
  • Analyze and identify the major players in the market, their market share, key developments, etc.
  • To understand the capability of the major players based on products offered, financials, and strategies.
  • Identify disrupting products, companies, and trends.
  • To identify opportunities in the market.
  • Analyze the key challenges in the market.
  • Analyze the regional penetration of players, products, and services in the market.
  • Comparison of major players financial performance.
  • Evaluate strategies adopted by major players.
  • Recommendations
Why Choose Market Research Future?
  • Vigorous research methodologies for specific market.
  • Knowledge partners across the globe
  • Large network of partner consultants.
  • Ever-increasing/ Escalating data base with quarterly monitoring of various markets
  • Trusted by fortune 500 companies/startups/ universities/organizations
  • Large database of 5000+ markets reports.
  • Effective and prompt pre- and post-sales support.

Canada Graph Analytics Market Research Report By Application (Fraud Detection, Social Network Analysis, Recommendation Systems, Risk Management, Knowledge Graphs), By Deployment Mode (On-Premises, Cloud-Based, Hybrid), By End User (BFSI, Retail, Telecommunications, Healthcare, Government) and By Component (Software, Services)- Forecast to 2035


  • ID: MRFR/ICT/63475-HCR
  • | Pages: 200
  • | Author: Aarti Dhapte
  • | Publish Date: Sep 2025

Canada Graph Analytics Market Overview

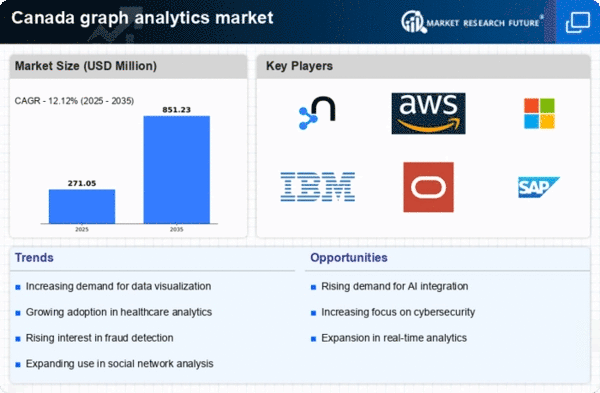
As per MRFR analysis, the Canada Graph Analytics Market Size was estimated at 205.8 (USD Million) in 2023.The Canada Graph Analytics Market is expected to grow from 243(USD Million) in 2024 to 1,459 (USD Million) by 2035. The Canada Graph Analytics Market CAGR (growth rate) is expected to be around 17.698% during the forecast period (2025 - 2035)

Key Canada Graph Analytics Market Trends Highlighted

Recently, there has been more and more interest in combining machine learning and artificial intelligence with graph analytics platforms. This trend makes it easier for businesses to work with complicated data relationships and get useful information quickly. Cloud computing is also making graph analytics tools easier for businesses of all sizes in Canada to use, which means they can take advantage of solutions that are both scalable and affordable. Investing in smart cities and infrastructure projects in Canada is creating opportunities in the graph analytics market. These projects can analyze large amounts of data from many sources to make better decisions and provide better services.

Additionally, the Canadian government is increasingly emphasizing data privacy and security, which presents a vital area for development among graph analytics solutions to maintain compliance and ensure trust. Overall, these market trends highlight a dynamic landscape where technology and necessity are driving rapid evolution and opportunity in Canada.

Canada Graph Analytics Market size

Source: Primary Research, Secondary Research, MRFR Database and Analyst Review

Canada Graph Analytics Market Drivers

Increase in Data Generation and Volume Discernment

The Canada Graph Analytics Market is projected to grow substantially owing to the exponential increase in data generation across various sectors, including healthcare, finance, and telecommunications. According to the Government of Canada, data generation is expected to reach 200 zettabytes globally by 2025, with organizations in Canada expected to heavily rely on advanced analytical methods, such as graph analytics, to interpret complex relationships inherent in big data.

Companies like IBM and SAP are already investing heavily in solutions that utilize graph analytics, indicating their increasing utility to manage data complexities. This rise in data complexity and volume provides a fertile ground for the expansion of graph analytics tools, positioning Canada as a hub for data innovation and management.

Growing Emphasis on Fraud Detection and Prevention

Fraud detection is becoming a critical area for various industries in Canada, particularly in financial services. Recent findings indicate that financial fraud in Canada is estimated at approximately $1.3 billion annually, prompting the need for more sophisticated systems. The Canada Graph Analytics Market is experiencing growth as graph analysis proves vital in detecting fraudulent patterns by mapping relationships and transactions across intricate networks.

Organizations such as the Royal Bank of Canada and TD Bank are actively integrating graph analytics into their fraud prevention measures, thereby mitigating risks and potential losses, which propels market growth in this segment.

Expansion of Artificial Intelligence and Machine Learning

The integration of Artificial Intelligence (AI) and Machine Learning (ML) into data analytics systems in Canada is accelerating the growth of the Canada Graph Analytics Market. The Canadian government has highlighted a commitment to AI development, with funding initiatives pertaining to AI technologies soaring to over CAD 1 billion in recent years.

Companies like Google AI and Microsoft are establishing AI research hubs in major Canadian cities, which in turn drives the need for graph analytics frameworks to process, analyze, and visualize complex datasets.This increasing push towards AI and ML technologies is likely to bolster the demand for sophisticated graph analytical tools that can accommodate the intricacies of AI-driven data analytics.

Canada Graph Analytics Market Segment Insights

Graph Analytics Market Application Insights

The Canada Graph Analytics Market is witnessing significant momentum, especially in the Application segment, which plays a pivotal role in various sectors such as finance, social media, and e-commerce. This segment includes areas like Fraud Detection, Social Network Analysis, Recommendation Systems, Risk Management, and Knowledge Graphs, each contributing uniquely to market growth and fostering innovation. Fraud Detection applications leverage graph analytics to identify unusual patterns and behaviors, thus effectively addressing challenges related to financial crime and security threats, keeping organizations one step ahead of fraudsters.Social Network Analysis has gained importance in understanding user interactions and relationships, enabling businesses to foster better customer engagement and enhance brand loyalty.

Meanwhile, Recommendation Systems are transforming consumer experiences by utilizing graph data to provide tailored suggestions, a feature that has become crucial for e-commerce platforms looking to optimize user engagement and sales. Risk Management benefits from graph analytics by providing insights into potential risks and vulnerabilities, allowing businesses to mitigate challenges proactively and maintain operational resilience.Knowledge Graphs are emerging as essential tools, enabling organizations to organize complex data relationships, thus facilitating enhanced decision-making and insights for strategic planning. As the technology continues to evolve, industries across Canada are increasingly adopting graph analytics, driven by the need for data-driven insights, improved operational efficiency, and enhanced customer experiences. The growth of digital business initiatives and the demand for more sophisticated analytical tools further bolsters the Application segment, showcasing its vital role in the broader context of the Canada Graph Analytics Market.Organizations in Canada are recognizing the value of these applications, optimizing their resources, and improving service delivery as they navigate the complexities of today’s data-driven landscape.

Additionally, the rising awareness around data privacy and cybersecurity is pushing businesses to implement robust measures facilitated by graph analytics, emphasizing the financial sector's reliance on these tools to safeguard customer information and maintain regulatory compliance. The potential for integration with artificial intelligence and machine learning technologies is another driving force, promising enhanced capabilities for predictive analytics and real-time insights across various applications.Thus, the Application segment of the Canada Graph Analytics Market reveals a vibrant ecosystem where diverse use cases intersect to create significant value for organizations looking to harness the power of data effectively.

Canada Graph Analytics Market Segment

Source: Primary Research, Secondary Research, MRFR Database and Analyst Review

Graph Analytics Market Deployment Mode Insights

The Canada Graph Analytics Market, particularly in the Deployment Mode segment, has been experiencing notable growth and evolution. This segment is primarily divided into On-Premises, Cloud-Based, and Hybrid solutions, each catering to the varied needs of Canadian businesses. On-Premises deployment allows organizations to maintain control over their data and software environments, making it attractive for industries with stringent data security requirements, such as finance and healthcare. Cloud-Based solutions have gained significant traction due to their scalability and cost-effectiveness, enabling smaller businesses to leverage advanced analytics without heavy upfront investments.

Lastly, Hybrid solutions are becoming increasingly popular, as they offer the flexibility of both on-site and cloud resources, allowing organizations to control sensitive data while capitalizing on cloud processing capabilities. The overarching trend in Canada is the shift towards more agile and scalable analytics solutions driven by increased data generation and the necessity for real-time insights, thus aligning with the evolving digital landscape of the country. Furthermore, as Canadian industries focus on modernization and digital transformation, these deployment modes are set to play a crucial role in advancing the capabilities and efficiency of graph analytics implementations across sectors.

Graph Analytics Market End User Insights

The Canada Graph Analytics Market showcases a diverse array of end users, including Banking, Financial Services, and Insurance (BFSI), Retail, Telecommunications, Healthcare, and Government sectors. Each of these areas leverages graph analytics to enhance operational efficiency and improve decision-making processes. In the BFSI sector, graph analytics plays a crucial role in fraud detection and risk management, allowing organizations to visualize complex relationships among data points and transactions, thereby safeguarding assets. The Retail industry utilizes graph analytics to enhance customer experience and optimize supply chain management by analyzing consumer behavior and preferences in real-time.

In Telecommunications, graph analytics aids in network optimization and customer churn analysis, enabling service providers to maintain a competitive advantage in a saturated market. The Healthcare sector uses graph analytics for patient care improvement, streamlining patient data management, and predicting health outcomes by analyzing relationships in patient data. Lastly, the Government sector benefits from graph analytics through improved public safety initiatives, resource allocation, and urban planning efforts that depend on data interconnectivity and analysis.As Canada continues to advance its digital strategy, the uptake of graph analytics across these sectors indicates a strong trajectory towards data-driven decision-making.

Graph Analytics Market Component Insights

The Canada Graph Analytics Market focuses on various components, which are critical to the overall functionality and application of graph analytics. One of the major components is software, which plays a vital role in facilitating data visualization, pattern recognition, and relationship mapping, thus empowering organizations to make data-driven decisions. The software segment is characterized by continuous advancements, with a growing emphasis on artificial intelligence and machine learning integration, enhancing its capabilities and responsiveness.Services also represent a significant aspect of the market, comprising consulting, implementation, and support services that enable businesses to effectively leverage graph analytics tools.

This segment ensures that organizations are not only equipped with the right technologies but are also supported throughout their analytics journey. The combination of software and services drives innovation in the Canada Graph Analytics Market, providing tailored solutions that meet diverse industry needs. As more Canadian enterprises recognize the value of graph analytics for improving business operations and customer insights, these components are set to play an increasingly prominent role in achieving competitive advantages.

Canada Graph Analytics Market Key Players and Competitive Insights

The Canada Graph Analytics Market has seen significant growth in recent years, driven by the increasing demand for data analysis solutions that enhance decision-making processes across various industries. Companies operating in this market are leveraging advanced analytics technologies to provide insights from complex data sets, allowing enterprises to identify relationships and patterns that would otherwise remain hidden. As organizations continue to recognize the value of data-driven strategies, the competitive landscape has intensified, with numerous players vying for market share. The involvement of established technology firms, along with new entrants focusing on innovative solutions, has created a dynamic environment where staying ahead of the competition is crucial. Factors such as technological advancements, customer-centric services, and adaptive marketing strategies have become essential for success in the rapidly evolving landscape of graph analytics in Canada.

In the realm of the Canada Graph Analytics Market, Oracle stands out as a formidable player, principally due to its well-established presence and comprehensive suite of offerings. Oracle is recognized for its robust graph database solutions that integrate seamlessly with its existing platform, empowering organizations to perform complex queries and analyses efficiently. The strengths of Oracle lie in its vast experience, strong brand reputation, and an extensive network of existing clients across various sectors. Their focus on enhancing user experience with intuitive interfaces and advanced functionalities has earned them a significant market share. Additionally, Oracle's commitment to continuous innovation through regular software updates and enhancements ensures that they adapt to the evolving needs of their customers, solidifying their position as a leader in the graph analytics domain.Coriant, while perhaps less prominent than some other players, has carved a niche in the Canada Graph Analytics Market through its specialized focus on high-performance bandwidth solutions and network management tools.

The company offers an array of key products and services designed to meet the demands of data-intensive applications, making them integral to the graph analytics landscape in Canada. Strengths of Coriant include its adaptability and a solid portfolio that features advanced networking technologies, which can be harnessed for efficient data analysis. Coriant has engaged in strategic partnerships and collaborations, enhancing its capabilities and offerings in the Canadian market. While specific mergers and acquisitions may be limited, the company's willingness to integrate with other technological entities to enhance its service portfolio speaks to its strategic vision. Coriant's focused approach to branding and distribution has enabled it to create lasting relationships with clients, making it a reliable choice for businesses seeking graph analytics solutions in Canada.

Key Companies in the Canada Graph Analytics Market Include

  • Oracle
  • Coriant
  • TigerGraph
  • Google
  • Lucidworks
  • STMicroelectronics
  • Qlik
  • SAP
  • IBM
  • Alteryx
  • DataStax
  • Neo4j
  • Teradata
  • Microsoft
  • Amazon Web Services

Canada Graph Analytics Market Developments

The Canada Graph Analytics Market has witnessed notable developments with companies like Oracle, IBM, and Microsoft increasingly leveraging advanced analytics to enhance their offerings. In September 2023, Oracle announced a significant enhancement to its graph analytics services, focusing on improved data visualization and query performance, which addresses the growing demand for real-time analytics in various sectors. Furthermore, in October 2023, IBM launched new tools aimed at integrating Graph Analytics into its broader AI strategy, which is pivotal for enterprises seeking more sophisticated data management solutions.

The market is also experiencing solid growth, with projections indicating a compound annual growth rate of approximately 20% from 2023 to 2028, driven by heightened investments in data-driven decision-making. Companies such as Neo4j and DataStax continue to expand their presence in Canada, catering to the increasing need for relational data management systems. Notably, in August 2023, Qlik reported partnerships with various local enterprises to integrate its visualization tools in government projects, enhancing public sector data transparency. This momentum reflects the vital role that graph analytics plays in shaping smart cities and improving governmental efficiency in Canada.

Canada Graph Analytics Market Segmentation Insights

Graph Analytics Market Application Outlook

    • Fraud Detection
    • Social Network Analysis
    • Recommendation Systems
    • Risk Management
    • Knowledge Graphs

Graph Analytics Market Deployment Mode Outlook

    • On-Premises
    • Cloud-Based
    • Hybrid

Graph Analytics Market End User Outlook

    • BFSI
    • Retail
    • Telecommunications
    • Healthcare
    • Government

Graph Analytics Market Component Outlook

    • Software
    • Services
 
Report Attribute/Metric Source: Details
MARKET SIZE 2023 205.8(USD Million)
MARKET SIZE 2024 243.0(USD Million)
MARKET SIZE 2035 1459.0(USD Million)
COMPOUND ANNUAL GROWTH RATE (CAGR) 17.698% (2025 - 2035)
REPORT COVERAGE Revenue Forecast, Competitive Landscape, Growth Factors, and Trends
BASE YEAR 2024
MARKET FORECAST PERIOD 2025 - 2035
HISTORICAL DATA 2019 - 2024
MARKET FORECAST UNITS USD Million
KEY COMPANIES PROFILED Oracle, Coriant, TigerGraph, Google, Lucidworks, STMicroelectronics, Qlik, SAP, IBM, Alteryx, DataStax, Neo4j, Teradata, Microsoft, Amazon Web Services
SEGMENTS COVERED Application, Deployment Mode, End User, Component
KEY MARKET OPPORTUNITIES Rising demand for social network analysis, Enhanced fraud detection capabilities, Growth in customer journey mapping, Increasing adoption of IoT data, Integration with AI and machine learning
KEY MARKET DYNAMICS increasing data complexity, rising demand for insights, growing adoption of AI, expanding use cases across industries, need for real-time analytics
COUNTRIES COVERED Canada


Frequently Asked Questions (FAQ):

The Canada Graph Analytics Market is expected to be valued at 243.0 USD Million in 2024.

By 2035, the market value is anticipated to reach 1459.0 USD Million.

The expected CAGR for the market during this period is 17.698%.

The Recommendation Systems segment is projected to grow to 300.0 USD Million by 2035.

The Fraud Detection application is valued at 40.0 USD Million in 2024.

Major players include Oracle, Google, IBM, Amazon Web Services, and Microsoft.

The Knowledge Graphs segment is expected to be valued at 484.0 USD Million by 2035.

The market value for the Social Network Analysis application is 30.0 USD Million in 2024.

The Risk Management application is expected to reach 250.0 USD Million by 2035.

Key trends include advancements in AI and an increasing demand for data-driven decision-making.

Comments

Leading companies partner with us for data-driven Insights.

clients

Kindly complete the form below to receive a free sample of this Report

We do not share your information with anyone. However, we may send you emails based on your report interest from time to time. You may contact us at any time to opt-out.

Tailored for You
  • Dedicated Research on any specifics segment or region.
  • Focused Research on specific players in the market.
  • Custom Report based only on your requirements.
  • Flexibility to add or subtract any chapter in the study.
  • Historic data from 2014 and forecasts outlook till 2040.
  • Flexibility of providing data/insights in formats (PDF, PPT, Excel).
  • Provide cross segmentation in applicable scenario/markets.
report-img