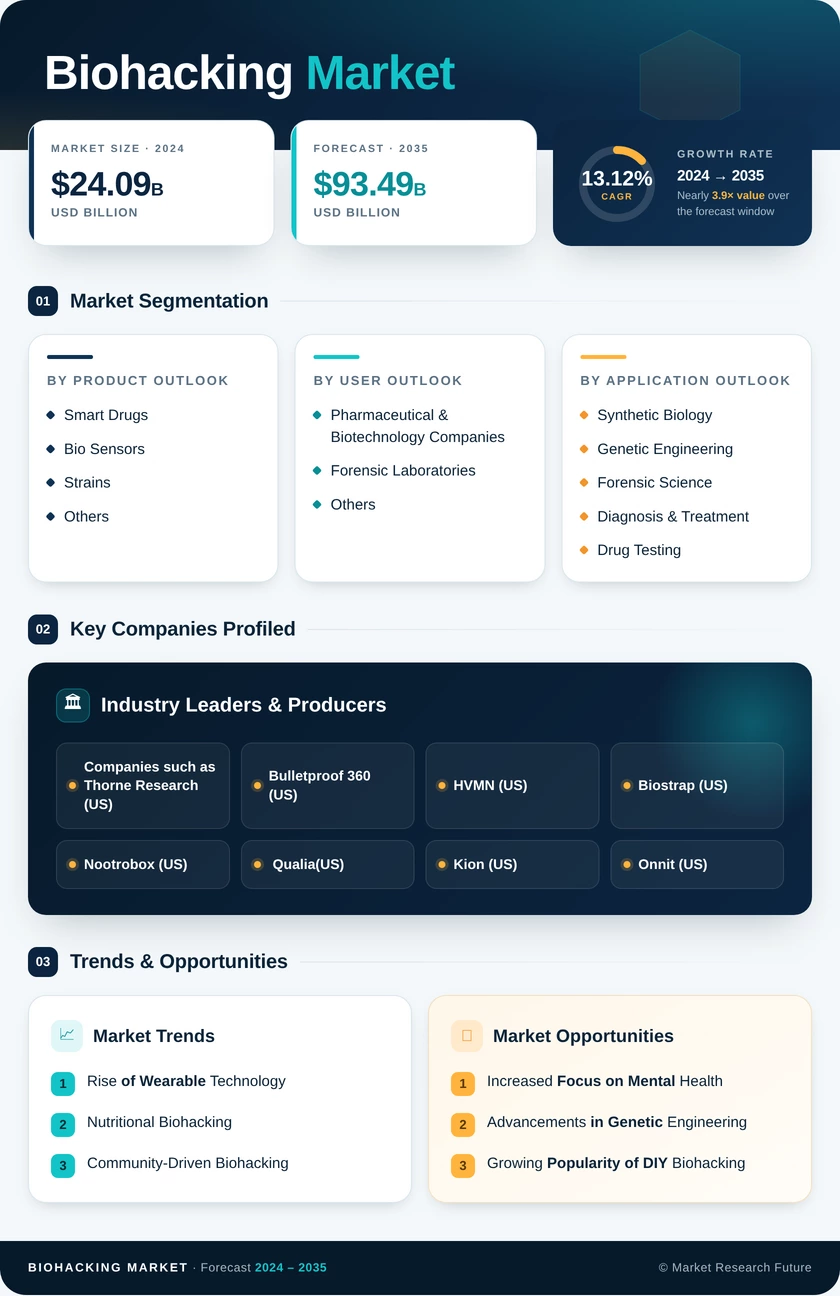
Biohacking Market (2026 - 2035)

ID: MRFR/HCIT/3719-CR 157 Pages Vikita Thakur Last Updated: September 15, 2026
Biohacking Market Research Report Information By Product (Smart Drugs, Sensors, Strains, and Others), By Application (Synthetic Biology, Genetic Engineering, Forensic Science, Diagnosis & Treatment, and Drug Testing), By End Users (Pharmaceutical & Biotechnology Companies, Forensic Laboratories, and Others), and By Region (North America, Europe, Asia-Pacific, and Rest of the World) - Growth & Industry Forecast 2025 To 2035
Biohacking Market
Market Size
Forecast Period2026-2035
CAGR (2026-2035)16.4%
Key Players
Apple Inc.
Abbott Laboratories
Dexcom, Inc.
Garmin Ltd.
Samsung Electronics
Google LLC
Opportunities
  • Metabolic Monitoring Beyond Diabetes
  • Longevity Clinics as Enterprise Channel
  • Emerging-Market Nutraceutical Localization
  1. 1 Market Overview |
    1. 1.1 Study Assumptions & Market Definition |
    2. 1.2 Scope of the Study |
    3. 1.3 Research Methodology
  2. 2 Market Summary & Key Report Takeaways
  3. 3 Global Market Size & Forecast (2021–2035) |
    1. 3.1 Historical Market Size (2021–2025) |
    2. 3.2 Current & Forecast Market Size (2026–2035) |
    3. 3.3 Year-over-Year Growth Analysis
  4. 4 Market Dynamics — Drivers |
    1. 4.1 Biosensor Cost Deflation |
    2. 4.2 AI-Driven Closed-Loop Coaching |
    3. 4.3 Employer Biometric Wellness Programs |
    4. 4.4 Genomic Price Collapse
  5. 5 Market Dynamics — Restraints |
    1. 5.1 Regulatory Ambiguity on Self-Administered Gene Editing |
    2. 5.2 Biometric Data Privacy Enforcement |
    3. 5.3 Evidence Gaps in Cognitive Supplementation
  6. 6 Market Opportunity Analysis |
    1. 6.1 Metabolic Monitoring Beyond Diabetes |
    2. 6.2 Longevity Clinics as Enterprise Channel |
    3. 6.3 Emerging-Market Nutraceutical Localization |
    4. 6.4 Longitudinal Data Monetization |
    5. 6.5 Corporate Metabolic Health Contracts |
    6. 6.6 Industry Value Chain Analysis |
    7. 6.7 Porter's Five Forces Analysis
  7. 7 Regional Analysis |
    1. 7.1 North America | |
      1. 7.1.1 US | |
      2. 7.1.2 Canada | |
      3. 7.1.3 Mexico |
    2. 7.2 Europe | |
      1. 7.2.1 Germany | |
      2. 7.2.2 UK | |
      3. 7.2.3 France | |
      4. 7.2.4 Italy | |
      5. 7.2.5 Spain | |
      6. 7.2.6 Nordic Countries | |
      7. 7.2.7 Russia | |
      8. 7.2.8 Rest of Europe |
    3. 7.3 Asia-Pacific | |
      1. 7.3.1 China | |
      2. 7.3.2 India | |
      3. 7.3.3 Japan | |
      4. 7.3.4 South Korea | |
      5. 7.3.5 ASEAN | |
      6. 7.3.6 Rest of Asia-Pacific |
    4. 7.4 South America | |
      1. 7.4.1 Brazil | |
      2. 7.4.2 Argentina | |
      3. 7.4.3 Rest of South America |
    5. 7.5 Middle East & Africa | |
      1. 7.5.1 Saudi Arabia | |
      2. 7.5.2 UAE | |
      3. 7.5.3 South Africa | |
      4. 7.5.4 Egypt | |
      5. 7.5.5 Rest of Middle East & Africa
  8. 8 Future Outlook (2026–2035) |
    1. 8.1 From Measurement to Intervention |
    2. 8.2 Platform Economics and Subscription Consolidation |
    3. 8.3 Regulatory Convergence |
    4. 8.4 Longevity Science Commercialization
  9. 9 Segmentation Analysis |
    1. 9.1 By Product Type | |
      1. 9.1.1 Wearable Devices | |
      2. 9.1.2 Smart Implants | |
      3. 9.1.3 Gene-Editing Kits | |
      4. 9.1.4 Nootropics & Supplements | |
      5. 9.1.5 Sensors & Biomonitoring Patches | |
      6. 9.1.6 Others |
    2. 9.2 By Biohacking Type | |
      1. 9.2.1 Nutrigenomics | |
      2. 9.2.2 DIY Biology | |
      3. 9.2.3 Grinder | |
      4. 9.2.4 Others |
    3. 9.3 By End User | |
      1. 9.3.1 Consumers | |
      2. 9.3.2 Healthcare Facilities | |
      3. 9.3.3 Research & Academic Institutes | |
      4. 9.3.4 Others
  10. 10 Competitive Landscape |
    1. 10.1 Market Share Analysis (2026) |
    2. 10.2 Competitive Benchmarking Matrix |
    3. 10.3 Company Profiles | |
      1. 10.3.1 Apple Inc. | |
      2. 10.3.2 Abbott Laboratories | |
      3. 10.3.3 Dexcom, Inc. | |
      4. 10.3.4 Garmin Ltd. | |
      5. 10.3.5 Samsung Electronics | |
      6. 10.3.6 Google LLC (Fitbit) | |
      7. 10.3.7 Ōura Health Oy | |
      8. 10.3.8 WHOOP, Inc. | |
      9. 10.3.9 Thorne HealthTech | |
      10. 10.3.10 Viome Life Sciences | |
      11. 10.3.11 Synchron Inc. | |
      12. 10.3.12 The ODIN
  11. 11 Recent Developments & News
  12. 12 Report Scope & Methodology |
    1. 12.1 Study Period & Base Year |
    2. 12.2 Data Sources & Citations |
    3. 12.3 Abbreviations
  13. 13 Detailed Sources and Citations
  14. 14 Frequently Asked Questions
  15. 15 LIST OF TABLES |
  16. TABLE 1 Global Biohacking Market Size & Forecast, by Revenue (USD Billion), 2021–2035 |
  17. TABLE 2 Global Biohacking Market – Year-over-Year Growth Analysis, 2021–2035 |
  18. TABLE 3 Driver Impact Matrix – Global Biohacking Market, 2026–2035 |
  19. TABLE 4 Restraint Impact Matrix – Global Biohacking Market, 2026–2035 |
  20. TABLE 5 Global Biohacking Market Size, by Product Type, 2021–2035 (USD Billion) |
  21. TABLE 6 Global Biohacking Market Size, by Biohacking Type, 2021–2035 (USD Billion) |
  22. TABLE 7 Global Biohacking Market Size, by End User, 2021–2035 (USD Billion) |
  23. TABLE 8 Global Biohacking Market Size, by Region, 2021–2035 (USD Billion) |
  24. TABLE 9 North America Biohacking Market Size, by Country, 2021–2035 (USD Billion) |
  25. TABLE 10 Europe Biohacking Market Size, by Country, 2021–2035 (USD Billion) |
  26. TABLE 11 Asia-Pacific Biohacking Market Size, by Country, 2021–2035 (USD Billion) |
  27. TABLE 12 South America Biohacking Market Size, by Country, 2021–2035 (USD Billion) |
  28. TABLE 13 Middle East & Africa Biohacking Market Size, by Country, 2021–2035 (USD Billion) |
  29. TABLE 14 North America Biohacking Market Size, by Product Type, 2021–2035 (USD Billion) |
  30. TABLE 15 North America Biohacking Market Size, by Biohacking Type, 2021–2035 (USD Billion) |
  31. TABLE 16 North America Biohacking Market Size, by End User, 2021–2035 (USD Billion) |
  32. TABLE 17 Europe Biohacking Market Size, by Product Type, 2021–2035 (USD Billion) |
  33. TABLE 18 Europe Biohacking Market Size, by Biohacking Type, 2021–2035 (USD Billion) |
  34. TABLE 19 Europe Biohacking Market Size, by End User, 2021–2035 (USD Billion) |
  35. TABLE 20 Asia-Pacific Biohacking Market Size, by Product Type, 2021–2035 (USD Billion) |
  36. TABLE 21 Asia-Pacific Biohacking Market Size, by Biohacking Type, 2021–2035 (USD Billion) |
  37. TABLE 22 Asia-Pacific Biohacking Market Size, by End User, 2021–2035 (USD Billion) |
  38. TABLE 23 South America Biohacking Market Size, by Product Type, 2021–2035 (USD Billion) |
  39. TABLE 24 South America Biohacking Market Size, by End User, 2021–2035 (USD Billion) |
  40. TABLE 25 Middle East & Africa Biohacking Market Size, by Product Type, 2021–2035 (USD Billion) |
  41. TABLE 26 Middle East & Africa Biohacking Market Size, by End User, 2021–2035 (USD Billion) |
  42. TABLE 27 US Biohacking Market Size, by Product Type, 2021–2035 (USD Billion) |
  43. TABLE 28 China Biohacking Market Size, by Product Type, 2021–2035 (USD Billion) |
  44. TABLE 29 India Biohacking Market Size, by Product Type, 2021–2035 (USD Billion) |
  45. TABLE 30 Germany Biohacking Market Size, by Product Type, 2021–2035 (USD Billion) |
  46. TABLE 31 Japan Biohacking Market Size, by End User, 2021–2035 (USD Billion) |
  47. TABLE 32 Competitive Benchmarking Matrix – Global Biohacking Market, 2026 |
  48. TABLE 33 Company Profiles – Key Players, Global Biohacking Market |
  49. TABLE 34 Recent Developments & Strategic Announcements, 2023–2025 |
  50. TABLE 35 Report Scope & Methodology Summary |
  51. TABLE 36 Detailed Sources and Citations Index
  52. 16 LIST OF FIGURES |
  53. FIGURE 1 Global Biohacking Market Dynamics – Drivers, Restraints, Opportunities |
  54. FIGURE 2 Industry Value Chain Analysis – Biohacking Market |
  55. FIGURE 3 Porter's Five Forces Analysis – Biohacking Market |
  56. FIGURE 4 Global Market Size Trend, 2021–2035 (USD Billion) |
  57. FIGURE 5 Year-over-Year Growth Trajectory, 2022–2035 (%) |
  58. FIGURE 6 Market Share by Product Type, 2025 vs 2035 (%) |
  59. FIGURE 7 Market Share by Biohacking Type, 2025 vs 2035 (%) |
  60. FIGURE 8 Market Share by End User, 2025 vs 2035 (%) |
  61. FIGURE 9 Regional Revenue Share Distribution, 2025 (%) |
  62. FIGURE 10 Regional CAGR Comparison, 2026–2035 (%) |
  63. FIGURE 11 North America Country Share Breakdown, 2025 (%) |
  64. FIGURE 12 Europe Country Share Breakdown, 2025 (%) |
  65. FIGURE 13 Asia-Pacific Country Share Breakdown, 2025 (%) |
  66. FIGURE 14 Competitive Landscape – Estimated Revenue Share Ranges, 2026 |
  67. FIGURE 15 Competitive Positioning Quadrant – Scale vs Innovation Intensity |
  68. FIGURE 16 Pricing Trend Analysis – Biosensors and Genomic Panels, 2021–2035

Segmentation Quick Reference

DimensionSub-SegmentsDominant SegmentFastest Growing Segment
By Product TypeWearable Devices; Smart Implants; Gene-Editing Kits; Nootropics & Supplements; Sensors & Biomonitoring Patches; OthersWearable DevicesGene-Editing Kits
By Biohacking TypeNutrigenomics; DIY Biology; Grinder; OthersNutrigenomicsDIY Biology
By End UserConsumers; Healthcare Facilities; Research & Academic Institutes; OthersConsumersResearch & Academic Institutes
By GeographyNorth America; Europe; Asia-Pacific; South America; Middle East & AfricaNorth AmericaAsia-Pacific


Market Segmentation Overview

By Product Type

Sub-SegmentKey Trend
Wearable DevicesSensor fusion moving from step counting to metabolic and cardiovascular inference.
Smart ImplantsNFC and payment implants normalizing; neural interface pilots entering trials
Gene-Editing KitsReagent deflation making educational CRISPR workflows broadly affordable.
Nootropics & SupplementsClaim substantiation pressure driving consolidation toward evidence-led brands.
Sensors & Biomonitoring PatchesOver-the-counter clearance unlocking non-clinical metabolic monitoring
OthersPhotobiomodulation and thermal exposure hardware entering mainstream retail


Product mix is shifting from general-purpose wearables toward analyte-specific sensing. Vendors that convert sensor hardware into consumable-plus-subscription revenue are protecting margin as device ASPs decline; those selling standalone hardware are not.

By Biohacking Type

Sub-SegmentKey Trend
NutrigenomicsGenotype-guided supplementation moving from boutique to mass retail
DIY BiologyCommunity laboratory networks expanding alongside cheap reagents
GrinderImplantable augmentation constrained by jurisdictional legal ambiguity
OthersStructured fasting, cold and heat exposure, and sleep engineering protocols scaling


Practice-level segmentation increasingly tracks evidence quality. Nutrigenomics benefits from peer-reviewed grounding and clinician acceptance, while grinder-oriented augmentation remains a small, highly visible niche whose growth depends on legal clarity rather than technical capability.

By End User

Sub-SegmentKey Trend
ConsumersDirect-to-consumer acquisition costs rising, pushing brands toward retail partnerships
Healthcare FacilitiesLongevity and preventive clinics adopting biometric panels as a service line
Research & Academic InstitutesDemand for longitudinal real-world cohorts driving instrument procurement
OthersCorporate wellness and professional sports organizations expanding contracted deployments


Institutional adoption is the quiet growth engine. Contract values with healthcare facilities and research institutions dwarf per-user consumer revenue, and renewal behavior is far more predictable, which is why several consumer-first brands are now building dedicated enterprise sales organizations.

By Geography

Sub-SegmentKey Trend
North AmericaOver-the-counter biosensor clearances redefining retail category economics
EuropePrivacy-native architecture emerging as a commercial differentiator
Asia-PacificCo-located manufacturing and domestic demand compounding growth
South AmericaRegistration reform shortening time-to-shelf for supplements
Middle East & AfricaSovereign preventive-health programs funding platform procurement


Regional strategy now diverges sharply. Western vendors compete on evidence and data governance; Asian participants compete on cost and speed to shelf. Firms attempting a single global playbook consistently underperform those that localize formulation, pricing, and consent architecture by market.

You’ve used 75% of your weekly limit

Download PDF ×

We do not share your information with anyone. However, we may send you emails based on your report interest from time to time. You may contact us at any time to opt-out.