ID: MRFR/A&D/2297-HCR | February 2021 | Region: Global | 110 pages
Market Scenario
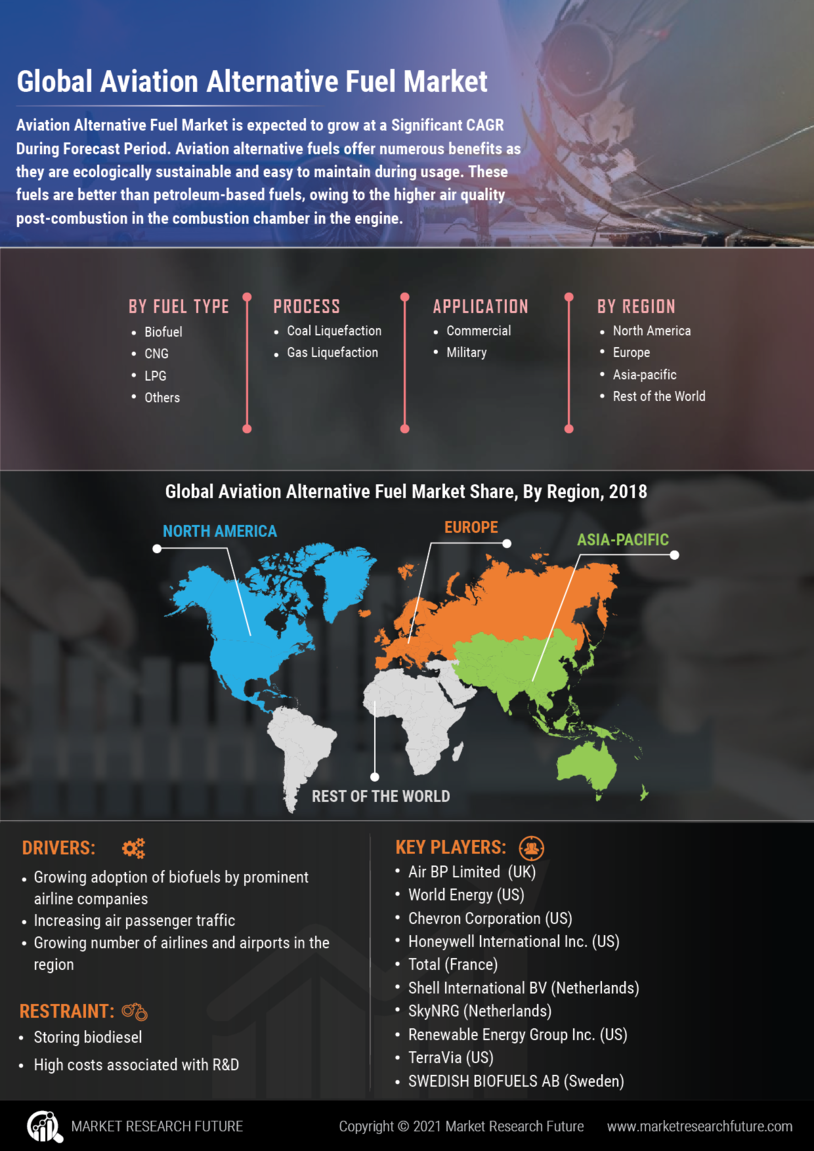
Aviation alternative fuels offer numerous benefits as they are ecologically sustainable and easy to maintain during usage. These fuels are better than petroleum-based fuels, owing to the higher air quality post-combustion in the combustion chamber in the engine. Advanced biofuels are strong competitors for replacing petroleum-based aviation fuels in the near future, as these fuels are equally safe while offering better performance. Furthermore, the growing adoption of biofuels by prominent airline companies, including United Airlines, is also expected to drive the market growth. For example, in May 2019, World Energy was awarded a contract by United Airlines to provide nearly 10 million gallons of aviation biofuel over the next two years.
Factors such as growing concerns about environmental protection and global warming are driving the aviation alternative fuels market. However, issues related to storing biodiesel and high costs associated with R&D might hamper the growth of the market.
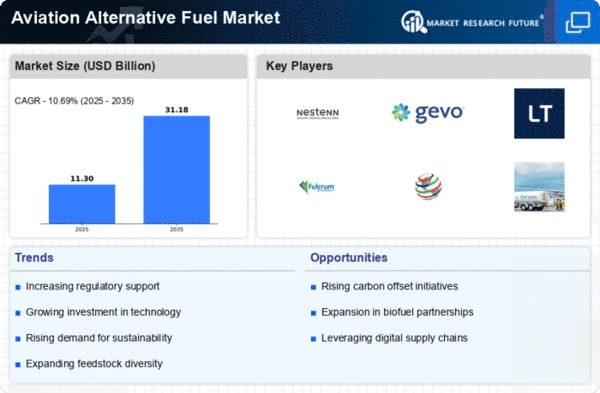
Hence, the global aviation alternative fuel market is projected to grow at approximately 10% CAGR during the forecast period.
Segmentation of the Global Aviation Alternative Fuel Market
By fuel type, the global aviation alternative fuel market comprises biofuel, CNG, LPG, and others. The biofuel segment has been subdivided into hydroprocessed esters and fatty acids (HEFA), hydrogenated pyrolysis oils (HPO), Fischer-Tropsch (FT), and synthesized iso-paraffinic (SIP). The biofuel segment dominated the market in 2018 and is expected to grow at the highest CAGR during the forecast period. Biofuel is produced directly or indirectly from organic material known as biomass, which comprises plant materials and animal waste. The use of biofuel in commercial aircraft started in 2011 with the intent to reduce the carbon footprint and provide cost-effective solutions. Therefore, the segment is expected to witness the highest growth during the forecast period.
Based on application, the global market has been divided into commercial and military. The commercial segment dominated the market in 2018 and is expected to grow at a higher CAGR during the forecast period, 2019–2025. Increasing air passenger traffic is expected to drive the growth of the segment.
Based on the process, the global market has been divided into coal liquefaction and gas liquefaction. The coal liquefaction segment dominated the market in 2018. However, the gas liquefaction segment is expected to register higher growth during the forecast period, 2019–2025. Aviation alternative fuels derived by gas liquefaction process offer benefits such as low operating costs and reduced harmful exhaust gas emissions. Hence, the segment is expected to register a higher CAGR during the forecast period.
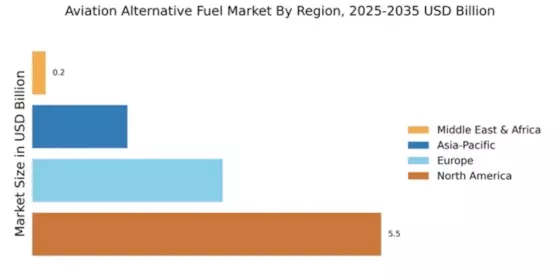
Based on the region, the market has been categorized as North America, Europe, Asia-Pacific, Middle East & Africa, and Latin America. North America led the market in 2018. However, Asia-Pacific is expected to grow at the highest CAGR during the forecast period. Factors such as increasing air passenger traffic in countries such as China and India and the growing number of airlines and airports in the region are expected to drive the market growth in the region.
Key Players
The key players in the global aviation alternative fuel market are Air BP Limited (UK), World Energy (US), Chevron Corporation (US), Honeywell International Inc. (US), Total (France), Shell International BV (Netherlands), SkyNRG (Netherlands), Renewable Energy Group, Inc. (US), TerraVia (US), SWEDISH BIOFUELS AB (Sweden), NXT Fuels Limited (New Zealand), Fulcrum BioEnergy (US), Neste Oyj (Finland), Red Rock Biofuels (US), Gevo Inc. (US), SG Preston Company (US), and LanzaTech (US).
Research Methodology
The market values and forecasts are derived using MRFR research methodology, which includes secondary research, primary interviews, data triangulation, and validation from an in-house data repository and statistical modeling tools.
In this process, data is collected from various secondary sources, including annual reports, SEC filings, journals, government associations, aerospace & defense magazines, white papers, corporate presentations, company websites, and paid databases.
In this process, both the demand- and supply-side parties are interviewed to extract facts and insights into the market forecast, production, trends, and projected market growth. Industry stakeholders such as CEOs, VPs, directors, and marketing executives across the value chain are approached to obtain key information.
Key Insights
Report Customization
MRFR offers report customization to valued customers. Below are the options available for customization:
In-depth profiling of additional market players (3 to 4 companies)
Detailed analysis of a country-level market and related segments as per the report scope (subject to data availability)
Intended Audience
Frequently Asked Questions (FAQ) :
By 2025, a 10% CAGR is estimated to be seen in the market.
TerraVia (U.S.), NXT Fuels Limited (New Zealand), and SWEDISH BIOFUELS AB (Sweden) are prominent companies in the market.
An advantageous revenue level is predicted for the market in the forecast period.
The mounting use of biofuels by significant airlines is estimated to stimulate the market.
The region of North America is estimated to have a sizeable stake in market development.
Table of Contents
1. Executive Summary
1.1. Market Attractiveness Analysis
1.1.1. Global Aviation Alternative Fuel Market, by Process
1.1.2. Global Aviation Alternative Fuel Market, by Fuel Type
1.1.3. Global Aviation Alternative Fuel Market, by Application
1.1.4. Global Aviation Alternative Fuel Market, by Region
2. Market Introduction
2.1. Market Definition
2.2. Scope of the Study
2.3. Market Structure
2.4. Key Buying Criteria
2.5. Market Factor Indicator Analysis
3. Research Methodology
3.1. Research Process
3.2. Primary Research
3.3. Secondary Research
3.4. Market Size Estimation
3.5. Forecast Model
3.6. List of Assumptions
4. Market Insights
5. Market Dynamics
5.1. Introduction
5.2. Drivers
5.3. Restraints
5.4. Opportunities
5.5. Challenges
5.6. Market/Technological Trends
5.7. Patent Trends
5.8. Regulatory Landscape/Standards
6. Market Factor Analysis
6.1. Value Chain/Supply Chain Analysis
6.1.1. R&D
6.1.2. Manufacturing
6.1.3. Distribution & Sales
6.1.4. Post-Sales Monitoring
6.2. Porter’s Five Forces Analysis
6.2.1. Threat of New Entrants
6.2.2. Bargaining Power of Buyers
6.2.3. Threat of Substitutes
6.2.4. Intensity of Rivalry
6.2.5. Bargaining Power of Suppliers
7. Global Aviation Alternative Fuel Market, by Process
7.1. Introduction
7.2. Coal Liquefaction
7.2.1. Market Estimates & Forecast, 2019–2025
7.2.2. Market Estimates & Forecast, by Region, 2019–2025
7.3. Gas Liquefaction
7.3.1. Market Estimates & Forecast, 2019–2025
7.3.2. Market Estimates & Forecast, by Region, 2019–2025
8. Global Aviation Alternative Fuel Market, by Fuel Type
8.1. Introduction
8.2. Biofuel
8.2.1. Market Estimates & Forecast, 2019–2025
8.2.2. Market Estimates & Forecast, by Region, 2019–2025
8.2.3. Hydroprocessed Esters and Fatty Acids (HEFA)
8.2.3.1. Market Estimates & Forecast, 2019–2025
8.2.3.2. Market Estimates & Forecast, by Region, 2019–2025
8.2.4. Hydrogenated Pyrolysis Oils (HPO)
8.2.4.1. Market Estimates & Forecast, 2019–2025
8.2.4.2. Market Estimates & Forecast, by Region, 2019–2025
8.2.5. Fischer-Tropsch (FT)
8.2.5.1. Market Estimates & Forecast, 2019–2025
8.2.5.2. Market Estimates & Forecast, by Region, 2019–2025
8.2.6. Synthesized Iso-Paraffinic (SIP)
8.2.6.1. Market Estimates & Forecast, 2019–2025
8.2.6.2. Market Estimates & Forecast, by Region, 2019–2025
8.3. CNG
8.3.1. Market Estimates & Forecast, 2019–2025
8.3.2. Market Estimates & Forecast, by Region, 2019–2025
8.4. LPG
8.4.1. Market Estimates & Forecast, 2019–2025
8.4.2. Market Estimates & Forecast, by Region, 2019–2025
8.5. Others
8.5.1. Market Estimates & Forecast, 2019–2025
8.5.2. Market Estimates & Forecast, by Region, 2019–2025
9. Global Aviation Alternative Fuel Market, by Application
9.1. Introduction
9.2. Commercial
9.2.1. Market Estimates & Forecast, 2019–2025
9.2.2. Market Estimates & Forecast, by Region, 2019–2025
9.3. Military
9.3.1. Market Estimates & Forecast, 2019–2025
9.3.2. Market Estimates & Forecast, by Region, 2019–2025
10. Global Aviation Alternative Fuel Market, by Region
10.1. Introduction
10.2. North America
10.2.1. Market Estimates & Forecast, by Country, 2019–2025
10.2.2. Market Estimates & Forecast, by Process, 2019–2025
10.2.3. Market Estimates & Forecast, by Fuel Type, 2019–2025
10.2.4. Market Estimates & Forecast, by Application, 2019–2025
10.2.5. US
10.2.5.1. Market Estimates & Forecast, by Process, 2019–2025
10.2.5.2. Market Estimates & Forecast, by Fuel Type, 2019–2025
10.2.5.3. Market Estimates & Forecast, by Application, 2019–2025
10.2.6. Canada
10.2.6.1. Market Estimates & Forecast, by Process, 2019–2025
10.2.6.2. Market Estimates & Forecast, by Fuel Type, 2019–2025
10.2.6.3. Market Estimates & Forecast, by Application, 2019–2025
10.3. Europe
10.3.1. Market Estimates & Forecast, by Country, 2019–2025
10.3.2. Market Estimates & Forecast, by Process, 2019–2025
10.3.3. Market Estimates & Forecast, by Fuel Type, 2019–2025
10.3.4. Market Estimates & Forecast, by Application, 2019–2025
10.3.5. UK
10.3.5.1. Market Estimates & Forecast, by Process, 2019–2025
10.3.5.2. Market Estimates & Forecast, by Fuel Type, 2019–2025
10.3.5.3. Market Estimates & Forecast, by Application, 2019–2025
10.3.6. Germany
10.3.6.1. Market Estimates & Forecast, by Process, 2019–2025
10.3.6.2. Market Estimates & Forecast, by Fuel Type, 2019–2025
10.3.6.3. Market Estimates & Forecast, by Application, 2019–2025
10.3.7. France
10.3.7.1. Market Estimates & Forecast, by Process, 2019–2025
10.3.7.2. Market Estimates & Forecast, by Fuel Type, 2019–2025
10.3.7.3. Market Estimates & Forecast, by Application, 2019–2025
10.3.8. Italy
10.3.8.1. Market Estimates & Forecast, by Process, 2019–2025
10.3.8.2. Market Estimates & Forecast, by Fuel Type, 2019–2025
10.3.8.3. Market Estimates & Forecast, by Application, 2019–2025
10.3.9. Rest of Europe
10.3.9.1. Market Estimates & Forecast, by Process, 2019–2025
10.3.9.2. Market Estimates & Forecast, by Fuel Type, 2019–2025
10.3.9.3. Market Estimates & Forecast, by Application, 2019–2025
10.4. Asia-Pacific
10.4.1. Market Estimates & Forecast, by Country, 2019–2025
10.4.2. Market Estimates & Forecast, by Process, 2019–2025
10.4.3. Market Estimates & Forecast, by Fuel Type, 2019–2025
10.4.4. Market Estimates & Forecast, by Application, 2019–2025
10.4.5. China
10.4.5.1. Market Estimates & Forecast, by Process, 2019–2025
10.4.5.2. Market Estimates & Forecast, by Fuel Type, 2019–2025
10.4.5.3. Market Estimates & Forecast, by Application, 2019–2025
10.4.6. Japan
10.4.6.1. Market Estimates & Forecast, by Process, 2019–2025
10.4.6.2. Market Estimates & Forecast, by Fuel Type, 2019–2025
10.4.6.3. Market Estimates & Forecast, by Application, 2019–2025
10.4.7. India
10.4.7.1. Market Estimates & Forecast, by Process, 2019–2025
10.4.7.2. Market Estimates & Forecast, by Fuel Type, 2019–2025
10.4.7.3. Market Estimates & Forecast, by Application, 2019–2025
10.4.8. Australia
10.4.8.1. Market Estimates & Forecast, by Process, 2019–2025
10.4.8.2. Market Estimates & Forecast, by Fuel Type, 2019–2025
10.4.8.3. Market Estimates & Forecast, by Application, 2019–2025
10.4.9. Rest of Asia-Pacific
10.4.9.1. Market Estimates & Forecast, by Process, 2019–2025
10.4.9.2. Market Estimates & Forecast, by Fuel Type, 2019–2025
10.4.9.3. Market Estimates & Forecast, by Application, 2019–2025
10.5. Middle East & Africa
10.5.1. Market Estimates & Forecast, by Country, 2019–2025
10.5.2. Market Estimates & Forecast, by Process, 2019–2025
10.5.3. Market Estimates & Forecast, by Fuel Type, 2019–2025
10.5.4. Market Estimates & Forecast, by Application, 2019–2025
10.5.5. UAE
10.5.5.1. Market Estimates & Forecast, by Process, 2019–2025
10.5.5.2. Market Estimates & Forecast, by Fuel Type, 2019–2025
10.5.5.3. Market Estimates & Forecast, by Application, 2019–2025
10.5.6. Saudi Arabia
10.5.6.1. Market Estimates & Forecast, by Process, 2019–2025
10.5.6.2. Market Estimates & Forecast, by Fuel Type, 2019–2025
10.5.6.3. Market Estimates & Forecast, by Application, 2019–2025
10.5.7. Israel
10.5.7.1. Market Estimates & Forecast, by Process, 2019–2025
10.5.7.2. Market Estimates & Forecast, by Fuel Type, 2019–2025
10.5.7.3. Market Estimates & Forecast, by Application, 2019–2025
10.5.8. Rest of the Middle East & Africa
10.5.8.1. Market Estimates & Forecast, by Process, 2019–2025
10.5.8.2. Market Estimates & Forecast, by Fuel Type, 2019–2025
10.5.8.3. Market Estimates & Forecast, by Application, 2019–2025
10.6. Latin America
10.6.1. Market Estimates & Forecast, by Country, 2019–2025
10.6.2. Market Estimates & Forecast, by Process, 2019–2025
10.6.3. Market Estimates & Forecast, by Fuel Type, 2019–2025
10.6.4. Market Estimates & Forecast, by Application, 2019–2025
10.6.5. Brazil
10.6.5.1. Market Estimates & Forecast, by Process, 2019–2025
10.6.5.2. Market Estimates & Forecast, by Fuel Type, 2019–2025
10.6.5.3. Market Estimates & Forecast, by Application, 2019–2025
10.6.6. Rest of Latin America
10.6.6.1. Market Estimates & Forecast, by Process, 2019–2025
10.6.6.2. Market Estimates & Forecast, by Fuel Type, 2019–2025
10.6.6.3. Market Estimates & Forecast, by Application, 2019–2025
11. Competitive Landscape
11.1. Competitive Overview
11.2. Competitor Dashboard
11.3. Major Growth Strategies in the Global Aviation Alternative Fuel Market
11.4. Competitive Benchmarking
11.5. Market Share Analysis
11.6. AeroVironment, Inc.: The Leading Player in Terms of Number of Developments in the Global Aviation Alternative Fuel Market
11.7. Key Developments & Growth Strategies
11.7.1. Fuel Type Launches/Service Deployments
11.7.2. Mergers & Acquisitions
11.7.3. Joint Ventures
12. Company Profiles
12.1. Air BP Limited
12.1.1. Company Overview
12.1.2. Products/Services Offered
12.1.3. Financial Overview
12.1.4. Key Developments
12.1.5. SWOT Analysis
12.1.6. Key Strategies
12.2. Chevron Corporation
12.2.1. Company Overview
12.2.2. Products/Services Offered
12.2.3. Financial Overview
12.2.4. Key Developments
12.2.5. SWOT Analysis
12.2.6. Key Strategies
12.3. Fulcrum BioEnergy
12.3.1. Company Overview
12.3.2. Products/Services Offered
12.3.3. Financial Overview
12.3.4. Key Developments
12.3.5. SWOT Analysis
12.3.6. Key Strategies
12.4. Gevo Inc.
12.4.1. Company Overview
12.4.2. Products/Services Offered
12.4.3. Financial Overview
12.4.4. Key Developments
12.4.5. SWOT Analysis
12.4.6. Key Strategies
12.5. Honeywell International Inc.
12.5.1. Company Overview
12.5.2. Products/Services Offered
12.5.3. Financial Overview
12.5.4. Key Developments
12.5.5. SWOT Analysis
12.5.6. Key Strategies
12.6. LanzaTech
12.6.1. Company Overview
12.6.2. Products/Services Offered
12.6.3. Financial Overview
12.6.4. Key Developments
12.6.5. SWOT Analysis
12.6.6. Key Strategies
12.7. Neste Oyj
12.7.1. Company Overview
12.7.2. Products/Services Offered
12.7.3. Financial Overview
12.7.4. Key Developments
12.7.5. SWOT Analysis
12.7.6. Key Strategies
12.8. NXT Fuels Limited
12.8.1. Company Overview
12.8.2. Products/Services Offered
12.8.3. Financial Overview
12.8.4. Key Developments
12.8.5. SWOT Analysis
12.8.6. Key Strategies
12.9. Renewable Energy Group, Inc.
12.9.1. Company Overview
12.9.2. Products/Services Offered
12.9.3. Financial Overview
12.9.4. Key Developments
12.9.5. SWOT Analysis
12.9.6. Key Strategies
12.10. Red Rock Biofuels
12.10.1. Company Overview
12.10.2. Products/Services Offered
12.10.3. Financial Overview
12.10.4. Key Developments
12.10.5. SWOT Analysis
12.10.6. Key Strategies
12.11. SG Preston Company
12.11.1. Company Overview
12.11.2. Products/Services Offered
12.11.3. Financial Overview
12.11.4. Key Developments
12.11.5. SWOT Analysis
12.11.6. Key Strategies
12.12. Shell International BV
12.12.1. Company Overview
12.12.2. Products/Services Offered
12.12.3. Financial Overview
12.12.4. Key Developments
12.12.5. SWOT Analysis
12.12.6. Key Strategies
12.13. SkyNRG
12.13.1. Company Overview
12.13.2. Products/Services Offered
12.13.3. Financial Overview
12.13.4. Key Developments
12.13.5. SWOT Analysis
12.13.6. Key Strategies
12.14. SWEDISH BIOFUELS AB
12.14.1. Company Overview
12.14.2. Products/Services Offered
12.14.3. Financial Overview
12.14.4. Key Developments
12.14.5. SWOT Analysis
12.14.6. Key Strategies
12.15. TerraVia
12.15.1. Company Overview
12.15.2. Products/Services Offered
12.15.3. Financial Overview
12.15.4. Key Developments
12.15.5. SWOT Analysis
12.15.6. Key Strategies
12.16. Total
12.16.1. Company Overview
12.16.2. Products/Services Offered
12.16.3. Financial Overview
12.16.4. Key Developments
12.16.5. SWOT Analysis
12.16.6. Key Strategies
12.17. World Energy
12.17.1. Company Overview
12.17.2. Products/Services Offered
12.17.3. Financial Overview
12.17.4. Key Developments
12.17.5. SWOT Analysis
12.17.6. Key Strategies
13. Appendix
13.1. References
13.2. Related Reports
13.3. List of Abbreviations
14. Industry Insights
Note: This table of contents is tentative and subject to change as the research progresses.
List of Tables
Table 1 Global Aviation Alternative Fuel Market, by Region, 2019–2025
Table 2 North America: Aviation Alternative Fuel Market, by Country, 2019–2025
Table 3 Europe: Aviation Alternative Fuel Market, by Country, 2019–2025
Table 4 Asia-Pacific: Aviation Alternative Fuel Market, by Country, 2019–2025
Table 5 Middle East & Africa: Aviation Alternative Fuel Market, by Country, 2019–2025
Table 6 Latin America: Aviation Alternative Fuel Market, by Country, 2019–2025
Table 7 Global Aviation Alternative Fuel Market Size, by Region, 2019–2025
Table 8 North America: Aviation Alternative Fuel Market Size, by Country, 2019–2025
Table 9 Europe: Aviation Alternative Fuel Market Size, by Country, 2019–2025
Table 10 Asia-Pacific: Aviation Alternative Fuel Market Size, by Country, 2019–2025
Table 11 Middle East & Africa: Aviation Alternative Fuel Market Size, by Country, 2019–2025
Table 12 Latin America: Aviation Alternative Fuel Market Size, by Country, 2019–2025
Table 13 Global Aviation Alternative Fuel Process Market, by Region, 2019–2025
Table 14 North America: Aviation Alternative Fuel Process Market, by Country, 2019–2025
Table 15 Europe: Aviation Alternative Fuel Process Market, by Country, 2019–2025
Table 16 Asia-Pacific: Aviation Alternative Fuel Process Market, by Country, 2019–2025
Table 17 Middle East & Africa: Aviation Alternative Fuel Process Market, by Country, 2019–2025
Table 18 Latin America: Aviation Alternative Fuel Process Market, by Country, 2019–2025
Table 19 Global Aviation Alternative Fuel Market, by Fuel Type, by Region, 2019–2025
Table 20 North America: Aviation Alternative Fuel Market, by Fuel Type, by Country, 2019–2025
Table 21 Europe: Aviation Alternative Fuel Market, by Fuel Type, by Country, 2019–2025
Table 22 Asia-Pacific: Aviation Alternative Fuel Market, by Fuel Type, by Country, 2019–2025
Table 23 Middle East & Africa: Aviation Alternative Fuel Market, by Fuel Type, by Country, 2019–2025
Table 24 Latin America: Aviation Alternative Fuel Market, by Fuel Type, by Country, 2019–2025
Table 25 Global Aviation Alternative Fuel Application Market, by Region, 2019–2025
Table 26 North America: Aviation Alternative Fuel Application Market, by Country, 2019–2025
Table 27 Europe: Aviation Alternative Fuel Application Market, by Country, 2019–2025
Table 28 Asia-Pacific: Aviation Alternative Fuel Application Market, by Country, 2019–2025
Table 29 Middle East & Africa: Aviation Alternative Fuel Application Market, by Country, 2019–2025
Table 30 Latin America: Aviation Alternative Fuel Application Market, by Country, 2019–2025
Table 31 Global Aviation Alternative Fuel Market, by Region, 2019–2025
Table 32 Global Aviation Alternative Fuel Market, by Process, 2019–2025
Table 33 Global Aviation Alternative Fuel Market, by Fuel Type, 2019–2025
Table 34 Global Aviation Alternative Fuel Market, by Application, 2019–2025
Table 35 North America: Aviation Alternative Fuel Market, by Country, 2019–2025
Table 36 North America: Aviation Alternative Fuel Market, by Process, 2019–2025
Table 37 North America: Aviation Alternative Fuel Market, by Fuel Type, 2019–2025
Table 38 North America: Aviation Alternative Fuel Market, by Application, 2019–2025
Table 39 Europe: Aviation Alternative Fuel Market, by Country, 2019–2025
Table 40 Europe: Aviation Alternative Fuel Market, by Process, 2019–2025
Table 41 Europe: Aviation Alternative Fuel Market, by Fuel Type, 2019–2025
Table 42 Europe: Aviation Alternative Fuel Market, by Application, 2019–2025
Table 43 Asia-Pacific: Aviation Alternative Fuel Market, by Country, 2019–2025
Table 44 Asia-Pacific: Aviation Alternative Fuel Market, by Process, 2019–2025
Table 45 Asia-Pacific: Aviation Alternative Fuel Market, by Fuel Type, 2019–2025
Table 46 Asia-Pacific: Aviation Alternative Fuel Market, by Application, 2019–2025
Table 47 Middle East & Africa: Aviation Alternative Fuel Market, by Country, 2019–2025
Table 48 Middle East & Africa: Aviation Alternative Fuel Market, by Process, 2019–2025
Table 49 Middle East & Africa: Aviation Alternative Fuel Market, by Fuel Type, 2019–2025
Table 50 Middle East & Africa: Aviation Alternative Fuel Market, by Application, 2019–2025
Table 51 Latin America: Aviation Alternative Fuel Market, by Country, 2019–2025
Table 52 Latin America: Aviation Alternative Fuel Market, by Process, 2019–2025
Table 53 Latin America: Aviation Alternative Fuel Market, by Fuel Type, 2019–2025
Table 54 Latin America: Aviation Alternative Fuel Market, by Application, 2019–2025
List of Figures
FIGURE 1 Research Process of MRFR
FIGURE 2 Top-Down and Bottom-Up Approaches
FIGURE 3 Market Dynamics
FIGURE 4 Impact Analysis: Market Drivers
FIGURE 5 Impact Analysis: Market Restraints
FIGURE 6 Porter's Five Forces Analysis
FIGURE 7 Value Chain Analysis
FIGURE 8 Global Aviation Alternative Fuel Market Share, by Process, 2018 (%)
FIGURE 9 Global Aviation Alternative Fuel Market, by Process, 2019–2025 (USD Million)
FIGURE 10 Global Aviation Alternative Fuel Market Share, by Fuel Type, 2018 (%)
FIGURE 11 Global Aviation Alternative Fuel Market, by Fuel Type, 2019–2025 (USD Million)
FIGURE 12 Global Aviation Alternative Fuel Market Share, by Application, 2018 (%)
FIGURE 13 Global Aviation Alternative Fuel Market, by Application, 2019–2025 (USD Million)
FIGURE 14 Global Aviation Alternative Fuel Market Share (%), by Region, 2018
FIGURE 15 Global Aviation Alternative Fuel Market, by Region, 2019–2025 (USD Million)
FIGURE 16 North America: Aviation Alternative Fuel Market Share (%), 2018
FIGURE 17 North America: Aviation Alternative Fuel Market, by Country, 2019–2025 (USD Million)
FIGURE 18 Europe: Aviation Alternative Fuel Market Share (%), 2018
FIGURE 19 Europe: Aviation Alternative Fuel Market, by Country, 2019–2025 (USD Million)
FIGURE 20 Asia-Pacific: Aviation Alternative Fuel Market Share (%), 2018
FIGURE 21 Asia-Pacific: Aviation Alternative Fuel Market, by Country, 2019–2025 (USD Million)
FIGURE 22 Middle East & Africa: Aviation Alternative Fuel Market Share (%), 2018
FIGURE 23 Middle East & Africa: Aviation Alternative Fuel Market, by Country, 2019–2025 (USD Million)
FIGURE 24 Latin America: Aviation Alternative Fuel Market Share (%), 2018
FIGURE 25 Latin America: Aviation Alternative Fuel Market, by Country, 2019–2025 (USD Million)