Request Free Sample ×

Kindly complete the form below to receive a free sample of this Report

* Please use a valid business email

Leading companies partner with us for data-driven Insights

clients tt-cursor
Hero Background

Marché de l'automatisation et de la réponse à l'orchestration de la sécurité

ID: MRFR/ICT/6913-HCR
200 Pages
Apoorva Priyadarshi
Last Updated: April 06, 2026

Rapport d'étude de marché sur l'automatisation et la réponse à l'orchestration de la sécurité (SOAR) par mode de déploiement (basé sur le cloud, sur site, hybride), par type de solution (automatisation de la sécurité, réponse aux incidents, intelligence sur les menaces), par secteur d'utilisation finale (BFSI, santé, informatique et télécommunications, gouvernement, vente au détail), par taille d'organisation (petites entreprises, moyennes entreprises, grandes entreprises) et par région (Amérique du Nord, Europe, Amérique du Sud, Asie-Pacifique, Moyen-Orient et Afrique) - Prévisions jusqu'en 2035.

Partager
Download PDF ×

We do not share your information with anyone. However, we may send you emails based on your report interest from time to time. You may contact us at any time to opt-out.

Security Orchestration Automation and Response Market Infographic
Purchase Options
  1. 1 RÉSUMÉ EXÉCUTIF
    1. 1.1 Aperçu du marché
    2. 1.2 Principales conclusions
    3. 1.3 Segmentation du marché
    4. 1.4 Paysage concurrentiel
    5. 1.5 Défis et opportunités
    6. 1.6 Perspectives d'avenir
  2. 2 INTRODUCTION AU MARCHÉ
    1. 2.1 Définition
    2. 2.2 Portée de l'étude
      1. 2.2.1 Objectif de la recherche
      2. 2.2.2 Hypothèse
      3. 2.2.3 Limitations
  3. 3 MÉTHODOLOGIE DE RECHERCHE
    1. 3.1 Aperçu
    2. 3.2 Exploration de données
    3. 3.3 Recherche secondaire
    4. 3.4 Recherche primaire
      1. 3.4.1 Interviews primaires et processus de collecte d'informations
      2. 3.4.2 Répartition des répondants principaux
    5. 3.5 Modèle de prévision
    6. 3.6 Estimation de la taille du marché
      1. 3.6.1 Approche ascendante
      2. 3.6.2 Approche descendante
    7. 3.7 Triangulation des données
    8. 3.8 Validation
  4. 4 DYNAMIQUE DU MARCHÉ
    1. 4.1 Aperçu
    2. 4.2 Facteurs moteurs
    3. 4.3 Contraintes
    4. 4.4 Opportunités
  5. 5 ANALYSE DES FACTEURS DU MARCHÉ
    1. 5.1 Analyse de la chaîne de valeur
    2. 5.2 Analyse des cinq forces de Porter
      1. 5.2.1 Pouvoir de négociation des fournisseurs
      2. 5.2.2 Pouvoir de négociation des acheteurs
      3. 5.2.3 Menace des nouveaux entrants
      4. 5.2.4 Menace des substituts
      5. 5.2.5 Intensité de la rivalité
    3. 5.3 Analyse de l'impact du COVID-19
      1. 5.3.1 Analyse de l'impact sur le marché
      2. 5.3.2 Impact régional
      3. 5.3.3 Analyse des opportunités et des menaces
  6. 6 MARCHÉ DE L'AUTOMATISATION ET DE LA RÉPONSE À L'ORCHESTRATION DE LA SÉCURITÉ (SOAR), PAR MODE DE DÉPLOIEMENT (MILLIARDS USD)
    1. 6.1 Basé sur le cloud
    2. 6.2 Sur site
    3. 6.3 Hybride
  7. 7 MARCHÉ DE L'AUTOMATISATION ET DE LA RÉPONSE À L'ORCHESTRATION DE LA SÉCURITÉ (SOAR), PAR TYPE DE SOLUTION (MILLIARDS USD)
    1. 7.1 Automatisation de la sécurité
    2. 7.2 Réponse aux incidents
    3. 7.3 Intelligence sur les menaces
  8. 8 MARCHÉ DE L'AUTOMATISATION ET DE LA RÉPONSE À L'ORCHESTRATION DE LA SÉCURITÉ (SOAR), PAR SECTEUR D'UTILISATION FINALE (MILLIARDS USD)
    1. 8.1 BFSI
    2. 8.2 Santé
    3. 8.3 TI et télécommunications
    4. 8.4 Gouvernement
    5. 8.5 Vente au détail
  9. 9 MARCHÉ DE L'AUTOMATISATION ET DE LA RÉPONSE À L'ORCHESTRATION DE LA SÉCURITÉ (SOAR), PAR TAILLE D'ORGANISATION (MILLIARDS USD)
    1. 9.1 Petites entreprises
    2. 9.2 Moyennes entreprises
    3. 9.3 Grandes entreprises
  10. 10 MARCHÉ DE L'AUTOMATISATION ET DE LA RÉPONSE À L'ORCHESTRATION DE LA SÉCURITÉ (SOAR), PAR RÉGION (MILLIARDS USD)
    1. 10.1 Amérique du Nord
      1. 10.1.1 États-Unis
      2. 10.1.2 Canada
    2. 10.2 Europe
      1. 10.2.1 Allemagne
      2. 10.2.2 Royaume-Uni
      3. 10.2.3 France
      4. 10.2.4 Russie
      5. 10.2.5 Italie
      6. 10.2.6 Espagne
      7. 10.2.7 Reste de l'Europe
    3. 10.3 APAC
      1. 10.3.1 Chine
      2. 10.3.2 Inde
      3. 10.3.3 Japon
      4. 10.3.4 Corée du Sud
      5. 10.3.5 Malaisie
      6. 10.3.6 Thaïlande
      7. 10.3.7 Indonésie
      8. 10.3.8 Reste de l'APAC
    4. 10.4 Amérique du Sud
      1. 10.4.1 Brésil
      2. 10.4.2 Mexique
      3. 10.4.3 Argentine
      4. 10.4.4 Reste de l'Amérique du Sud
    5. 10.5 MEA
      1. 10.5.1 Pays du CCG
      2. 10.5.2 Afrique du Sud
      3. 10.5.3 Reste de la MEA
  11. 11 PAYSAGE CONCURRENTIEL
    1. 11.1 Aperçu
    2. 11.2 Analyse concurrentielle
    3. 11.3 Analyse de la part de marché
    4. 11.4 Principale stratégie de croissance sur le marché de l'automatisation et de la réponse à l'orchestration de la sécurité (SOAR)
    5. 11.5 Évaluation comparative des concurrents
    6. 11.6 Acteurs principaux en termes de nombre de développements sur le marché de l'automatisation et de la réponse à l'orchestration de la sécurité (SOAR)
    7. 11.7 Principaux développements et stratégies de croissance
      1. 11.7.1 Lancement de nouveaux produits/Déploiement de services
      2. 11.7.2 Fusions et acquisitions
      3. 11.7.3 Coentreprises
    8. 11.8 Matrice financière des principaux acteurs
      1. 11.8.1 Ventes et revenus d'exploitation
      2. 11.8.2 Dépenses de R&D des principaux acteurs. 2023
  12. 12 PROFILS D'ENTREPRISES
    1. 12.1 IBM
      1. 12.1.1 Aperçu financier
      2. 12.1.2 Produits offerts
      3. 12.1.3 Principaux développements
      4. 12.1.4 Analyse SWOT
      5. 12.1.5 Stratégies clés
    2. 12.2 Demisto
      1. 12.2.1 Aperçu financier
      2. 12.2.2 Produits offerts
      3. 12.2.3 Principaux développements
      4. 12.2.4 Analyse SWOT
      5. 12.2.5 Stratégies clés
    3. 12.3 Cyberbit
      1. 12.3.1 Aperçu financier
      2. 12.3.2 Produits offerts
      3. 12.3.3 Principaux développements
      4. 12.3.4 Analyse SWOT
      5. 12.3.5 Stratégies clés
    4. 12.4 FireEye
      1. 12.4.1 Aperçu financier
      2. 12.4.2 Produits offerts
      3. 12.4.3 Principaux développements
      4. 12.4.4 Analyse SWOT
      5. 12.4.5 Stratégies clés
    5. 12.5 Palo Alto Networks
      1. 12.5.1 Aperçu financier
      2. 12.5.2 Produits offerts
      3. 12.5.3 Principaux développements
      4. 12.5.4 Analyse SWOT
      5. 12.5.5 Stratégies clés
    6. 12.6 Rapid7
      1. 12.6.1 Aperçu financier
      2. 12.6.2 Produits offerts
      3. 12.6.3 Principaux développements
      4. 12.6.4 Analyse SWOT
      5. 12.6.5 Stratégies clés
    7. 12.7 Fortinet
      1. 12.7.1 Aperçu financier
      2. 12.7.2 Produits offerts
      3. 12.7.3 Principaux développements
      4. 12.7.4 Analyse SWOT
      5. 12.7.5 Stratégies clés
    8. 12.8 SailPoint
      1. 12.8.1 Aperçu financier
      2. 12.8.2 Produits offerts
      3. 12.8.3 Principaux développements
      4. 12.8.4 Analyse SWOT
      5. 12.8.5 Stratégies clés
    9. 12.9 Splunk
      1. 12.9.1 Aperçu financier
      2. 12.9.2 Produits offerts
      3. 12.9.3 Principaux développements
      4. 12.9.4 Analyse SWOT
      5. 12.9.5 Stratégies clés
    10. 12.10 Centrify
      1. 12.10.1 Aperçu financier
      2. 12.10.2 Produits offerts
      3. 12.10.3 Principaux développements
      4. 12.10.4 Analyse SWOT
      5. 12.10.5 Stratégies clés
    11. 12.11 ServiceNow
      1. 12.11.1 Aperçu financier
      2. 12.11.2 Produits offerts
      3. 12.11.3 Principaux développements
      4. 12.11.4 Analyse SWOT
      5. 12.11.5 Stratégies clés
    12. 12.12 LogRhythm
      1. 12.12.1 Aperçu financier
      2. 12.12.2 Produits offerts
      3. 12.12.3 Principaux développements
      4. 12.12.4 Analyse SWOT
      5. 12.12.5 Stratégies clés
    13. 12.13 SonicWall
      1. 12.13.1 Aperçu financier
      2. 12.13.2 Produits offerts
      3. 12.13.3 Principaux développements
      4. 12.13.4 Analyse SWOT
      5. 12.13.5 Stratégies clés
    14. 12.14 Swimlane
      1. 12.14.1 Aperçu financier
      2. 12.14.2 Produits offerts
      3. 12.14.3 Principaux développements
      4. 12.14.4 Analyse SWOT
      5. 12.14.5 Stratégies clés
    15. 12.15 Siempli
      1. 12.15.1 Aperçu financier
      2. 12.15.2 Produits offerts
      3. 12.15.3 Principaux développements
      4. 12.15.4 Analyse SWOT
      5. 12.15.5 Stratégies clés
  13. 13 ANNEXE
    1. 13.1 Références
    2. 13.2 Rapports connexes
    3. LISTE DES TABLEAUX
    4. TABLEAU 1. LISTE DES HYPOTHÈSES
    5. TABLEAU 2. ESTIMATIONS ET PRÉVISIONS DE LA TAILLE DU MARCHÉ DE L'AUTOMATISATION ET DE LA RÉPONSE À L'ORCHESTRATION DE LA SÉCURITÉ (SOAR) EN AMÉRIQUE DU NORD, PAR MODE DE DÉPLOIEMENT, 2019-2035 (MILLIARDS USD)
    6. TABLEAU 3. ESTIMATIONS ET PRÉVISIONS DE LA TAILLE DU MARCHÉ DE L'AUTOMATISATION ET DE LA RÉPONSE À L'ORCHESTRATION DE LA SÉCURITÉ (SOAR) EN AMÉRIQUE DU NORD, PAR TYPE DE SOLUTION, 2019-2035 (MILLIARDS USD)
    7. TABLEAU 4. ESTIMATIONS ET PRÉVISIONS DE LA TAILLE DU MARCHÉ DE L'AUTOMATISATION ET DE LA RÉPONSE À L'ORCHESTRATION DE LA SÉCURITÉ (SOAR) EN AMÉRIQUE DU NORD, PAR SECTEUR D'UTILISATION FINALE, 2019-2035 (MILLIARDS USD)
    8. TABLEAU 5. ESTIMATIONS ET PRÉVISIONS DE LA TAILLE DU MARCHÉ DE L'AUTOMATISATION ET DE LA RÉPONSE À L'ORCHESTRATION DE LA SÉCURITÉ (SOAR) EN AMÉRIQUE DU NORD, PAR TAILLE D'ORGANISATION, 2019-2035 (MILLIARDS USD)
    9. TABLEAU 6. ESTIMATIONS ET PRÉVISIONS DE LA TAILLE DU MARCHÉ DE L'AUTOMATISATION ET DE LA RÉPONSE À L'ORCHESTRATION DE LA SÉCURITÉ (SOAR) EN AMÉRIQUE DU NORD, PAR RÉGION, 2019-2035 (MILLIARDS USD)
    10. TABLEAU 7. ESTIMATIONS ET PRÉVISIONS DE LA TAILLE DU MARCHÉ DE L'AUTOMATISATION ET DE LA RÉPONSE À L'ORCHESTRATION DE LA SÉCURITÉ (SOAR) AUX ÉTATS-UNIS, PAR MODE DE DÉPLOIEMENT, 2019-2035 (MILLIARDS USD)
    11. TABLEAU 8. ESTIMATIONS ET PRÉVISIONS DE LA TAILLE DU MARCHÉ DE L'AUTOMATISATION ET DE LA RÉPONSE À L'ORCHESTRATION DE LA SÉCURITÉ (SOAR) AUX ÉTATS-UNIS, PAR TYPE DE SOLUTION, 2019-2035 (MILLIARDS USD)
    12. TABLEAU 9. ESTIMATIONS ET PRÉVISIONS DE LA TAILLE DU MARCHÉ DE L'AUTOMATISATION ET DE LA RÉPONSE À L'ORCHESTRATION DE LA SÉCURITÉ (SOAR) AUX ÉTATS-UNIS, PAR SECTEUR D'UTILISATION FINALE, 2019-2035 (MILLIARDS USD)
    13. TABLEAU 10. ESTIMATIONS ET PRÉVISIONS DE LA TAILLE DU MARCHÉ DE L'AUTOMATISATION ET DE LA RÉPONSE À L'ORCHESTRATION DE LA SÉCURITÉ (SOAR) AUX ÉTATS-UNIS, PAR TAILLE D'ORGANISATION, 2019-2035 (MILLIARDS USD)
    14. TABLEAU 11. ESTIMATIONS ET PRÉVISIONS DE LA TAILLE DU MARCHÉ DE L'AUTOMATISATION ET DE LA RÉPONSE À L'ORCHESTRATION DE LA SÉCURITÉ (SOAR) AUX ÉTATS-UNIS, PAR RÉGION, 2019-2035 (MILLIARDS USD)
    15. TABLEAU 12. ESTIMATIONS ET PRÉVISIONS DE LA TAILLE DU MARCHÉ DE L'AUTOMATISATION ET DE LA RÉPONSE À L'ORCHESTRATION DE LA SÉCURITÉ (SOAR) AU CANADA, PAR MODE DE DÉPLOIEMENT, 2019-2035 (MILLIARDS USD)
    16. TABLEAU 13. ESTIMATIONS ET PRÉVISIONS DE LA TAILLE DU MARCHÉ DE L'AUTOMATISATION ET DE LA RÉPONSE À L'ORCHESTRATION DE LA SÉCURITÉ (SOAR) AU CANADA, PAR TYPE DE SOLUTION, 2019-2035 (MILLIARDS USD)
    17. TABLEAU 14. ESTIMATIONS ET PRÉVISIONS DE LA TAILLE DU MARCHÉ DE L'AUTOMATISATION ET DE LA RÉPONSE À L'ORCHESTRATION DE LA SÉCURITÉ (SOAR) AU CANADA, PAR SECTEUR D'UTILISATION FINALE, 2019-2035 (MILLIARDS USD)
    18. TABLEAU 15. ESTIMATIONS ET PRÉVISIONS DE LA TAILLE DU MARCHÉ DE L'AUTOMATISATION ET DE LA RÉPONSE À L'ORCHESTRATION DE LA SÉCURITÉ (SOAR) AU CANADA, PAR TAILLE D'ORGANISATION, 2019-2035 (MILLIARDS USD)
    19. TABLEAU 16. ESTIMATIONS ET PRÉVISIONS DE LA TAILLE DU MARCHÉ DE L'AUTOMATISATION ET DE LA RÉPONSE À L'ORCHESTRATION DE LA SÉCURITÉ (SOAR) AU CANADA, PAR RÉGION, 2019-2035 (MILLIARDS USD)
    20. TABLEAU 17. ESTIMATIONS ET PRÉVISIONS DE LA TAILLE DU MARCHÉ DE L'AUTOMATISATION ET DE LA RÉPONSE À L'ORCHESTRATION DE LA SÉCURITÉ (SOAR) EN EUROPE, PAR MODE DE DÉPLOIEMENT, 2019-2035 (MILLIARDS USD)
    21. TABLEAU 18. ESTIMATIONS ET PRÉVISIONS DE LA TAILLE DU MARCHÉ DE L'AUTOMATISATION ET DE LA RÉPONSE À L'ORCHESTRATION DE LA SÉCURITÉ (SOAR) EN EUROPE, PAR TYPE DE SOLUTION, 2019-2035 (MILLIARDS USD)
    22. TABLEAU 19. ESTIMATIONS ET PRÉVISIONS DE LA TAILLE DU MARCHÉ DE L'AUTOMATISATION ET DE LA RÉPONSE À L'ORCHESTRATION DE LA SÉCURITÉ (SOAR) EN EUROPE, PAR SECTEUR D'UTILISATION FINALE, 2019-2035 (MILLIARDS USD)
    23. TABLEAU 20. ESTIMATIONS ET PRÉVISIONS DE LA TAILLE DU MARCHÉ DE L'AUTOMATISATION ET DE LA RÉPONSE À L'ORCHESTRATION DE LA SÉCURITÉ (SOAR) EN EUROPE, PAR TAILLE D'ORGANISATION, 2019-2035 (MILLIARDS USD)
    24. TABLEAU 21. ESTIMATIONS ET PRÉVISIONS DE LA TAILLE DU MARCHÉ DE L'AUTOMATISATION ET DE LA RÉPONSE À L'ORCHESTRATION DE LA SÉCURITÉ (SOAR) EN EUROPE, PAR RÉGION, 2019-2035 (MILLIARDS USD)
    25. TABLEAU 22. ESTIMATIONS ET PRÉVISIONS DE LA TAILLE DU MARCHÉ DE L'AUTOMATISATION ET DE LA RÉPONSE À L'ORCHESTRATION DE LA SÉCURITÉ (SOAR) EN ALLEMAGNE, PAR MODE DE DÉPLOIEMENT, 2019-2035 (MILLIARDS USD)
    26. TABLEAU 23. ESTIMATIONS ET PRÉVISIONS DE LA TAILLE DU MARCHÉ DE L'AUTOMATISATION ET DE LA RÉPONSE À L'ORCHESTRATION DE LA SÉCURITÉ (SOAR) EN ALLEMAGNE, PAR TYPE DE SOLUTION, 2019-2035 (MILLIARDS USD)
    27. TABLEAU 24. ESTIMATIONS ET PRÉVISIONS DE LA TAILLE DU MARCHÉ DE L'AUTOMATISATION ET DE LA RÉPONSE À L'ORCHESTRATION DE LA SÉCURITÉ (SOAR) EN ALLEMAGNE, PAR SECTEUR D'UTILISATION FINALE, 2019-2035 (MILLIARDS USD)
    28. TABLEAU 25. ESTIMATIONS ET PRÉVISIONS DE LA TAILLE DU MARCHÉ DE L'AUTOMATISATION ET DE LA RÉPONSE À L'ORCHESTRATION DE LA SÉCURITÉ (SOAR) EN ALLEMAGNE, PAR TAILLE D'ORGANISATION, 2019-2035 (MILLIARDS USD)
    29. TABLEAU 26. ESTIMATIONS ET PRÉVISIONS DE LA TAILLE DU MARCHÉ DE L'AUTOMATISATION ET DE LA RÉPONSE À L'ORCHESTRATION DE LA SÉCURITÉ (SOAR) EN ALLEMAGNE, PAR RÉGION, 2019-2035 (MILLIARDS USD)
    30. TABLEAU 27. ESTIMATIONS ET PRÉVISIONS DE LA TAILLE DU MARCHÉ DE L'AUTOMATISATION ET DE LA RÉPONSE À L'ORCHESTRATION DE LA SÉCURITÉ (SOAR) AU ROYAUME-UNI, PAR MODE DE DÉPLOIEMENT, 2019-2035 (MILLIARDS USD)
    31. TABLEAU 28. ESTIMATIONS ET PRÉVISIONS DE LA TAILLE DU MARCHÉ DE L'AUTOMATISATION ET DE LA RÉPONSE À L'ORCHESTRATION DE LA SÉCURITÉ (SOAR) AU ROYAUME-UNI, PAR TYPE DE SOLUTION, 2019-2035 (MILLIARDS USD)
    32. TABLEAU 29. ESTIMATIONS ET PRÉVISIONS DE LA TAILLE DU MARCHÉ DE L'AUTOMATISATION ET DE LA RÉPONSE À L'ORCHESTRATION DE LA SÉCURITÉ (SOAR) AU ROYAUME-UNI, PAR SECTEUR D'UTILISATION FINALE, 2019-2035 (MILLIARDS USD)
    33. TABLEAU 30. ESTIMATIONS ET PRÉVISIONS DE LA TAILLE DU MARCHÉ DE L'AUTOMATISATION ET DE LA RÉPONSE À L'ORCHESTRATION DE LA SÉCURITÉ (SOAR) AU ROYAUME-UNI, PAR TAILLE D'ORGANISATION, 2019-2035 (MILLIARDS USD)
    34. TABLEAU 31. ESTIMATIONS ET PRÉVISIONS DE LA TAILLE DU MARCHÉ DE L'AUTOMATISATION ET DE LA RÉPONSE À L'ORCHESTRATION DE LA SÉCURITÉ (SOAR) AU ROYAUME-UNI, PAR RÉGION, 2019-2035 (MILLIARDS USD)
    35. TABLEAU 32. ESTIMATIONS ET PRÉVISIONS DE LA TAILLE DU MARCHÉ DE L'AUTOMATISATION ET DE LA RÉPONSE À L'ORCHESTRATION DE LA SÉCURITÉ (SOAR) EN FRANCE, PAR MODE DE DÉPLOIEMENT, 2019-2035 (MILLIARDS USD)
    36. TABLEAU 33. ESTIMATIONS ET PRÉVISIONS DE LA TAILLE DU MARCHÉ DE L'AUTOMATISATION ET DE LA RÉPONSE À L'ORCHESTRATION DE LA SÉCURITÉ (SOAR) EN FRANCE, PAR TYPE DE SOLUTION, 2019-2035 (MILLIARDS USD)
    37. TABLEAU 34. ESTIMATIONS ET PRÉVISIONS DE LA TAILLE DU MARCHÉ DE L'AUTOMATISATION ET DE LA RÉPONSE À L'ORCHESTRATION DE LA SÉCURITÉ (SOAR) EN FRANCE, PAR SECTEUR D'UTILISATION FINALE, 2019-2035 (MILLIARDS USD)
    38. TABLEAU 35. ESTIMATIONS ET PRÉVISIONS DE LA TAILLE DU MARCHÉ DE L'AUTOMATISATION ET DE LA RÉPONSE À L'ORCHESTRATION DE LA SÉCURITÉ (SOAR) EN FRANCE, PAR TAILLE D'ORGANISATION, 2019-2035 (MILLIARDS USD)
    39. TABLEAU 36. ESTIMATIONS ET PRÉVISIONS DE LA TAILLE DU MARCHÉ DE L'AUTOMATISATION ET DE LA RÉPONSE À L'ORCHESTRATION DE LA SÉCURITÉ (SOAR) EN FRANCE, PAR RÉGION, 2019-2035 (MILLIARDS USD)
    40. TABLEAU 37. ESTIMATIONS ET PRÉVISIONS DE LA TAILLE DU MARCHÉ DE L'AUTOMATISATION ET DE LA RÉPONSE À L'ORCHESTRATION DE LA SÉCURITÉ (SOAR) EN RUSSIE, PAR MODE DE DÉPLOIEMENT, 2019-2035 (MILLIARDS USD)
    41. TABLEAU 38. ESTIMATIONS ET PRÉVISIONS DE LA TAILLE DU MARCHÉ DE L'AUTOMATISATION ET DE LA RÉPONSE À L'ORCHESTRATION DE LA SÉCURITÉ (SOAR) EN RUSSIE, PAR TYPE DE SOLUTION, 2019-2035 (MILLIARDS USD)
    42. TABLEAU 39. ESTIMATIONS ET PRÉVISIONS DE LA TAILLE DU MARCHÉ DE L'AUTOMATISATION ET DE LA RÉPONSE À L'ORCHESTRATION DE LA SÉCURITÉ (SOAR) EN RUSSIE, PAR SECTEUR D'UTILISATION FINALE, 2019-2035 (MILLIARDS USD)
    43. TABLEAU 40. ESTIMATIONS ET PRÉVISIONS DE LA TAILLE DU MARCHÉ DE L'AUTOMATISATION ET DE LA RÉPONSE À L'ORCHESTRATION DE LA SÉCURITÉ (SOAR) EN RUSSIE, PAR TAILLE D'ORGANISATION, 2019-2035 (MILLIARDS USD)
    44. TABLEAU 41. ESTIMATIONS ET PRÉVISIONS DE LA TAILLE DU MARCHÉ DE L'AUTOMATISATION ET DE LA RÉPONSE À L'ORCHESTRATION DE LA SÉCURITÉ (SOAR) EN RUSSIE, PAR RÉGION, 2019-2035 (MILLIARDS USD)
    45. TABLEAU 42. ESTIMATIONS ET PRÉVISIONS DE LA TAILLE DU MARCHÉ DE L'AUTOMATISATION ET DE LA RÉPONSE À L'ORCHESTRATION DE LA SÉCURITÉ (SOAR) EN ITALIE, PAR MODE DE DÉPLOIEMENT, 2019-2035 (MILLIARDS USD)
    46. TABLEAU 43. ESTIMATIONS ET PRÉVISIONS DE LA TAILLE DU MARCHÉ DE L'AUTOMATISATION ET DE LA RÉPONSE À L'ORCHESTRATION DE LA SÉCURITÉ (SOAR) EN ITALIE, PAR TYPE DE SOLUTION, 2019-2035 (MILLIARDS USD)
    47. TABLEAU 44. ESTIMATIONS ET PRÉVISIONS DE LA TAILLE DU MARCHÉ DE L'AUTOMATISATION ET DE LA RÉPONSE À L'ORCHESTRATION DE LA SÉCURITÉ (SOAR) EN ITALIE, PAR SECTEUR D'UTILISATION FINALE, 2019-2035 (MILLIARDS USD)
    48. TABLEAU 45. ESTIMATIONS ET PRÉVISIONS DE LA TAILLE DU MARCHÉ DE L'AUTOMATISATION ET DE LA RÉPONSE À L'ORCHESTRATION DE LA SÉCURITÉ (SOAR) EN ITALIE, PAR TAILLE D'ORGANISATION, 2019-2035 (MILLIARDS USD)
    49. TABLEAU 46. ESTIMATIONS ET PRÉVISIONS DE LA TAILLE DU MARCHÉ DE L'AUTOMATISATION ET DE LA RÉPONSE À L'ORCHESTRATION DE LA SÉCURITÉ (SOAR) EN ITALIE, PAR RÉGION, 2019-2035 (MILLIARDS USD)
    50. TABLEAU 47. ESTIMATIONS ET PRÉVISIONS DE LA TAILLE DU MARCHÉ DE L'AUTOMATISATION ET DE LA RÉPONSE À L'ORCHESTRATION DE LA SÉCURITÉ (SOAR) EN ESPAGNE, PAR MODE DE DÉPLOIEMENT, 2019-2035 (MILLIARDS USD)
    51. TABLEAU 48. ESTIMATIONS ET PRÉVISIONS DE LA TAILLE DU MARCHÉ DE L'AUTOMATISATION ET DE LA RÉPONSE À L'ORCHESTRATION DE LA SÉCURITÉ (SOAR) EN ESPAGNE, PAR TYPE DE SOLUTION, 2019-2035 (MILLIARDS USD)
    52. TABLEAU 49. ESTIMATIONS ET PRÉVISIONS DE LA TAILLE DU MARCHÉ DE L'AUTOMATISATION ET DE LA RÉPONSE À L'ORCHESTRATION DE LA SÉCURITÉ (SOAR) EN ESPAGNE, PAR SECTEUR D'UTILISATION FINALE, 2019-2035 (MILLIARDS USD)
    53. TABLEAU 50. ESTIMATIONS ET PRÉVISIONS DE LA TAILLE DU MARCHÉ DE L'AUTOMATISATION ET DE LA RÉPONSE À L'ORCHESTRATION DE LA SÉCURITÉ (SOAR) EN ESPAGNE, PAR TAILLE D'ORGANISATION, 2019-2035 (MILLIARDS USD)
    54. TABLEAU 51. ESTIMATIONS ET PRÉVISIONS DE LA TAILLE DU MARCHÉ DE L'AUTOMATISATION ET DE LA RÉPONSE À L'ORCHESTRATION DE LA SÉCURITÉ (SOAR) EN ESPAGNE, PAR RÉGION, 2019-2035 (MILLIARDS USD)
    55. TABLEAU 52. ESTIMATIONS ET PRÉVISIONS DE LA TAILLE DU MARCHÉ DE L'AUTOMATISATION ET DE LA RÉPONSE À L'ORCHESTRATION DE LA SÉCURITÉ (SOAR) DANS LE RESTE DE L'EUROPE, PAR MODE DE DÉPLOIEMENT, 2019-2035 (MILLIARDS USD)
    56. TABLEAU 53. ESTIMATIONS ET PRÉVISIONS DE LA TAILLE DU MARCHÉ DE L'AUTOMATISATION ET DE LA RÉPONSE À L'ORCHESTRATION DE LA SÉCURITÉ (SOAR) DANS LE RESTE DE L'EUROPE, PAR TYPE DE SOLUTION, 2019-2035 (MILLIARDS USD)
    57. TABLEAU 54. ESTIMATIONS ET PRÉVISIONS DE LA TAILLE DU MARCHÉ DE L'AUTOMATISATION ET DE LA RÉPONSE À L'ORCHESTRATION DE LA SÉCURITÉ (SOAR) DANS LE RESTE DE L'EUROPE, PAR SECTEUR D'UTILISATION FINALE, 2019-2035 (MILLIARDS USD)
    58. TABLEAU 55. ESTIMATIONS ET PRÉVISIONS DE LA TAILLE DU MARCHÉ DE L'AUTOMATISATION ET DE LA RÉPONSE À L'ORCHESTRATION DE LA SÉCURITÉ (SOAR) DANS LE RESTE DE L'EUROPE, PAR TAILLE D'ORGANISATION, 2019-2035 (MILLIARDS USD)
    59. TABLEAU 56. ESTIMATIONS ET PRÉVISIONS DE LA TAILLE DU MARCHÉ DE L'AUTOMATISATION ET DE LA RÉPONSE À L'ORCHESTRATION DE LA SÉCURITÉ (SOAR) DANS LE RESTE DE L'EUROPE, PAR RÉGION, 2019-2035 (MILLIARDS USD)
    60. TABLEAU 57. ESTIMATIONS ET PRÉVISIONS DE LA TAILLE DU MARCHÉ DE L'AUTOMATISATION ET DE LA RÉPONSE À L'ORCHESTRATION DE LA SÉCURITÉ (SOAR) EN APAC, PAR MODE DE DÉPLOIEMENT, 2019-2035 (MILLIARDS USD)
    61. TABLEAU 58. ESTIMATIONS ET PRÉVISIONS DE LA TAILLE DU MARCHÉ DE L'AUTOMATISATION ET DE LA RÉPONSE À L'ORCHESTRATION DE LA SÉCURITÉ (SOAR) EN APAC, PAR TYPE DE SOLUTION, 2019-2035 (MILLIARDS USD)
    62. TABLEAU 59. ESTIMATIONS ET PRÉVISIONS DE LA TAILLE DU MARCHÉ DE L'AUTOMATISATION ET DE LA RÉPONSE À L'ORCHESTRATION DE LA SÉCURITÉ (SOAR) EN APAC, PAR SECTEUR D'UTILISATION FINALE, 2019-2035 (MILLIARDS USD)
    63. TABLEAU 60. ESTIMATIONS ET PRÉVISIONS DE LA TAILLE DU MARCHÉ DE L'AUTOMATISATION ET DE LA RÉPONSE À L'ORCHESTRATION DE LA SÉCURITÉ (SOAR) EN APAC, PAR TAILLE D'ORGANISATION, 2019-2035 (MILLIARDS USD)
    64. TABLEAU 61. ESTIMATIONS ET PRÉVISIONS DE LA TAILLE DU MARCHÉ DE L'AUTOMATISATION ET DE LA RÉPONSE À L'ORCHESTRATION DE LA SÉCURITÉ (SOAR) EN APAC, PAR RÉGION, 2019-2035 (MILLIARDS USD)
    65. TABLEAU 62. ESTIMATIONS ET PRÉVISIONS DE LA TAILLE DU MARCHÉ DE L'AUTOMATISATION ET DE LA RÉPONSE À L'ORCHESTRATION DE LA SÉCURITÉ (SOAR) EN CHINE, PAR MODE DE DÉPLOIEMENT, 2019-2035 (MILLIARDS USD)
    66. TABLEAU 63. ESTIMATIONS ET PRÉVISIONS DE LA TAILLE DU MARCHÉ DE L'AUTOMATISATION ET DE LA RÉPONSE À L'ORCHESTRATION DE LA SÉCURITÉ (SOAR) EN CHINE, PAR TYPE DE SOLUTION, 2019-2035 (MILLIARDS USD)
    67. TABLEAU 64. ESTIMATIONS ET PRÉVISIONS DE LA TAILLE DU MARCHÉ DE L'AUTOMATISATION ET DE LA RÉPONSE À L'ORCHESTRATION DE LA SÉCURITÉ (SOAR) EN CHINE, PAR SECTEUR D'UTILISATION FINALE, 2019-2035 (MILLIARDS USD)
    68. TABLEAU 65. ESTIMATIONS ET PRÉVISIONS DE LA TAILLE DU MARCHÉ DE L'AUTOMATISATION ET DE LA RÉPONSE À L'ORCHESTRATION DE LA SÉCURITÉ (SOAR) EN CHINE, PAR TAILLE D'ORGANISATION, 2019-2035 (MILLIARDS USD)
    69. TABLEAU 66. ESTIMATIONS ET PRÉVISIONS DE LA TAILLE DU MARCHÉ DE L'AUTOMATISATION ET DE LA RÉPONSE À L'ORCHESTRATION DE LA SÉCURITÉ (SOAR) EN CHINE, PAR RÉGION, 2019-2035 (MILLIARDS USD)
    70. TABLEAU 67. ESTIMATIONS ET PRÉVISIONS DE LA TAILLE DU MARCHÉ DE L'AUTOMATISATION ET DE LA RÉPONSE À L'ORCHESTRATION DE LA SÉCURITÉ (SOAR) EN INDE, PAR MODE DE DÉPLOIEMENT, 2019-2035 (MILLIARDS USD)
    71. TABLEAU 68. ESTIMATIONS ET PRÉVISIONS DE LA TAILLE DU MARCHÉ DE L'AUTOMATISATION ET DE LA RÉPONSE À L'ORCHESTRATION DE LA SÉCURITÉ (SOAR) EN INDE, PAR TYPE DE SOLUTION, 2019-2035 (MILLIARDS USD)
    72. TABLEAU 69. ESTIMATIONS ET PRÉVISIONS DE LA TAILLE DU MARCHÉ DE L'AUTOMATISATION ET DE LA RÉPONSE À L'ORCHESTRATION DE LA SÉCURITÉ (SOAR) EN INDE, PAR SECTEUR D'UTILISATION FINALE, 2019-2035 (MILLIARDS USD)
    73. TABLEAU 70. ESTIMATIONS ET PRÉVISIONS DE LA TAILLE DU MARCHÉ DE L'AUTOMATISATION ET DE LA RÉPONSE À L'ORCHESTRATION DE LA SÉCURITÉ (SOAR) EN INDE, PAR TAILLE D'ORGANISATION, 2019-2035 (MILLIARDS USD)
    74. TABLEAU 71. ESTIMATIONS ET PRÉVISIONS DE LA TAILLE DU MARCHÉ DE L'AUTOMATISATION ET DE LA RÉPONSE À L'ORCHESTRATION DE LA SÉCURITÉ (SOAR) EN INDE, PAR RÉGION, 2019-2035 (MILLIARDS USD)
    75. TABLEAU 72. ESTIMATIONS ET PRÉVISIONS DE LA TAILLE DU MARCHÉ DE L'AUTOMATISATION ET DE LA RÉPONSE À L'ORCHESTRATION DE LA SÉCURITÉ (SOAR) AU JAPON, PAR MODE DE DÉPLOIEMENT, 2019-2035 (MILLIARDS USD)
    76. TABLEAU 73. ESTIMATIONS ET PRÉVISIONS DE LA TAILLE DU MARCHÉ DE L'AUTOMATISATION ET DE LA RÉPONSE À L'ORCHESTRATION DE LA SÉCURITÉ (SOAR) AU JAPON, PAR TYPE DE SOLUTION, 2019-2035 (MILLIARDS USD)
    77. TABLEAU 74. ESTIMATIONS ET PRÉVISIONS DE LA TAILLE DU MARCHÉ DE L'AUTOMATISATION ET DE LA RÉPONSE À L'ORCHESTRATION DE LA SÉCURITÉ (SOAR) AU JAPON, PAR SECTEUR D'UTILISATION FINALE, 2019-2035 (MILLIARDS USD)
    78. TABLEAU 75. ESTIMATIONS ET PRÉVISIONS DE LA TAILLE DU MARCHÉ DE L'AUTOMATISATION ET DE LA RÉPONSE À L'ORCHESTRATION DE LA SÉCURITÉ (SOAR) AU JAPON, PAR TAILLE D'ORGANISATION, 2019-2035 (MILLIARDS USD)
    79. TABLEAU 76. ESTIMATIONS ET PRÉVISIONS DE LA TAILLE DU MARCHÉ DE L'AUTOMATISATION ET DE LA RÉPONSE À L'ORCHESTRATION DE LA SÉCURITÉ (SOAR) AU JAPON, PAR RÉGION, 2019-2035 (MILLIARDS USD)
    80. TABLEAU 77. ESTIMATIONS ET PRÉVISIONS DE LA TAILLE DU MARCHÉ DE L'AUTOMATISATION ET DE LA RÉPONSE À L'ORCHESTRATION DE LA SÉCURITÉ (SOAR) EN CORÉE DU SUD, PAR MODE DE DÉPLOIEMENT, 2019-2035 (MILLIARDS USD)
    81. TABLEAU 78. ESTIMATIONS ET PRÉVISIONS DE LA TAILLE DU MARCHÉ DE L'AUTOMATISATION ET DE LA RÉPONSE À L'ORCHESTRATION DE LA SÉCURITÉ (SOAR) EN CORÉE DU SUD, PAR TYPE DE SOLUTION, 2019-2035 (MILLIARDS USD)
    82. TABLEAU 79. ESTIMATIONS ET PRÉVISIONS DE LA TAILLE DU MARCHÉ DE L'AUTOMATISATION ET DE LA RÉPONSE À L'ORCHESTRATION DE LA SÉCURITÉ (SOAR) EN CORÉE DU SUD, PAR SECTEUR D'UTILISATION FINALE, 2019-2035 (MILLIARDS USD)
    83. TABLEAU 80. ESTIMATIONS ET PRÉVISIONS DE LA TAILLE DU MARCHÉ DE L'AUTOMATISATION ET DE LA RÉPONSE À L'ORCHESTRATION DE LA SÉCURITÉ (SOAR) EN CORÉE DU SUD, PAR TAILLE D'ORGANISATION, 2019-2035 (MILLIARDS USD)
    84. TABLEAU 81. ESTIMATIONS ET PRÉVISIONS DE LA TAILLE DU MARCHÉ DE L'AUTOMATISATION ET DE LA RÉPONSE À L'ORCHESTRATION DE LA SÉCURITÉ (SOAR) EN CORÉE DU SUD, PAR RÉGION, 2019-2035 (MILLIARDS USD)
    85. TABLEAU 82. ESTIMATIONS ET PRÉVISIONS DE LA TAILLE DU MARCHÉ DE L'AUTOMATISATION ET DE LA RÉPONSE À L'ORCHESTRATION DE LA SÉCURITÉ (SOAR) EN MALAYSIE, PAR MODE DE DÉPLOIEMENT, 2019-2035 (MILLIARDS USD)
    86. TABLEAU 83. ESTIMATIONS ET PRÉVISIONS DE LA TAILLE DU MARCHÉ DE L'AUTOMATISATION ET DE LA RÉPONSE À L'ORCHESTRATION DE LA SÉCURITÉ (SOAR) EN MALAYSIE, PAR TYPE DE SOLUTION, 2019-2035 (MILLIARDS USD)
    87. TABLEAU 84. ESTIMATIONS ET PRÉVISIONS DE LA TAILLE DU MARCHÉ DE L'AUTOMATISATION ET DE LA RÉPONSE À L'ORCHESTRATION DE LA SÉCURITÉ (SOAR) EN MALAYSIE, PAR SECTEUR D'UTILISATION FINALE, 2019-2035 (MILLIARDS USD)
    88. TABLEAU 85. ESTIMATIONS ET PRÉVISIONS DE LA TAILLE DU MARCHÉ DE L'AUTOMATISATION ET DE LA RÉPONSE À L'ORCHESTRATION DE LA SÉCURITÉ (SOAR) EN MALAYSIE, PAR TAILLE D'ORGANISATION, 2019-2035 (MILLIARDS USD)
    89. TABLEAU 86. ESTIMATIONS ET PRÉVISIONS DE LA TAILLE DU MARCHÉ DE L'AUTOMATISATION ET DE LA RÉPONSE À L'ORCHESTRATION DE LA SÉCURITÉ (SOAR) EN MALAYSIE, PAR RÉGION, 2019-2035 (MILLIARDS USD)
    90. TABLEAU 87. ESTIMATIONS ET PRÉVISIONS DE LA TAILLE DU MARCHÉ DE L'AUTOMATISATION ET DE LA RÉPONSE À L'ORCHESTRATION DE LA SÉCURITÉ (SOAR) EN THAÏLANDE, PAR MODE DE DÉPLOIEMENT, 2019-2035 (MILLIARDS USD)
    91. TABLEAU 88. ESTIMATIONS ET PRÉVISIONS DE LA TAILLE DU MARCHÉ DE L'AUTOMATISATION ET DE LA RÉPONSE À L'ORCHESTRATION DE LA SÉCURITÉ (SOAR) EN THAÏLANDE, PAR TYPE DE SOLUTION, 2019-2035 (MILLIARDS USD)
    92. TABLEAU 89. ESTIMATIONS ET PRÉVISIONS DE LA TAILLE DU MARCHÉ DE L'AUTOMATISATION ET DE LA RÉPONSE À L'ORCHESTRATION DE LA SÉCURITÉ (SOAR) EN THAÏLANDE, PAR SECTEUR D'UTILISATION FINALE, 2019-2035 (MILLIARDS USD)
    93. TABLEAU 90. ESTIMATIONS ET PRÉVISIONS DE LA TAILLE DU MARCHÉ DE L'AUTOMATISATION ET DE LA RÉPONSE À L'ORCHESTRATION DE LA SÉCURITÉ (SOAR) EN THAÏLANDE, PAR TAILLE D'ORGANISATION, 2019-2035 (MILLIARDS USD)
    94. TABLEAU 91. ESTIMATIONS ET PRÉVISIONS DE LA TAILLE DU MARCHÉ DE L'AUTOMATISATION ET DE LA RÉPONSE À L'ORCHESTRATION DE LA SÉCURITÉ (SOAR) EN THAÏLANDE, PAR RÉGION, 2019-2035 (MILLIARDS USD)
    95. TABLEAU 92. ESTIMATIONS ET PRÉVISIONS DE LA TAILLE DU MARCHÉ DE L'AUTOMATISATION ET DE LA RÉPONSE À L'ORCHESTRATION DE LA SÉCURITÉ (SOAR) EN INDONÉSIE, PAR MODE DE DÉPLOIEMENT, 2019-2035 (MILLIARDS USD)
    96. TABLEAU 93. ESTIMATIONS ET PRÉVISIONS DE LA TAILLE DU MARCHÉ DE L'AUTOMATISATION ET DE LA RÉPONSE À L'ORCHESTRATION DE LA SÉCURITÉ (SOAR) EN INDONÉSIE, PAR TYPE DE SOLUTION, 2019-2035 (MILLIARDS USD)
    97. TABLEAU 94. ESTIMATIONS ET PRÉVISIONS DE LA TAILLE DU MARCHÉ DE L'AUTOMATISATION ET DE LA RÉPONSE À L'ORCHESTRATION DE LA SÉCURITÉ (SOAR) EN INDONÉSIE, PAR SECTEUR D'UTILISATION FINALE, 2019-2035 (MILLIARDS USD)
    98. TABLEAU 95. ESTIMATIONS ET PRÉVISIONS DE LA TAILLE DU MARCHÉ DE L'AUTOMATISATION ET DE LA RÉPONSE À L'ORCHESTRATION DE LA SÉCURITÉ (SOAR) EN INDONÉSIE, PAR TAILLE D'ORGANISATION, 2019-2035 (MILLIARDS USD)
    99. TABLEAU 96. ESTIMATIONS ET PRÉVISIONS DE LA TAILLE DU MARCHÉ DE L'AUTOMATISATION ET DE LA RÉPONSE À L'ORCHESTRATION DE LA SÉCURITÉ (SOAR) EN INDONÉSIE, PAR RÉGION, 2019-2035 (MILLIARDS USD)
    100. TABLEAU 97. ESTIMATIONS ET PRÉVISIONS DE LA TAILLE DU MARCHÉ DE L'AUTOMATISATION ET DE LA RÉPONSE À L'ORCHESTRATION DE LA SÉCURITÉ (SOAR) DANS LE RESTE DE L'APAC, PAR MODE DE DÉPLOIEMENT, 2019-2035 (MILLIARDS USD)
    101. TABLEAU 98. ESTIMATIONS ET PRÉVISIONS DE LA TAILLE DU MARCHÉ DE L'AUTOMATISATION ET DE LA RÉPONSE À L'ORCHESTRATION DE LA SÉCURITÉ (SOAR) DANS LE RESTE DE L'APAC, PAR TYPE DE SOLUTION, 2019-2035 (MILLIARDS USD)
    102. TABLEAU 99. ESTIMATIONS ET PRÉVISIONS DE LA TAILLE DU MARCHÉ DE L'AUTOMATISATION ET DE LA RÉPONSE À L'ORCHESTRATION DE LA SÉCURITÉ (SOAR) DANS LE RESTE DE L'APAC, PAR SECTEUR D'UTILISATION FINALE, 2019-2035 (MILLIARDS USD)
    103. TABLEAU 100. ESTIMATIONS ET PRÉVISIONS DE LA TAILLE DU MARCHÉ DE L'AUTOMATISATION ET DE LA RÉPONSE À L'ORCHESTRATION DE LA SÉCURITÉ (SOAR) DANS LE RESTE DE L'APAC, PAR TAILLE D'ORGANISATION, 2019-2035 (MILLIARDS USD)
    104. TABLEAU 101. ESTIMATIONS ET PRÉVISIONS DE LA TAILLE DU MARCHÉ DE L'AUTOMATISATION ET DE LA RÉPONSE À L'ORCHESTRATION DE LA SÉCURITÉ (SOAR) DANS LE RESTE DE L'APAC, PAR RÉGION, 2019-2035 (MILLIARDS USD)
    105. TABLEAU 102. ESTIMATIONS ET PRÉVISIONS DE LA TAILLE DU MARCHÉ DE L'AUTOMATISATION ET DE LA RÉPONSE À L'ORCHESTRATION DE LA SÉCURITÉ (SOAR) EN AMÉRIQUE DU SUD, PAR MODE DE DÉPLOIEMENT, 2019-2035 (MILLIARDS USD)
    106. TABLEAU 103. ESTIMATIONS ET PRÉVISIONS DE LA TAILLE DU MARCHÉ DE L'AUTOMATISATION ET DE LA RÉPONSE À L'ORCHESTRATION DE LA SÉCURITÉ (SOAR) EN AMÉRIQUE DU SUD, PAR TYPE DE SOLUTION, 2019-2035 (MILLIARDS USD)
    107. TABLEAU 104. ESTIMATIONS ET PRÉVISIONS DE LA TAILLE DU MARCHÉ DE L'AUTOMATISATION ET DE LA RÉPONSE À L'ORCHESTRATION DE LA SÉCURITÉ (SOAR) EN AMÉRIQUE DU SUD, PAR SECTEUR D'UTILISATION FINALE, 2019-2035 (MILLIARDS USD)
    108. TABLEAU 105. ESTIMATIONS ET PRÉVISIONS DE LA TAILLE DU MARCHÉ DE L'AUTOMATISATION ET DE LA RÉPONSE À L'ORCHESTRATION DE LA SÉCURITÉ (SOAR) EN AMÉRIQUE DU SUD, PAR TAILLE D'ORGANISATION, 2019-2035 (MILLIARDS USD)
    109. TABLEAU 106. ESTIMATIONS ET PRÉVISIONS DE LA TAILLE DU MARCHÉ DE L'AUTOMATISATION ET DE LA RÉPONSE À L'ORCHESTRATION DE LA SÉCURITÉ (SOAR) EN AMÉRIQUE DU SUD, PAR RÉGION, 2019-2035 (MILLIARDS USD)
    110. TABLEAU 107. ESTIMATIONS ET PRÉVISIONS DE LA TAILLE DU MARCHÉ DE L'AUTOMATISATION ET DE LA RÉPONSE À L'ORCHESTRATION DE LA SÉCURITÉ (SOAR) AU BRÉSIL, PAR MODE DE DÉPLOIEMENT, 2019-2035 (MILLIARDS USD)
    111. TABLEAU 108. ESTIMATIONS ET PRÉVISIONS DE LA TAILLE DU MARCHÉ DE L'AUTOMATISATION ET DE LA RÉPONSE À L'ORCHESTRATION DE LA SÉCURITÉ (SOAR) AU BRÉSIL, PAR TYPE DE SOLUTION, 2019-2035 (MILLIARDS USD)
    112. TABLEAU 109. ESTIMATIONS ET PRÉVISIONS DE LA TAILLE DU MARCHÉ DE L'AUTOMATISATION ET DE LA RÉPONSE À L'ORCHESTRATION DE LA SÉCURITÉ (SOAR) AU BRÉSIL, PAR SECTEUR D'UTILISATION FINALE, 2019-2035 (MILLIARDS USD)
    113. TABLEAU 110. ESTIMATIONS ET PRÉVISIONS DE LA TAILLE DU MARCHÉ DE L'AUTOMATISATION ET DE LA RÉPONSE À L'ORCHESTRATION DE LA SÉCURITÉ (SOAR) AU BRÉSIL, PAR TAILLE D'ORGANISATION, 2019-2035 (MILLIARDS USD)
    114. TABLEAU 111. ESTIMATIONS ET PRÉVISIONS DE LA TAILLE DU MARCHÉ DE L'AUTOMATISATION ET DE LA RÉPONSE À L'ORCHESTRATION DE LA SÉCURITÉ (SOAR) AU BRÉSIL, PAR RÉGION, 2019-2035 (MILLIARDS USD)
    115. TABLEAU 112. ESTIMATIONS ET PRÉVISIONS DE LA TAILLE DU MARCHÉ DE L'AUTOMATISATION ET DE LA RÉPONSE À L'ORCHESTRATION DE LA SÉCURITÉ (SOAR) AU MEXIQUE, PAR MODE DE DÉPLOIEMENT, 2019-2035 (MILLIARDS USD)
    116. TABLEAU 113. ESTIMATIONS ET PRÉVISIONS DE LA TAILLE DU MARCHÉ DE L'AUTOMATISATION ET DE LA RÉPONSE À L'ORCHESTRATION DE LA SÉCURITÉ (SOAR) AU MEXIQUE, PAR TYPE DE SOLUTION, 2019-2035 (MILLIARDS USD)
    117. TABLEAU 114. ESTIMATIONS ET PRÉVISIONS DE LA TAILLE DU MARCHÉ DE L'AUTOMATISATION ET DE LA RÉPONSE À L'ORCHESTRATION DE LA SÉCURITÉ (SOAR) AU MEXIQUE, PAR SECTEUR D'UTILISATION FINALE, 2019-2035 (MILLIARDS USD)
    118. TABLEAU 115. ESTIMATIONS ET PRÉVISIONS DE LA TAILLE DU MARCHÉ DE L'AUTOMATISATION ET DE LA RÉPONSE À L'ORCHESTRATION DE LA SÉCURITÉ (SOAR) AU MEXIQUE, PAR TAILLE D'ORGANISATION, 2019-2035 (MILLIARDS USD)
    119. TABLEAU 116. ESTIMATIONS ET PRÉVISIONS DE LA TAILLE DU MARCHÉ DE L'AUTOMATISATION ET DE LA RÉPONSE À L'ORCHESTRATION DE LA SÉCURITÉ (SOAR) AU MEXIQUE, PAR RÉGION, 2019-2035 (MILLIARDS USD)
    120. TABLEAU 117. ESTIMATIONS ET PRÉVISIONS DE LA TAILLE DU MARCHÉ DE L'AUTOMATISATION ET DE LA RÉPONSE À L'ORCHESTRATION DE LA SÉCURITÉ (SOAR) EN ARGENTINE, PAR MODE DE DÉPLOIEMENT, 2019-2035 (MILLIARDS USD)
    121. TABLEAU 118. ESTIMATIONS ET PRÉVISIONS DE LA TAILLE DU MARCHÉ DE L'AUTOMATISATION ET DE LA RÉPONSE À L'ORCHESTRATION DE LA SÉCURITÉ (SOAR) EN ARGENTINE, PAR TYPE DE SOLUTION, 2019-2035 (MILLIARDS USD)
    122. TABLEAU 119. ESTIMATIONS ET PRÉVISIONS DE LA TAILLE DU MARCHÉ DE L'AUTOMATISATION ET DE LA RÉPONSE À L'ORCHESTRATION DE LA SÉCURITÉ (SOAR) EN ARGENTINE, PAR SECTEUR D'UTILISATION FINALE, 2019-2035 (MILLIARDS USD)
    123. TABLEAU 120. ESTIMATIONS ET PRÉVISIONS DE LA TAILLE DU MARCHÉ DE L'AUTOMATISATION ET DE LA RÉPONSE À L'ORCHESTRATION DE LA SÉCURITÉ (SOAR) EN ARGENTINE, PAR TAILLE D'ORGANISATION, 2019-2035 (MILLIARDS USD)
    124. TABLEAU 121. ESTIMATIONS ET PRÉVISIONS DE LA TAILLE DU MARCHÉ DE L'AUTOMATISATION ET DE LA RÉPONSE À L'ORCHESTRATION DE LA SÉCURITÉ (SOAR) EN ARGENTINE, PAR RÉGION, 2019-2035 (MILLIARDS USD)
    125. TABLEAU 122. ESTIMATIONS ET PRÉVISIONS DE LA TAILLE DU MARCHÉ DE L'AUTOMATISATION ET DE LA RÉPONSE À L'ORCHESTRATION DE LA SÉCURITÉ (SOAR) DANS LE RESTE DE L'AMÉRIQUE DU SUD, PAR MODE DE DÉPLOIEMENT, 2019-2035 (MILLIARDS USD)
    126. TABLEAU 123. ESTIMATIONS ET PRÉVISIONS DE LA TAILLE DU MARCHÉ DE L'AUTOMATISATION ET DE LA RÉPONSE À L'ORCHESTRATION DE LA SÉCURITÉ (SOAR) DANS LE RESTE DE L'AMÉRIQUE DU SUD, PAR TYPE DE SOLUTION, 2019-2035 (MILLIARDS USD)
    127. TABLEAU 124. ESTIMATIONS ET PRÉVISIONS DE LA TAILLE DU MARCHÉ DE L'AUTOMATISATION ET DE LA RÉPONSE À L'ORCHESTRATION DE LA SÉCURITÉ (SOAR) DANS LE RESTE DE L'AMÉRIQUE DU SUD, PAR SECTEUR D'UTILISATION FINALE, 2019-2035 (MILLIARDS USD)
    128. TABLEAU 125. ESTIMATIONS ET PRÉVISIONS DE LA TAILLE DU MARCHÉ DE L'AUTOMATISATION ET DE LA RÉPONSE À L'ORCHESTRATION DE LA SÉCURITÉ (SOAR) DANS LE RESTE DE L'AMÉRIQUE DU SUD, PAR TAILLE D'ORGANISATION, 2019-2035 (MILLIARDS USD)
    129. TABLEAU 126. ESTIMATIONS ET PRÉVISIONS DE LA TAILLE DU MARCHÉ DE L'AUTOMATISATION ET DE LA RÉPONSE À L'ORCHESTRATION DE LA SÉCURITÉ (SOAR) DANS LE RESTE DE L'AMÉRIQUE DU SUD, PAR RÉGION, 2019-2035 (MILLIARDS USD)
    130. TABLEAU 127. ESTIMATIONS ET PRÉVISIONS DE LA TAILLE DU MARCHÉ DE L'AUTOMATISATION ET DE LA RÉPONSE À L'ORCHESTRATION DE LA SÉCURITÉ (SOAR) EN MEA, PAR MODE DE DÉPLOIEMENT, 2019-2035 (MILLIARDS USD)
    131. TABLEAU 128. ESTIMATIONS ET PRÉVISIONS DE LA TAILLE DU MARCHÉ DE L'AUTOMATISATION ET DE LA RÉPONSE À L'ORCHESTRATION DE LA SÉCURITÉ (SOAR) EN MEA, PAR TYPE DE SOLUTION, 2019-2035 (MILLIARDS USD)
    132. TABLEAU 129. ESTIMATIONS ET PRÉVISIONS DE LA TAILLE DU MARCHÉ DE L'AUTOMATISATION ET DE LA RÉPONSE À L'ORCHESTRATION DE LA SÉCURITÉ (SOAR) EN MEA, PAR SECTEUR D'UTILISATION FINALE, 2019-2035 (MILLIARDS USD)
    133. TABLEAU 130. ESTIMATIONS ET PRÉVISIONS DE LA TAILLE DU MARCHÉ DE L'AUTOMATISATION ET DE LA RÉPONSE À L'ORCHESTRATION DE LA SÉCURITÉ (SOAR) EN MEA, PAR TAILLE D'ORGANISATION, 2019-2035 (MILLIARDS USD)
    134. TABLEAU 131. ESTIMATIONS ET PRÉVISIONS DE LA TAILLE DU MARCHÉ DE L'AUTOMATISATION ET DE LA RÉPONSE À L'ORCHESTRATION DE LA SÉCURITÉ (SOAR) EN MEA, PAR RÉGION, 2019-2035 (MILLIARDS USD)
    135. TABLEAU 132. ESTIMATIONS ET PRÉVISIONS DE LA TAILLE DU MARCHÉ DE L'AUTOMATISATION ET DE LA RÉPONSE À L'ORCHESTRATION DE LA SÉCURITÉ (SOAR) DANS LES PAYS DU CCG, PAR MODE DE DÉPLOIEMENT, 2019-2035 (MILLIARDS USD)
    136. TABLEAU 133. ESTIMATIONS ET PRÉVISIONS DE LA TAILLE DU MARCHÉ DE L'AUTOMATISATION ET DE LA RÉPONSE À L'ORCHESTRATION DE LA SÉCURITÉ (SOAR) DANS LES PAYS DU CCG, PAR TYPE DE SOLUTION, 2019-2035 (MILLIARDS USD)
    137. TABLEAU 134. ESTIMATIONS ET PRÉVISIONS DE LA TAILLE DU MARCHÉ DE L'AUTOMATISATION ET DE LA RÉPONSE À L'ORCHESTRATION DE LA SÉCURITÉ (SOAR) DANS LES PAYS DU CCG, PAR SECTEUR D'UTILISATION FINALE, 2019-2035 (MILLIARDS USD)
    138. TABLEAU 135. ESTIMATIONS ET PRÉVISIONS DE LA TAILLE DU MARCHÉ DE L'AUTOMATISATION ET DE LA RÉPONSE À L'ORCHESTRATION DE LA SÉCURITÉ (SOAR) DANS LES PAYS DU CCG, PAR TAILLE D'ORGANISATION, 2019-2035 (MILLIARDS USD)
    139. TABLEAU 136. ESTIMATIONS ET PRÉVISIONS DE LA TAILLE DU MARCHÉ DE L'AUTOMATISATION ET DE LA RÉPONSE À L'ORCHESTRATION DE LA SÉCURITÉ (SOAR) DANS LES PAYS DU CCG, PAR RÉGION, 2019-2035 (MILLIARDS USD)
    140. TABLEAU 137. ESTIMATIONS ET PRÉVISIONS DE LA TAILLE DU MARCHÉ DE L'AUTOMATISATION ET DE LA RÉPONSE À L'ORCHESTRATION DE LA SÉCURITÉ (SOAR) EN AFRIQUE DU SUD, PAR MODE DE DÉPLOIEMENT, 2019-2035 (MILLIARDS USD)
    141. TABLEAU 138. ESTIMATIONS ET PRÉVISIONS DE LA TAILLE DU MARCHÉ DE L'AUTOMATISATION ET DE LA RÉPONSE À L'ORCHESTRATION DE LA SÉCURITÉ (SOAR) EN AFRIQUE DU SUD, PAR TYPE DE SOLUTION, 2019-2035 (MILLIARDS USD)
    142. TABLEAU 139. ESTIMATIONS ET PRÉVISIONS DE LA TAILLE DU MARCHÉ DE L'AUTOMATISATION ET DE LA RÉPONSE À L'ORCHESTRATION DE LA SÉCURITÉ (SOAR) EN AFRIQUE DU SUD, PAR SECTEUR D'UTILISATION FINALE, 2019-2035 (MILLIARDS USD)
    143. TABLEAU 140. ESTIMATIONS ET PRÉVISIONS DE LA TAILLE DU MARCHÉ DE L'AUTOMATISATION ET DE LA RÉPONSE À L'ORCHESTRATION DE LA SÉCURITÉ (SOAR) EN AFRIQUE DU SUD, PAR TAILLE D'ORGANISATION, 2019-2035 (MILLIARDS USD)
    144. TABLEAU 141. ESTIMATIONS ET PRÉVISIONS DE LA TAILLE DU MARCHÉ DE L'AUTOMATISATION ET DE LA RÉPONSE À L'ORCHESTRATION DE LA SÉCURITÉ (SOAR) EN AFRIQUE DU SUD, PAR RÉGION, 2019-2035 (MILLIARDS USD)
    145. TABLEAU 142. ESTIMATIONS ET PRÉVISIONS DE LA TAILLE DU MARCHÉ DE L'AUTOMATISATION ET DE LA RÉPONSE À L'ORCHESTRATION DE LA SÉCURITÉ (SOAR) DANS LE RESTE DE LA MEA, PAR MODE DE DÉPLOIEMENT, 2019-2035 (MILLIARDS USD)
    146. TABLEAU 143. ESTIMATIONS ET PRÉVISIONS DE LA TAILLE DU MARCHÉ DE L'AUTOMATISATION ET DE LA RÉPONSE À L'ORCHESTRATION DE LA SÉCURITÉ (SOAR) DANS LE RESTE DE LA MEA, PAR TYPE DE SOLUTION, 2019-2035 (MILLIARDS USD)
    147. TABLEAU 144. ESTIMATIONS ET PRÉVISIONS DE LA TAILLE DU MARCHÉ DE L'AUTOMATISATION ET DE LA RÉPONSE À L'ORCHESTRATION DE LA SÉCURITÉ (SOAR) DANS LE RESTE DE LA MEA, PAR SECTEUR D'UTILISATION FINALE, 2019-2035 (MILLIARDS USD)
    148. TABLEAU 145. ESTIMATIONS ET PRÉVISIONS DE LA TAILLE DU MARCHÉ DE L'AUTOMATISATION ET DE LA RÉPONSE À L'ORCHESTRATION DE LA SÉCURITÉ (SOAR) DANS LE RESTE DE LA MEA, PAR TAILLE D'ORGANISATION, 2019-2035 (MILLIARDS USD)
    149. TABLEAU 146. ESTIMATIONS ET PRÉVISIONS DE LA TAILLE DU MARCHÉ DE L'AUTOMATISATION ET DE LA RÉPONSE À L'ORCHESTRATION DE LA SÉCURITÉ (SOAR) DANS LE RESTE DE LA MEA, PAR RÉGION, 2019-2035 (MILLIARDS USD)
    150. TABLEAU 147. LANCEMENT DE PRODUIT/DÉVELOPPEMENT DE PRODUIT/APPROBATION
    151. TABLEAU 148. ACQUISITION/PARTENARIAT
  14. LISTE DES FIGURES
  15. FIGURE 1 SYNOPSIS DU MARCHÉ
  16. FIGURE 2 ANALYSE DU MARCHÉ DE L'AUTOMATISATION ET DE LA RÉPONSE À L'ORCHESTRATION DE LA SÉCURITÉ (SOAR) EN AMÉRIQUE DU NORD
  17. FIGURE 3 ANALYSE DU MARCHÉ DE L'AUTOMATISATION ET DE LA RÉPONSE À L'ORCHESTRATION DE LA SÉCURITÉ (SOAR) AUX ÉTATS-UNIS PAR MODE DE DÉPLOIEMENT
  18. FIGURE 4 ANALYSE DU MARCHÉ DE L'AUTOMATISATION ET DE LA RÉPONSE À L'ORCHESTRATION DE LA SÉCURITÉ (SOAR) AUX ÉTATS-UNIS PAR TYPE DE SOLUTION
  19. FIGURE 5 ANALYSE DU MARCHÉ DE L'AUTOMATISATION ET DE LA RÉPONSE À L'ORCHESTRATION DE LA SÉCURITÉ (SOAR) AUX ÉTATS-UNIS PAR SECTEUR D'UTILISATION FINALE
  20. FIGURE 6 ANALYSE DU MARCHÉ DE L'AUTOMATISATION ET DE LA RÉPONSE À L'ORCHESTRATION DE LA SÉCURITÉ (SOAR) AUX ÉTATS-UNIS PAR TAILLE D'ORGANISATION
  21. FIGURE 7 ANALYSE DU MARCHÉ DE L'AUTOMATISATION ET DE LA RÉPONSE À L'ORCHESTRATION DE LA SÉCURITÉ (SOAR) AUX ÉTATS-UNIS PAR RÉGION
  22. FIGURE 8 ANALYSE DU MARCHÉ DE L'AUTOMATISATION ET DE LA RÉPONSE À L'ORCHESTRATION DE LA SÉCURITÉ (SOAR) AU CANADA PAR MODE DE DÉPLOIEMENT
  23. FIGURE 9 ANALYSE DU MARCHÉ DE L'AUTOMATISATION ET DE LA RÉPONSE À L'ORCHESTRATION DE LA SÉCURITÉ (SOAR) AU CANADA PAR TYPE DE SOLUTION
  24. FIGURE 10 ANALYSE DU MARCHÉ DE L'AUTOMATISATION ET DE LA RÉPONSE À L'ORCHESTRATION DE LA SÉCURITÉ (SOAR) AU CANADA PAR SECTEUR D'UTILISATION FINALE
  25. FIGURE 11 ANALYSE DU MARCHÉ DE L'AUTOMATISATION ET DE LA RÉPONSE À L'ORCHESTRATION DE LA SÉCURITÉ (SOAR) AU CANADA PAR TAILLE D'ORGANISATION
  26. FIGURE 12 ANALYSE DU MARCHÉ DE L'AUTOMATISATION ET DE LA RÉPONSE À L'ORCHESTRATION DE LA SÉCURITÉ (SOAR) AU CANADA PAR RÉGION
  27. FIGURE 13 ANALYSE DU MARCHÉ DE L'AUTOMATISATION ET DE

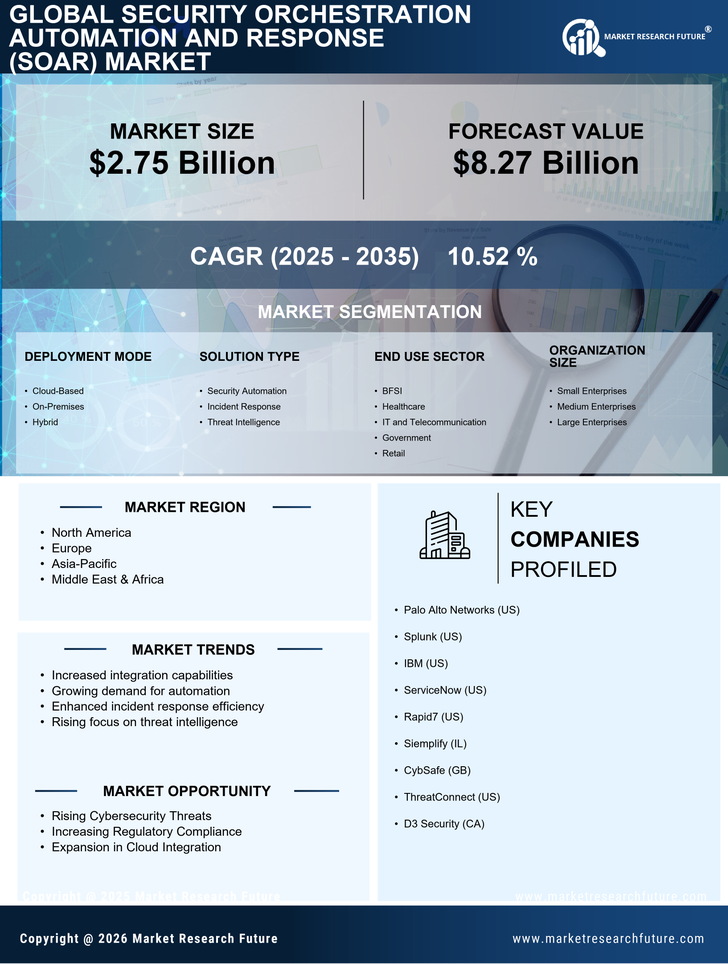
Automation et réponse à l'orchestration de sécurité (SOAR) Segmentation du marché

Perspectives du composant SOAR (Security Orchestration Automation and Response) (en milliards de dollars américains, 2018-2032)

  • Plateforme

  • Services

Automatisation et réponse de l'orchestration de sécurité (Outlook de l'application SOAR (milliards USD, 2018-2032)

  • Optimisation SOC

  • Analyse médico-légale du réseau

  • Information sur les menaces

  • Gestion de la conformité

  • Autres

Perspectives de la taille de l'organisation d'automatisation et de réponse à l'orchestration de sécurité (SOAR) (en milliards de dollars américains, 2018-2032)

  • Petites et moyennes entreprises

  • Grande entreprise

Perspectives verticales de l'automatisation et de la réponse à l'orchestration de la sécurité (SOAR) (en milliards de dollars américains, 2018-2032)

  • Banque

  • Services financiers

  • Assurance

  • Informatique et informatique Télécom

  • Gouvernement

  • Énergie et services publics

  • Soins de santé

  • Détails

  • Autres

Perspectives régionales de l'automatisation et de la réponse à l'orchestration de la sécurité (SOAR) (en milliards de dollars américains, 2018-2032)

  • Perspectives de l'Amérique du Nord (milliards USD, 2018-2032)

    • Automatisation et réponse de l'orchestration de sécurité en Amérique du Nord (SOAR) par composant

      • Plateforme

      • Services

    • Automatisation et réponse de l'orchestration de sécurité en Amérique du Nord (SOAR) par application

      • Optimisation SOC

      • Analyse médico-légale du réseau

      • Information sur les menaces

      • Gestion de la conformité

      • Autres

    • Automatisation et réponse de l'orchestration de sécurité (SOAR) en Amérique du Nord, par taille d'organisation

      • Petites et moyennes entreprises

      • Grande entreprise

    • Automation et réponse à l'orchestration de sécurité en Amérique du Nord (SOAR) par Vertical

      • Banque

      • Services financiers

      • Assurance

      • Informatique et informatique Télécom

      • Gouvernement

      • Énergie et services publics

      • Soins de santé

      • Détails

      • Autres

    • États-Unis Perspectives (en milliards de dollars américains, 2018-2032)

    • Automation et réponse de l'orchestration de sécurité aux États-Unis (SOAR) par composant

      • Plateforme

      • Services

    • Automation et réponse de l'orchestration de sécurité aux États-Unis (SOAR) par application

      • Optimisation SOC

      • Analyse médico-légale du réseau

      • Information sur les menaces

      • Gestion de la conformité

      • Autres

    • Automation et réponse de l'orchestration de sécurité aux États-Unis (SOAR) par taille d'organisation

      • Petites et moyennes entreprises

      • Grande entreprise

    • Automation et réponse de l'orchestration de sécurité aux États-Unis (SOAR) par Vertical

      • Banque

      • Services financiers

      • Assurance

      • Informatique et informatique Télécom

      • Gouvernement

      • Énergie et services publics

      • Soins de santé

      • Détails

      • Autres

    • CANADA Perspectives (en milliards de dollars américains, 2018-2032)

    • Automation et réponse de l'orchestration de sécurité au CANADA (SOAR) par composant

      • Plateforme

      • Services

    • Automation et réponse de l'orchestration de sécurité au CANADA (SOAR) par application

      • Optimisation SOC

      • Analyse médico-légale du réseau

      • Information sur les menaces

      • Gestion de la conformité

      • Autres

    • CANADA Security Orchestration Automation and Response (SOAR) par taille d'organisation

      • Petites et moyennes entreprises

      • Grande entreprise

    • CANADA Security Orchestration Automation and Response (SOAR) par Vertical

      • Banque

      • Services financiers

      • Assurance

      • Informatique et informatique Télécom

      • Gouvernement

      • Énergie et services publics

      • Soins de santé

      • Détails

      • Autres

  • Perspectives européennes (milliards USD, 2018-2032)

    • Europe Security Orchestration Automation and Response (SOAR) par composant

      • Plateforme

      • Services

    • Europe Security Orchestration Automation and Response (SOAR) par application

      • Optimisation SOC

      • Analyse médico-légale du réseau

      • Information sur les menaces

      • Gestion de la conformité

      • Autres

    • Europe Security Orchestration Automation and Response (SOAR) par taille d'organisation

      • Petites et moyennes entreprises

      • Grande entreprise

    • Europe Security Orchestration Automation and Response (SOAR) par Vertical

      • Banque

      • Services financiers

      • Assurance

      • Informatique et informatique Télécom

      • Gouvernement

      • Énergie et services publics

      • Soins de santé

      • Détails

      • Autres

    • Allemagne Perspectives (en milliards USD, 2018-2032)

    • Automation et réponse de l'orchestration de sécurité en Allemagne (SOAR) par composant

      • Plateforme

      • Services

    • Automation et réponse de l'orchestration de sécurité en Allemagne (SOAR) par application

      • Optimisation SOC

      • Analyse médico-légale du réseau

      • Information sur les menaces

      • Gestion de la conformité

      • Autres

    • Automatisation et réponse de l'orchestration de sécurité en Allemagne (SOAR) par taille d'organisation

      • Petites et moyennes entreprises

      • Grande entreprise

    • Automation et réponse de l'orchestration de sécurité en Allemagne (SOAR) par Vertical

      • Banque

      • Services financiers

      • Assurance

      • Informatique et informatique Télécom

      • Gouvernement

      • Énergie et services publics

      • Soins de santé

      • Détails

      • Autres

    • Perspectives de la France (en milliards de dollars, 2018-2032)

    • France Security Orchestration Automation and Response (SOAR) par composant

      • Plateforme

      • Services

    • France Security Orchestration Automation and Response (SOAR) par application

      • Optimisation SOC

      • Analyse médico-légale du réseau

      • Information sur les menaces

      • Gestion de la conformité

      • Autres

    • France Security Orchestration Automation and Response (SOAR) par taille d'organisation

      • Petites et moyennes entreprises

      • Grande entreprise

    • France Security Orchestration Automation and Response (SOAR) par Vertical

      • Banque

      • Services financiers

      • Assurance

      • Informatique et informatique Télécom

      • Gouvernement

      • Énergie et services publics

      • Soins de santé

      • Détails

      • Autres

    • Royaume-Uni Perspectives (en milliards de dollars américains, 2018-2032)

    • Royaume-Uni Security Orchestration Automation and Response (SOAR) par composant

      • Plateforme

      • Services

    • Royaume-Uni Security Orchestration Automation and Response (SOAR) par application

      • Optimisation SOC

      • Analyse médico-légale du réseau

      • Information sur les menaces

      • Gestion de la conformité

      • Autres

    • Royaume-Uni Security Orchestration Automation and Response (SOAR) par taille d'organisation

      • Petites et moyennes entreprises

      • Grande entreprise

    • Royaume-Uni Security Orchestration Automation and Response (SOAR) par Vertical

      • Banque

      • Services financiers

      • Assurance

      • Informatique et informatique Télécom

      • Gouvernement

      • Énergie et services publics

      • Soins de santé

      • Détails

      • Autres

    • ITALIE Perspectives (en milliards USD, 2018-2032)

    • ITALIE Security Orchestration Automation and Response (SOAR) par composant

      • Plateforme

      • Services

    • ITALIE Security Orchestration Automation and Response (SOAR) par application

      • Optimisation SOC

      • Analyse médico-légale du réseau

      • Information sur les menaces

      • Gestion de la conformité

      • Autres

    • ITALIE Security Orchestration Automation and Response (SOAR) par taille d'organisation

      • Petites et moyennes entreprises

      • Grande entreprise

    • ITALIE Security Orchestration Automation and Response (SOAR) par Vertical

      • Banque

      • Services financiers

      • Assurance

      • Informatique et informatique Télécom

      • Gouvernement

      • Énergie et services publics

      • Soins de santé

      • Détails

      • Autres

    • ESPAGNE Perspectives (en milliards USD, 2018-2032)

    • Espagne Security Orchestration Automation and Response (SOAR) par composant

      • Plateforme

      • Services

    • Espagne Security Orchestration Automation and Response (SOAR) par application

      • Optimisation SOC

      • Analyse médico-légale du réseau

      • Information sur les menaces

      • Gestion de la conformité

      • Autres

    • Espagne Security Orchestration Automation and Response (SOAR) par taille d'organisation

      • Petites et moyennes entreprises

      • Grande entreprise

    • Espagne Security Orchestration Automation and Response (SOAR) par Vertical

      • Banque

      • Services financiers

      • Assurance

      • Informatique et informatique Télécom

      • Gouvernement

      • Énergie et services publics

      • Soins de santé

      • Détails

      • Autres

    • Reste de l'Europe Perspectives (en milliards USD, 2018-2032)

    • Automatisation et réponse de l'orchestration de sécurité pour le reste de l'Europe (SOAR) par composant

      • Plateforme

      • Services

    • Automatisation et réponse de l'orchestration de sécurité pour le reste de l'Europe (SOAR) par application

      • Optimisation SOC

      • Analyse médico-légale du réseau

      • Information sur les menaces

      • Gestion de la conformité

      • Autres

    • RESTE DE L'EUROPE Security Orchestration Automation and Response (SOAR) par taille d'organisation

      • Petites et moyennes entreprises L

      • Grande entreprise

    • RESTE DE L'EUROPE Security Orchestration Automation and Response (SOAR) par Vertical

      • Banque

      • Services financiers

      • Assurance

      • Informatique et informatique Télécom

      • Gouvernement

      • Énergie et services publics

      • Soins de santé

      • Détails

      • Autres

  • Perspectives Asie-Pacifique (milliards USD, 2018-2032)

    • Automatisation et réponse de l'orchestration de sécurité en Asie-Pacifique (SOAR) par composant

      • Plateforme

      • Services

    • Automatisation et réponse de l'orchestration de sécurité en Asie-Pacifique (SOAR) par application

      • Optimisation SOC

      • Analyse médico-légale du réseau

      • Information sur les menaces

      • Gestion de la conformité

      • Autres

    • Automation et réponse à l'orchestration de sécurité en Asie-Pacifique (SOAR) par taille d'organisation

      • Petites et moyennes entreprises

      • Grande entreprise

    • Automation et réponse à l'orchestration de sécurité en Asie-Pacifique (SOAR) par Vertical

      • Banque

      • Services financiers

      • Assurance

      • Informatique et informatique Télécom

      • Gouvernement

      • Énergie et services publics

      • Soins de santé

      • Détails

      • Autres

    • Chine Perspectives (en milliards USD, 2018-2032)

    • Chine Security Orchestration Automation and Response (SOAR) par composant

      • Plateforme

      • Services

    • Automation et réponse de l'orchestration de sécurité en Chine (SOAR) par application

      • Optimisation SOC

      • Analyse médico-légale du réseau

      • Information sur les menaces

      • Gestion de la conformité

      • Autres

    • Automation et réponse de l'orchestration de sécurité en Chine (SOAR) par taille d'organisation

      • Petites et moyennes entreprises

      • Grande entreprise

    • Chine Security Orchestration Automation and Response (SOAR) par Vertical

      • Banque

      • Services financiers

      • Assurance

      • Informatique et informatique Télécom

      • Gouvernement

      • Énergie et services publics

      • Soins de santé

      • Détails

      • Autres

    • Japon Perspectives (milliards USD, 2018-2032)

    • Japan Security Orchestration Automation and Response (SOAR) par composant

      • Plateforme

      • Services

    • Automation et réponse de l'orchestration de sécurité au Japon (SOAR) par application

      • Optimisation SOC

      • Analyse médico-légale du réseau

      • Information sur les menaces

      • Gestion de la conformité

      • Autres

    • Japon Security Orchestration Automation and Response (SOAR) par taille d'organisation

      • Petites et moyennes entreprises

      • Grande entreprise

    • Japan Security Orchestration Automation and Response (SOAR) par Vertical

      • Banque

      • Services financiers

      • Assurance

      • Informatique et informatique Télécom

      • Gouvernement

      • Énergie et services publics

      • Soins de santé

      • Détails

      • Autres

    • Inde Perspectives (en milliards de dollars américains, 2018-2032)

    • India Security Orchestration Automation and Response (SOAR) par composant

      • Plateforme

      • Services

    • Automation et réponse de l'orchestration de sécurité en Inde (SOAR) par application

      • Optimisation SOC

      • Analyse médico-légale du réseau

      • Information sur les menaces

      • Gestion de la conformité

      • Autres

    • India Security Orchestration Automation and Response (SOAR) par taille d'organisation

      • Petites et moyennes entreprises

      • Grande entreprise

    • India Security Orchestration Automation and Response (SOAR) par Vertical

      • Banque

      • Services financiers

      • Assurance

      • Informatique et informatique Télécom

      • Gouvernement

      • Énergie et services publics

      • Soins de santé

      • Détails

      • Autres

    • Australie Perspectives (en milliards de dollars américains, 2018-2032)

    • Australia Security Orchestration Automation and Response (SOAR) par composant

      • Plateforme

      • Services

    • Automation et réponse de l'orchestration de sécurité en Australie (SOAR) par application

      • Optimisation SOC

      • Analyse médico-légale du réseau

      • Information sur les menaces

      • Gestion de la conformité

      • Autres

    • Automation et réponse de l'orchestration de sécurité en Australie (SOAR) par taille d'organisation

      • Petites et moyennes entreprises

      • Grande entreprise

    • Australia Security Orchestration Automation and Response (SOAR) par Vertical

      • Banque

      • Services financiers

      • Assurance

      • Informatique et informatique Télécom

      • Gouvernement

      • Énergie et services publics

      • Soins de santé

      • Détails

      • Autres

    • Reste de Perspectives de l'Asie-Pacifique (en milliards de dollars, 2018-2032)

    • Automation et réponse de l'orchestration de sécurité (SOAR) dans le reste de la région Asie-Pacifique, par composant

      • Plateforme

      • Services

    • Automation et réponse de l'orchestration de sécurité (SOAR) dans le reste de la région Asie-Pacifique, par application

      • Optimisation SOC

      • Analyse médico-légale du réseau

      • Information sur les menaces

      • Gestion de la conformité

      • Autres

    • Automatisation et réponse de l'orchestration de sécurité (SOAR) dans le reste de la région Asie-Pacifique, par taille d'organisation

      • Petites et moyennes entreprises

      • Grande entreprise

    • Automation et réponse de l'orchestration de sécurité (SOAR) dans le reste de la région Asie-Pacifique par vertical

      • Banque

      • Services financiers

      • Assurance

      • Informatique et informatique Télécom

      • Gouvernement

      • Énergie et services publics

      • Soins de santé

      • Détails

      • Autres

  • Perspectives du reste du monde (milliards USD, 2018-2032)

    • Automation et réponse de l'orchestration de sécurité pour le reste du monde (SOAR) par composant

      • Plateforme

      • Services

    • Automatisation et réponse de l'orchestration de sécurité pour le reste du monde (SOAR) par application

      • Optimisation SOC

      • Analyse médico-légale du réseau

      • Information sur les menaces

      • Gestion de la conformité

      • Autres

    • Automatisation et réponse de l'orchestration de sécurité dans le reste du monde (SOAR) par taille d'organisation

      • Petites et moyennes entreprises

      • Grande entreprise

    • Automatisation et réponse de l'orchestration de sécurité pour le reste du monde (SOAR) par Vertical

      • Banque

      • Services financiers

      • Assurance

      • Informatique et informatique Télécom

      • Gouvernement

      • Énergie et services publics

      • Soins de santé

      • Détails

      • Autres

    • Moyen-Orient Perspectives (en milliards de dollars américains, 2018-2032)

    • Automatisation et réponse de l'orchestration de sécurité au Moyen-Orient (SOAR) par composant

      • Plateforme

      • Services

    • Automatisation et réponse de l'orchestration de sécurité au Moyen-Orient (SOAR) par application

      • Optimisation SOC

      • Analyse médico-légale du réseau

      • Information sur les menaces

      • Gestion de la conformité

      • Autres

    • Automatisation et réponse de l'orchestration de sécurité au Moyen-Orient (SOAR) par taille d'organisation

      • Petites et moyennes entreprises

      • Grande entreprise

    • Automation et réponse à l'orchestration de la sécurité au Moyen-Orient (SOAR) par Vertical

      • Banque

      • Services financiers

      • Assurance

      • Informatique et informatique Télécom

      • Gouvernement

      • Énergie et services publics

      • Soins de santé

      • Détails

      • Autres

    • Afrique Perspectives (en milliards USD, 2018-2032)

    • Africa SecuriTy Orchestration Automation and Response (SOAR) par composant

      • Plateforme

      • Services

    • Africa Security Orchestration Automation and Response (SOAR) par application

      • Optimisation SOC

      • Analyse médico-légale du réseau

      • Information sur les menaces

      • Gestion de la conformité

      • Autres

    • Africa Security Orchestration Automation and Response (SOAR) par taille d'organisation

      • Petites et moyennes entreprises

      • Grande entreprise

    • Africa Security Orchestration Automation and Response (SOAR) par Vertical

      • Banque

      • Services financiers

      • Assurance

      • Informatique et informatique Télécom

      • Gouvernement

      • Énergie et services publics

      • Soins de santé

      • Détails

      • Autres

    • Amérique latine Perspectives (en milliards USD, 2018-2032)

    • Automatisation et réponse de l'orchestration de sécurité en Amérique latine (SOAR) par composant

      • Plateforme

      • Services

    • Automatisation et réponse de l'orchestration de sécurité en Amérique latine (SOAR) par application

      • Optimisation SOC

      • Analyse médico-légale du réseau

      • Information sur les menaces

      • Gestion de la conformité

      • Autres

    • Automatisation et réponse de l'orchestration de sécurité en Amérique latine (SOAR) par taille d'organisation

      • Petites et moyennes entreprises

      • Grande entreprise

    • Automatisation et réponse de l'orchestration de sécurité en Amérique latine (SOAR) par Vertical

      • Banque

      • Services financiers

      • Assurance

      • Informatique et informatique Télécom

      • Gouvernement

      • Énergie et services publics

      • Soins de santé

      • Détails

      • Autres

Compare Licence

×
Features License Type
Single User Multiuser License Enterprise User
Price $4,950 $5,950 $7,250
Maximum User Access Limit 1 User Upto 10 Users Unrestricted Access Throughout the Organization
Free Customization
Direct Access to Analyst
Deliverable Format
Platform Access
Discount on Next Purchase 10% 15% 15%
Printable Versions