Request Free Sample ×

Kindly complete the form below to receive a free sample of this Report

* Please use a valid business email

Leading companies partner with us for data-driven Insights

clients tt-cursor
Hero Background

Marché de la publicité interactive

ID: MRFR/SEM/2668-HCR
100 Pages
Ankit Gupta
Last Updated: April 06, 2026

Rapport d'étude de marché sur la publicité interactive Informations par type (Sponsoring, Blogging, Widgets, Activation hors ligne et Médias sociaux), par taille d'organisation (Petites et moyennes entreprises et Grandes entreprises), par secteur (BFSI et Biens de consommation & Commerce de détail), et par région (Amérique du Nord, Europe, Asie-Pacifique et Reste du monde) – Prévisions de l'industrie jusqu'en 2035

Partager
Download PDF ×

We do not share your information with anyone. However, we may send you emails based on your report interest from time to time. You may contact us at any time to opt-out.

Interactive Advertising Market Infographic
Purchase Options
  1. 1 SECTION I : RÉSUMÉ EXÉCUTIF ET POINTS CLÉS
    1. 1.1 RÉSUMÉ EXÉCUTIF
      1. 1.1.1 Vue d'ensemble du marché
      2. 1.1.2 Conclusions clés
      3. 1.1.3 Segmentation du marché
      4. 1.1.4 Paysage concurrentiel
      5. 1.1.5 Défis et opportunités
      6. 1.1.6 Perspectives d'avenir
  2. 2 SECTION II : DÉLIMITATION, MÉTHODOLOGIE ET STRUCTURE DU MARCHÉ
    1. 2.1 INTRODUCTION AU MARCHÉ
      1. 2.1.1 Définition
      2. 2.1.2 Portée de l'étude
        1. 2.1.2.1 Objectif de recherche
        2. 2.1.2.2 Hypothèse
        3. 2.1.2.3 Limitations
    2. 2.2 MÉTHODOLOGIE DE RECHERCHE
      1. 2.2.1 Vue d'ensemble
      2. 2.2.2 Exploration de données
      3. 2.2.3 Recherche secondaire
      4. 2.2.4 Recherche primaire
        1. 2.2.4.1 Interviews primaires et processus de collecte d'informations
        2. 2.2.4.2 Répartition des répondants principaux
      5. 2.2.5 Modèle de prévision
      6. 2.2.6 Estimation de la taille du marché
        1. 2.2.6.1 Approche ascendante
        2. 2.2.6.2 Approche descendante
      7. 2.2.7 Triangulation des données
      8. 2.2.8 Validation
  3. 3 SECTION III : ANALYSE QUALITATIVE
    1. 3.1 DYNAMIQUE DU MARCHÉ
      1. 3.1.1 Vue d'ensemble
      2. 3.1.2 Facteurs moteurs
      3. 3.1.3 Contraintes
      4. 3.1.4 Opportunités
    2. 3.2 ANALYSE DES FACTEURS DU MARCHÉ
      1. 3.2.1 Analyse de la chaîne de valeur
      2. 3.2.2 Analyse des cinq forces de Porter
        1. 3.2.2.1 Pouvoir de négociation des fournisseurs
        2. 3.2.2.2 Pouvoir de négociation des acheteurs
        3. 3.2.2.3 Menace des nouveaux entrants
        4. 3.2.2.4 Menace des substituts
        5. 3.2.2.5 Intensité de la rivalité
      3. 3.2.3 Analyse de l'impact du COVID-19
        1. 3.2.3.1 Analyse de l'impact sur le marché
        2. 3.2.3.2 Impact régional
        3. 3.2.3.3 Analyse des opportunités et des menaces
  4. 4 SECTION IV : ANALYSE QUANTITATIVE
    1. 4.1 Semi-conducteurs et électronique, PAR Type (milliards USD)
      1. 4.1.1 Parrainage
      2. 4.1.2 Blogging
      3. 4.1.3 Widgets
      4. 4.1.4 Activation hors ligne
      5. 4.1.5 Médias sociaux
    2. 4.2 Semi-conducteurs et électronique, PAR Taille d'organisation (milliards USD)
      1. 4.2.1 Petites et moyennes entreprises
      2. 4.2.2 Grandes entreprises
    3. 4.3 Semi-conducteurs et électronique, PAR Secteur (milliards USD)
      1. 4.3.1 BFSI
      2. 4.3.2 Vente au détail et biens de consommation
    4. 4.4 Semi-conducteurs et électronique, PAR Région (milliards USD)
      1. 4.4.1 Amérique du Nord
        1. 4.4.1.1 États-Unis
        2. 4.4.1.2 Canada
      2. 4.4.2 Europe
        1. 4.4.2.1 Allemagne
        2. 4.4.2.2 Royaume-Uni
        3. 4.4.2.3 France
        4. 4.4.2.4 Russie
        5. 4.4.2.5 Italie
        6. 4.4.2.6 Espagne
        7. 4.4.2.7 Reste de l'Europe
      3. 4.4.3 APAC
        1. 4.4.3.1 Chine
        2. 4.4.3.2 Inde
        3. 4.4.3.3 Japon
        4. 4.4.3.4 Corée du Sud
        5. 4.4.3.5 Malaisie
        6. 4.4.3.6 Thaïlande
        7. 4.4.3.7 Indonésie
        8. 4.4.3.8 Reste de l'APAC
      4. 4.4.4 Amérique du Sud
        1. 4.4.4.1 Brésil
        2. 4.4.4.2 Mexique
        3. 4.4.4.3 Argentine
        4. 4.4.4.4 Reste de l'Amérique du Sud
      5. 4.4.5 MEA
        1. 4.4.5.1 Pays du CCG
        2. 4.4.5.2 Afrique du Sud
        3. 4.4.5.3 Reste de la MEA
  5. 5 SECTION V : ANALYSE CONCURRENTIELLE
    1. 5.1 Paysage concurrentiel
      1. 5.1.1 Vue d'ensemble
      2. 5.1.2 Analyse concurrentielle
      3. 5.1.3 Analyse de la part de marché
      4. 5.1.4 Stratégie de croissance majeure dans les semi-conducteurs et l'électronique
      5. 5.1.5 Évaluation comparative concurrentielle
      6. 5.1.6 Acteurs principaux en termes de nombre de développements dans les semi-conducteurs et l'électronique
      7. 5.1.7 Développements clés et stratégies de croissance
        1. 5.1.7.1 Lancement de nouveaux produits / Déploiement de services
        2. 5.1.7.2 Fusions et acquisitions
        3. 5.1.7.3 Coentreprises
      8. 5.1.8 Matrice financière des principaux acteurs
        1. 5.1.8.1 Ventes et revenu d'exploitation
        2. 5.1.8.2 Dépenses de R&D des principaux acteurs. 2023
    2. 5.2 Profils d'entreprise
      1. 5.2.1 Google (États-Unis)
        1. 5.2.1.1 Vue d'ensemble financière
        2. 5.2.1.2 Produits offerts
        3. 5.2.1.3 Développements clés
        4. 5.2.1.4 Analyse SWOT
        5. 5.2.1.5 Stratégies clés
      2. 5.2.2 Facebook (États-Unis)
        1. 5.2.2.1 Vue d'ensemble financière
        2. 5.2.2.2 Produits offerts
        3. 5.2.2.3 Développements clés
        4. 5.2.2.4 Analyse SWOT
        5. 5.2.2.5 Stratégies clés
      3. 5.2.3 Amazon (États-Unis)
        1. 5.2.3.1 Vue d'ensemble financière
        2. 5.2.3.2 Produits offerts
        3. 5.2.3.3 Développements clés
        4. 5.2.3.4 Analyse SWOT
        5. 5.2.3.5 Stratégies clés
      4. 5.2.4 Alibaba (Chine)
        1. 5.2.4.1 Vue d'ensemble financière
        2. 5.2.4.2 Produits offerts
        3. 5.2.4.3 Développements clés
        4. 5.2.4.4 Analyse SWOT
        5. 5.2.4.5 Stratégies clés
      5. 5.2.5 Microsoft (États-Unis)
        1. 5.2.5.1 Vue d'ensemble financière
        2. 5.2.5.2 Produits offerts
        3. 5.2.5.3 Développements clés
        4. 5.2.5.4 Analyse SWOT
        5. 5.2.5.5 Stratégies clés
      6. 5.2.6 Adobe (États-Unis)
        1. 5.2.6.1 Vue d'ensemble financière
        2. 5.2.6.2 Produits offerts
        3. 5.2.6.3 Développements clés
        4. 5.2.6.4 Analyse SWOT
        5. 5.2.6.5 Stratégies clés
      7. 5.2.7 Twitter (États-Unis)
        1. 5.2.7.1 Vue d'ensemble financière
        2. 5.2.7.2 Produits offerts
        3. 5.2.7.3 Développements clés
        4. 5.2.7.4 Analyse SWOT
        5. 5.2.7.5 Stratégies clés
      8. 5.2.8 Snap (États-Unis)
        1. 5.2.8.1 Vue d'ensemble financière
        2. 5.2.8.2 Produits offerts
        3. 5.2.8.3 Développements clés
        4. 5.2.8.4 Analyse SWOT
        5. 5.2.8.5 Stratégies clés
      9. 5.2.9 Verizon (États-Unis)
        1. 5.2.9.1 Vue d'ensemble financière
        2. 5.2.9.2 Produits offerts
        3. 5.2.9.3 Développements clés
        4. 5.2.9.4 Analyse SWOT
        5. 5.2.9.5 Stratégies clés
    3. 5.3 Annexe
      1. 5.3.1 Références
      2. 5.3.2 Rapports connexes
  6. 6 LISTE DES FIGURES
    1. 6.1 SYNOPSIS DU MARCHÉ
    2. 6.2 ANALYSE DU MARCHÉ EN AMÉRIQUE DU NORD
    3. 6.3 ANALYSE DU MARCHÉ AUX ÉTATS-UNIS PAR TYPE
    4. 6.4 ANALYSE DU MARCHÉ AUX ÉTATS-UNIS PAR TAILLE D'ORGANISATION
    5. 6.5 ANALYSE DU MARCHÉ AUX ÉTATS-UNIS PAR SECTEUR
    6. 6.6 ANALYSE DU MARCHÉ AU CANADA PAR TYPE
    7. 6.7 ANALYSE DU MARCHÉ AU CANADA PAR TAILLE D'ORGANISATION
    8. 6.8 ANALYSE DU MARCHÉ AU CANADA PAR SECTEUR
    9. 6.9 ANALYSE DU MARCHÉ EN EUROPE
    10. 6.10 ANALYSE DU MARCHÉ EN ALLEMAGNE PAR TYPE
    11. 6.11 ANALYSE DU MARCHÉ EN ALLEMAGNE PAR TAILLE D'ORGANISATION
    12. 6.12 ANALYSE DU MARCHÉ EN ALLEMAGNE PAR SECTEUR
    13. 6.13 ANALYSE DU MARCHÉ AU ROYAUME-UNI PAR TYPE
    14. 6.14 ANALYSE DU MARCHÉ AU ROYAUME-UNI PAR TAILLE D'ORGANISATION
    15. 6.15 ANALYSE DU MARCHÉ AU ROYAUME-UNI PAR SECTEUR
    16. 6.16 ANALYSE DU MARCHÉ EN FRANCE PAR TYPE
    17. 6.17 ANALYSE DU MARCHÉ EN FRANCE PAR TAILLE D'ORGANISATION
    18. 6.18 ANALYSE DU MARCHÉ EN FRANCE PAR SECTEUR
    19. 6.19 ANALYSE DU MARCHÉ EN RUSSIE PAR TYPE
    20. 6.20 ANALYSE DU MARCHÉ EN RUSSIE PAR TAILLE D'ORGANISATION
    21. 6.21 ANALYSE DU MARCHÉ EN RUSSIE PAR SECTEUR
    22. 6.22 ANALYSE DU MARCHÉ EN ITALIE PAR TYPE
    23. 6.23 ANALYSE DU MARCHÉ EN ITALIE PAR TAILLE D'ORGANISATION
    24. 6.24 ANALYSE DU MARCHÉ EN ITALIE PAR SECTEUR
    25. 6.25 ANALYSE DU MARCHÉ EN ESPAGNE PAR TYPE
    26. 6.26 ANALYSE DU MARCHÉ EN ESPAGNE PAR TAILLE D'ORGANISATION
    27. 6.27 ANALYSE DU MARCHÉ EN ESPAGNE PAR SECTEUR
    28. 6.28 ANALYSE DU MARCHÉ DANS LE RESTE DE L'EUROPE PAR TYPE
    29. 6.29 ANALYSE DU MARCHÉ DANS LE RESTE DE L'EUROPE PAR TAILLE D'ORGANISATION
    30. 6.30 ANALYSE DU MARCHÉ DANS LE RESTE DE L'EUROPE PAR SECTEUR
    31. 6.31 ANALYSE DU MARCHÉ EN APAC
    32. 6.32 ANALYSE DU MARCHÉ EN CHINE PAR TYPE
    33. 6.33 ANALYSE DU MARCHÉ EN CHINE PAR TAILLE D'ORGANISATION
    34. 6.34 ANALYSE DU MARCHÉ EN CHINE PAR SECTEUR
    35. 6.35 ANALYSE DU MARCHÉ EN INDE PAR TYPE
    36. 6.36 ANALYSE DU MARCHÉ EN INDE PAR TAILLE D'ORGANISATION
    37. 6.37 ANALYSE DU MARCHÉ EN INDE PAR SECTEUR
    38. 6.38 ANALYSE DU MARCHÉ AU JAPON PAR TYPE
    39. 6.39 ANALYSE DU MARCHÉ AU JAPON PAR TAILLE D'ORGANISATION
    40. 6.40 ANALYSE DU MARCHÉ AU JAPON PAR SECTEUR
    41. 6.41 ANALYSE DU MARCHÉ EN CORÉE DU SUD PAR TYPE
    42. 6.42 ANALYSE DU MARCHÉ EN CORÉE DU SUD PAR TAILLE D'ORGANISATION
    43. 6.43 ANALYSE DU MARCHÉ EN CORÉE DU SUD PAR SECTEUR
    44. 6.44 ANALYSE DU MARCHÉ EN MALAYSIE PAR TYPE
    45. 6.45 ANALYSE DU MARCHÉ EN MALAYSIE PAR TAILLE D'ORGANISATION
    46. 6.46 ANALYSE DU MARCHÉ EN MALAYSIE PAR SECTEUR
    47. 6.47 ANALYSE DU MARCHÉ EN THAÏLANDE PAR TYPE
    48. 6.48 ANALYSE DU MARCHÉ EN THAÏLANDE PAR TAILLE D'ORGANISATION
    49. 6.49 ANALYSE DU MARCHÉ EN THAÏLANDE PAR SECTEUR
    50. 6.50 ANALYSE DU MARCHÉ EN INDONÉSIE PAR TYPE
    51. 6.51 ANALYSE DU MARCHÉ EN INDONÉSIE PAR TAILLE D'ORGANISATION
    52. 6.52 ANALYSE DU MARCHÉ EN INDONÉSIE PAR SECTEUR
    53. 6.53 ANALYSE DU MARCHÉ DANS LE RESTE DE L'APAC PAR TYPE
    54. 6.54 ANALYSE DU MARCHÉ DANS LE RESTE DE L'APAC PAR TAILLE D'ORGANISATION
    55. 6.55 ANALYSE DU MARCHÉ DANS LE RESTE DE L'APAC PAR SECTEUR
    56. 6.56 ANALYSE DU MARCHÉ EN AMÉRIQUE DU SUD
    57. 6.57 ANALYSE DU MARCHÉ AU BRÉSIL PAR TYPE
    58. 6.58 ANALYSE DU MARCHÉ AU BRÉSIL PAR TAILLE D'ORGANISATION
    59. 6.59 ANALYSE DU MARCHÉ AU BRÉSIL PAR SECTEUR
    60. 6.60 ANALYSE DU MARCHÉ AU MEXIQUE PAR TYPE
    61. 6.61 ANALYSE DU MARCHÉ AU MEXIQUE PAR TAILLE D'ORGANISATION
    62. 6.62 ANALYSE DU MARCHÉ AU MEXIQUE PAR SECTEUR
    63. 6.63 ANALYSE DU MARCHÉ EN ARGENTINE PAR TYPE
    64. 6.64 ANALYSE DU MARCHÉ EN ARGENTINE PAR TAILLE D'ORGANISATION
    65. 6.65 ANALYSE DU MARCHÉ EN ARGENTINE PAR SECTEUR
    66. 6.66 ANALYSE DU MARCHÉ DANS LE RESTE DE L'AMÉRIQUE DU SUD PAR TYPE
    67. 6.67 ANALYSE DU MARCHÉ DANS LE RESTE DE L'AMÉRIQUE DU SUD PAR TAILLE D'ORGANISATION
    68. 6.68 ANALYSE DU MARCHÉ DANS LE RESTE DE L'AMÉRIQUE DU SUD PAR SECTEUR
    69. 6.69 ANALYSE DU MARCHÉ EN MEA
    70. 6.70 ANALYSE DU MARCHÉ DANS LES PAYS DU CCG PAR TYPE
    71. 6.71 ANALYSE DU MARCHÉ DANS LES PAYS DU CCG PAR TAILLE D'ORGANISATION
    72. 6.72 ANALYSE DU MARCHÉ DANS LES PAYS DU CCG PAR SECTEUR
    73. 6.73 ANALYSE DU MARCHÉ EN AFRIQUE DU SUD PAR TYPE
    74. 6.74 ANALYSE DU MARCHÉ EN AFRIQUE DU SUD PAR TAILLE D'ORGANISATION
    75. 6.75 ANALYSE DU MARCHÉ EN AFRIQUE DU SUD PAR SECTEUR
    76. 6.76 ANALYSE DU MARCHÉ DANS LE RESTE DE LA MEA PAR TYPE
    77. 6.77 ANALYSE DU MARCHÉ DANS LE RESTE DE LA MEA PAR TAILLE D'ORGANISATION
    78. 6.78 ANALYSE DU MARCHÉ DANS LE RESTE DE LA MEA PAR SECTEUR
    79. 6.79 CRITÈRES D'ACHAT CLÉS DES SEMI-CONDUCTEURS ET DE L'ÉLECTRONIQUE
    80. 6.80 PROCESSUS DE RECHERCHE DE MRFR
    81. 6.81 ANALYSE DRO DES SEMI-CONDUCTEURS ET DE L'ÉLECTRONIQUE
    82. 6.82 ANALYSE D'IMPACT DES FACTEURS MOTRICES : SEMI-CONDUCTEURS ET ÉLECTRONIQUE
    83. 6.83 ANALYSE D'IMPACT DES CONTRAINTES : SEMI-CONDUCTEURS ET ÉLECTRONIQUE
    84. 6.84 CHAÎNE D'APPROVISIONNEMENT / CHAÎNE DE VALEUR : SEMI-CONDUCTEURS ET ÉLECTRONIQUE
    85. 6.85 SEMI-CONDUCTEURS ET ÉLECTRONIQUE, PAR TYPE, 2024 (% PART)
    86. 6.86 SEMI-CONDUCTEURS ET ÉLECTRONIQUE, PAR TYPE, 2024 À 2035 (milliards USD)
    87. 6.87 SEMI-CONDUCTEURS ET ÉLECTRONIQUE, PAR TAILLE D'ORGANISATION, 2024 (% PART)
    88. 6.88 SEMI-CONDUCTEURS ET ÉLECTRONIQUE, PAR TAILLE D'ORGANISATION, 2024 À 2035 (milliards USD)
    89. 6.89 SEMI-CONDUCTEURS ET ÉLECTRONIQUE, PAR SECTEUR, 2024 (% PART)
    90. 6.90 SEMI-CONDUCTEURS ET ÉLECTRONIQUE, PAR SECTEUR, 2024 À 2035 (milliards USD)
    91. 6.91 ÉVALUATION DES PRINCIPAUX CONCURRENTS
  7. 7 LISTE DES TABLEAUX
    1. 7.1 LISTE DES HYPOTHÈSES
  8. 7.1.1
    1. 7.2 ESTIMATIONS DE TAILLE DU MARCHÉ EN AMÉRIQUE DU NORD ; PRÉVISIONS
      1. 7.2.1 PAR TYPE, 2025-2035 (milliards USD)
      2. 7.2.2 PAR TAILLE D'ORGANISATION, 2025-2035 (milliards USD)
      3. 7.2.3 PAR SECTEUR, 2025-2035 (milliards USD)
    2. 7.3 ESTIMATIONS DE TAILLE DU MARCHÉ AUX ÉTATS-UNIS ; PRÉVISIONS
      1. 7.3.1 PAR TYPE, 2025-2035 (milliards USD)
      2. 7.3.2 PAR TAILLE D'ORGANISATION, 2025-2035 (milliards USD)
      3. 7.3.3 PAR SECTEUR, 2025-2035 (milliards USD)
    3. 7.4 ESTIMATIONS DE TAILLE DU MARCHÉ AU CANADA ; PRÉVISIONS
      1. 7.4.1 PAR TYPE, 2025-2035 (milliards USD)
      2. 7.4.2 PAR TAILLE D'ORGANISATION, 2025-2035 (milliards USD)
      3. 7.4.3 PAR SECTEUR, 2025-2035 (milliards USD)
    4. 7.5 ESTIMATIONS DE TAILLE DU MARCHÉ EN EUROPE ; PRÉVISIONS
      1. 7.5.1 PAR TYPE, 2025-2035 (milliards USD)
      2. 7.5.2 PAR TAILLE D'ORGANISATION, 2025-2035 (milliards USD)
      3. 7.5.3 PAR SECTEUR, 2025-2035 (milliards USD)
    5. 7.6 ESTIMATIONS DE TAILLE DU MARCHÉ EN ALLEMAGNE ; PRÉVISIONS
      1. 7.6.1 PAR TYPE, 2025-2035 (milliards USD)
      2. 7.6.2 PAR TAILLE D'ORGANISATION, 2025-2035 (milliards USD)
      3. 7.6.3 PAR SECTEUR, 2025-2035 (milliards USD)
    6. 7.7 ESTIMATIONS DE TAILLE DU MARCHÉ AU ROYAUME-UNI ; PRÉVISIONS
      1. 7.7.1 PAR TYPE, 2025-2035 (milliards USD)
      2. 7.7.2 PAR TAILLE D'ORGANISATION, 2025-2035 (milliards USD)
      3. 7.7.3 PAR SECTEUR, 2025-2035 (milliards USD)
    7. 7.8 ESTIMATIONS DE TAILLE DU MARCHÉ EN FRANCE ; PRÉVISIONS
      1. 7.8.1 PAR TYPE, 2025-2035 (milliards USD)
      2. 7.8.2 PAR TAILLE D'ORGANISATION, 2025-2035 (milliards USD)
      3. 7.8.3 PAR SECTEUR, 2025-2035 (milliards USD)
    8. 7.9 ESTIMATIONS DE TAILLE DU MARCHÉ EN RUSSIE ; PRÉVISIONS
      1. 7.9.1 PAR TYPE, 2025-2035 (milliards USD)
      2. 7.9.2 PAR TAILLE D'ORGANISATION, 2025-2035 (milliards USD)
      3. 7.9.3 PAR SECTEUR, 2025-2035 (milliards USD)
    9. 7.10 ESTIMATIONS DE TAILLE DU MARCHÉ EN ITALIE ; PRÉVISIONS
      1. 7.10.1 PAR TYPE, 2025-2035 (milliards USD)
      2. 7.10.2 PAR TAILLE D'ORGANISATION, 2025-2035 (milliards USD)
      3. 7.10.3 PAR SECTEUR, 2025-2035 (milliards USD)
    10. 7.11 ESTIMATIONS DE TAILLE DU MARCHÉ EN ESPAGNE ; PRÉVISIONS
      1. 7.11.1 PAR TYPE, 2025-2035 (milliards USD)
      2. 7.11.2 PAR TAILLE D'ORGANISATION, 2025-2035 (milliards USD)
      3. 7.11.3 PAR SECTEUR, 2025-2035 (milliards USD)
    11. 7.12 ESTIMATIONS DE TAILLE DU MARCHÉ DANS LE RESTE DE L'EUROPE ; PRÉVISIONS
      1. 7.12.1 PAR TYPE, 2025-2035 (milliards USD)
      2. 7.12.2 PAR TAILLE D'ORGANISATION, 2025-2035 (milliards USD)
      3. 7.12.3 PAR SECTEUR, 2025-2035 (milliards USD)
    12. 7.13 ESTIMATIONS DE TAILLE DU MARCHÉ EN APAC ; PRÉVISIONS
      1. 7.13.1 PAR TYPE, 2025-2035 (milliards USD)
      2. 7.13.2 PAR TAILLE D'ORGANISATION, 2025-2035 (milliards USD)
      3. 7.13.3 PAR SECTEUR, 2025-2035 (milliards USD)
    13. 7.14 ESTIMATIONS DE TAILLE DU MARCHÉ EN CHINE ; PRÉVISIONS
      1. 7.14.1 PAR TYPE, 2025-2035 (milliards USD)
      2. 7.14.2 PAR TAILLE D'ORGANISATION, 2025-2035 (milliards USD)
      3. 7.14.3 PAR SECTEUR, 2025-2035 (milliards USD)
    14. 7.15 ESTIMATIONS DE TAILLE DU MARCHÉ EN INDE ; PRÉVISIONS
      1. 7.15.1 PAR TYPE, 2025-2035 (milliards USD)
      2. 7.15.2 PAR TAILLE D'ORGANISATION, 2025-2035 (milliards USD)
      3. 7.15.3 PAR SECTEUR, 2025-2035 (milliards USD)
    15. 7.16 ESTIMATIONS DE TAILLE DU MARCHÉ AU JAPON ; PRÉVISIONS
      1. 7.16.1 PAR TYPE, 2025-2035 (milliards USD)
      2. 7.16.2 PAR TAILLE D'ORGANISATION, 2025-2035 (milliards USD)
      3. 7.16.3 PAR SECTEUR, 2025-2035 (milliards USD)
    16. 7.17 ESTIMATIONS DE TAILLE DU MARCHÉ EN CORÉE DU SUD ; PRÉVISIONS
      1. 7.17.1 PAR TYPE, 2025-2035 (milliards USD)
      2. 7.17.2 PAR TAILLE D'ORGANISATION, 2025-2035 (milliards USD)
      3. 7.17.3 PAR SECTEUR, 2025-2035 (milliards USD)
    17. 7.18 ESTIMATIONS DE TAILLE DU MARCHÉ EN MALAYSIE ; PRÉVISIONS
      1. 7.18.1 PAR TYPE, 2025-2035 (milliards USD)
      2. 7.18.2 PAR TAILLE D'ORGANISATION, 2025-2035 (milliards USD)
      3. 7.18.3 PAR SECTEUR, 2025-2035 (milliards USD)
    18. 7.19 ESTIMATIONS DE TAILLE DU MARCHÉ EN THAÏLANDE ; PRÉVISIONS
      1. 7.19.1 PAR TYPE, 2025-2035 (milliards USD)
      2. 7.19.2 PAR TAILLE D'ORGANISATION, 2025-2035 (milliards USD)
      3. 7.19.3 PAR SECTEUR, 2025-2035 (milliards USD)
    19. 7.20 ESTIMATIONS DE TAILLE DU MARCHÉ EN INDONÉSIE ; PRÉVISIONS
      1. 7.20.1 PAR TYPE, 2025-2035 (milliards USD)
      2. 7.20.2 PAR TAILLE D'ORGANISATION, 2025-2035 (milliards USD)
      3. 7.20.3 PAR SECTEUR, 2025-2035 (milliards USD)
    20. 7.21 ESTIMATIONS DE TAILLE DU MARCHÉ DANS LE RESTE DE L'APAC ; PRÉVISIONS
      1. 7.21.1 PAR TYPE, 2025-2035 (milliards USD)
      2. 7.21.2 PAR TAILLE D'ORGANISATION, 2025-2035 (milliards USD)
      3. 7.21.3 PAR SECTEUR, 2025-2035 (milliards USD)
    21. 7.22 ESTIMATIONS DE TAILLE DU MARCHÉ EN AMÉRIQUE DU SUD ; PRÉVISIONS
      1. 7.22.1 PAR TYPE, 2025-2035 (milliards USD)
      2. 7.22.2 PAR TAILLE D'ORGANISATION, 2025-2035 (milliards USD)
      3. 7.22.3 PAR SECTEUR, 2025-2035 (milliards USD)
    22. 7.23 ESTIMATIONS DE TAILLE DU MARCHÉ AU BRÉSIL ; PRÉVISIONS
      1. 7.23.1 PAR TYPE, 2025-2035 (milliards USD)
      2. 7.23.2 PAR TAILLE D'ORGANISATION, 2025-2035 (milliards USD)
      3. 7.23.3 PAR SECTEUR, 2025-2035 (milliards USD)
    23. 7.24 ESTIMATIONS DE TAILLE DU MARCHÉ AU MEXIQUE ; PRÉVISIONS
      1. 7.24.1 PAR TYPE, 2025-2035 (milliards USD)
      2. 7.24.2 PAR TAILLE D'ORGANISATION, 2025-2035 (milliards USD)
      3. 7.24.3 PAR SECTEUR, 2025-2035 (milliards USD)
    24. 7.25 ESTIMATIONS DE TAILLE DU MARCHÉ EN ARGENTINE ; PRÉVISIONS
      1. 7.25.1 PAR TYPE, 2025-2035 (milliards USD)
      2. 7.25.2 PAR TAILLE D'ORGANISATION, 2025-2035 (milliards USD)
      3. 7.25.3 PAR SECTEUR, 2025-2035 (milliards USD)
    25. 7.26 ESTIMATIONS DE TAILLE DU MARCHÉ DANS LE RESTE DE L'AMÉRIQUE DU SUD ; PRÉVISIONS
      1. 7.26.1 PAR TYPE, 2025-2035 (milliards USD)
      2. 7.26.2 PAR TAILLE D'ORGANISATION, 2025-2035 (milliards USD)
      3. 7.26.3 PAR SECTEUR, 2025-2035 (milliards USD)
    26. 7.27 ESTIMATIONS DE TAILLE DU MARCHÉ EN MEA ; PRÉVISIONS
      1. 7.27.1 PAR TYPE, 2025-2035 (milliards USD)
      2. 7.27.2 PAR TAILLE D'ORGANISATION, 2025-2035 (milliards USD)
      3. 7.27.3 PAR SECTEUR, 2025-2035 (milliards USD)
    27. 7.28 ESTIMATIONS DE TAILLE DU MARCHÉ DANS LES PAYS DU CCG ; PRÉVISIONS
      1. 7.28.1 PAR TYPE, 2025-2035 (milliards USD)
      2. 7.28.2 PAR TAILLE D'ORGANISATION, 2025-2035 (milliards USD)
      3. 7.28.3 PAR SECTEUR, 2025-2035 (milliards USD)
    28. 7.29 ESTIMATIONS DE TAILLE DU MARCHÉ EN AFRIQUE DU SUD ; PRÉVISIONS
      1. 7.29.1 PAR TYPE, 2025-2035 (milliards USD)
      2. 7.29.2 PAR TAILLE D'ORGANISATION, 2025-2035 (milliards USD)
      3. 7.29.3 PAR SECTEUR, 2025-2035 (milliards USD)
    29. 7.30 ESTIMATIONS DE TAILLE DU MARCHÉ DANS LE RESTE DE LA MEA ; PRÉVISIONS
      1. 7.30.1 PAR TYPE, 2025-2035 (milliards USD)
      2. 7.30.2 PAR TAILLE D'ORGANISATION, 2025-2035 (milliards USD)
      3. 7.30.3 PAR SECTEUR, 2025-2035 (milliards USD)
    30. 7.31 LANCEMENT DE PRODUIT / DÉVELOPPEMENT DE PRODUIT / APPROBATION
  9. 7.31.1
    1. 7.32 ACQUISITION / PARTENARIAT
  10. 7.32.1

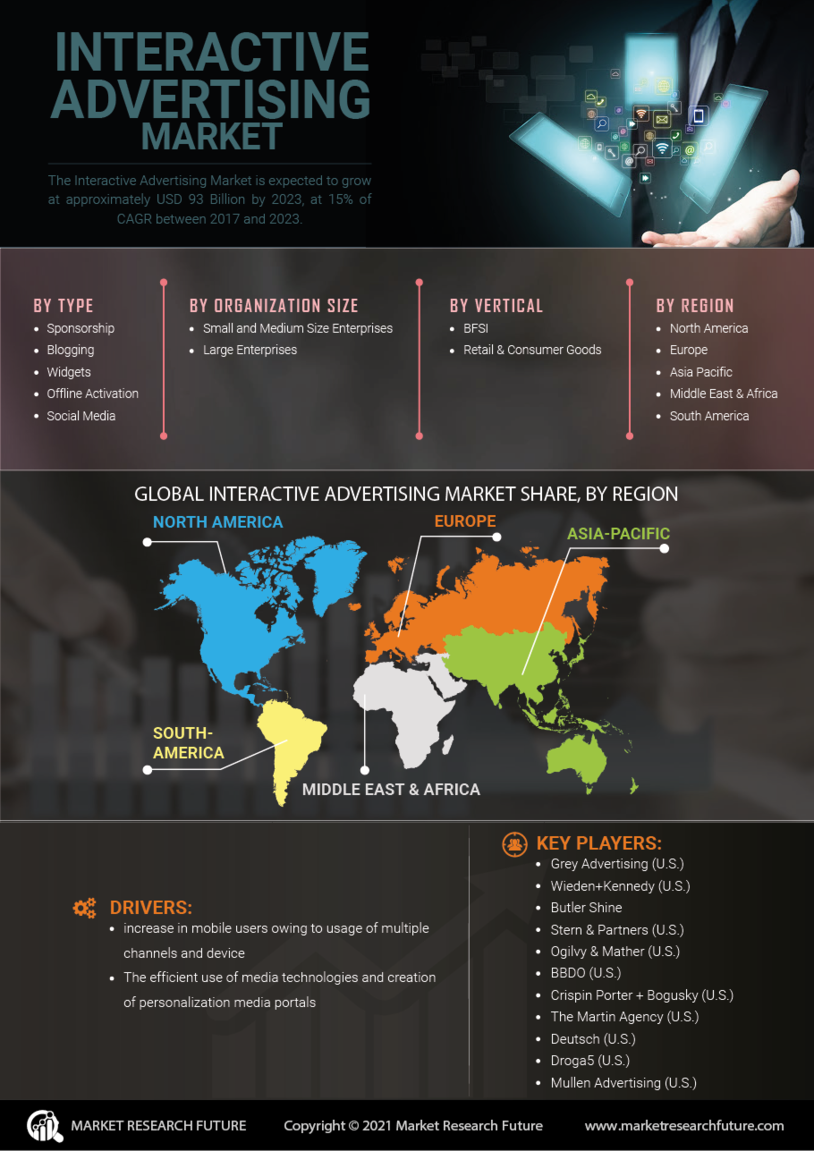
Segmentation du marché de la publicité interactive

Perspectives par type de publicité interactive (milliards USD, 2018-2032)

Sponsoring

Blogging

Widgets

Activation hors ligne

Médias sociaux

Perspectives par taille d'organisation de la publicité interactive (milliards USD, 2018-2032)

Petites et moyennes entreprises

Grandes entreprises

Perspectives par secteur de la publicité interactive (milliards USD, 2018-2032)

BFSI

Commerce de détail et biens de consommation

Perspectives régionales de la publicité interactive (milliards USD, 2018-2032)

Perspectives de l'Amérique du Nord (milliards USD, 2018-2032)

Publicité interactive en Amérique du Nord par type

Sponsoring

Blogging

Widgets

Activation hors ligne

Médias sociaux

Publicité interactive en Amérique du Nord par taille d'organisation

Petites et moyennes entreprises

Grandes entreprises

Publicité interactive en Amérique du Nord par secteur

BFSI

Commerce de détail et biens de consommation

Perspectives des États-Unis (milliards USD, 2018-2032)

Publicité interactive aux États-Unis par type

Sponsoring

Blogging

Widgets

Activation hors ligne

Médias sociaux

Publicité interactive aux États-Unis par taille d'organisation

Petites et moyennes entreprises

Grandes entreprises

Publicité interactive aux États-Unis par secteur

BFSI

Commerce de détail et biens de consommation

Perspectives du CANADA (milliards USD, 2018-2032)

Publicité interactive au CANADA par type

Sponsoring

Blogging

Widgets

Activation hors ligne

Médias sociaux

Publicité interactive au CANADA par taille d'organisation

Petites et moyennes entreprises

Grandes entreprises

Publicité interactive au CANADA par secteur

BFSI

Commerce de détail et biens de consommation

Perspectives de l'Europe (milliards USD, 2018-2032)

Publicité interactive en Europe par type

Sponsoring

Blogging

Widgets

Activation hors ligne

Médias sociaux

Publicité interactive en Europe par taille d'organisation

Petites et moyennes entreprises

Grandes entreprises

Publicité interactive en Europe par secteur

BFSI

Commerce de détail et biens de consommation

Perspectives de l'Allemagne (milliards USD, 2018-2032)

Publicité interactive en Allemagne par type

Sponsoring

Blogging

Widgets

Activation hors ligne

Médias sociaux

Publicité interactive en Allemagne par taille d'organisation

Petites et moyennes entreprises

Grandes entreprises

Publicité interactive en Allemagne par secteur

BFSI

Commerce de détail et biens de consommation

Perspectives de la France (milliards USD, 2018-2032)

Publicité interactive en France par type

Sponsoring

Blogging

Widgets

Activation hors ligne

Médias sociaux

Publicité interactive en France par taille d'organisation

Petites et moyennes entreprises

Grandes entreprises

Publicité interactive en France par secteur

BFSI

Commerce de détail et biens de consommation

Perspectives du Royaume-Uni (milliards USD, 2018-2032)

Publicité interactive au Royaume-Uni par type

Sponsoring

Blogging

Widgets

Activation hors ligne

Médias sociaux

Publicité interactive au Royaume-Uni par taille d'organisation

Petites et moyennes entreprises

Grandes entreprises

Publicité interactive au Royaume-Uni par secteur

BFSI

Commerce de détail et biens de consommation

Perspectives de l'ITALIE (milliards USD, 2018-2032)

Publicité interactive en ITALIE par type

Sponsoring

Blogging

Widgets

Activation hors ligne

Médias sociaux

Publicité interactive en ITALIE par taille d'organisation

Petites et moyennes entreprises

Grandes entreprises

Publicité interactive en ITALIE par secteur

BFSI

Commerce de détail et biens de consommation

Perspectives de l'ESPAGNE (milliards USD, 2018-2032)

Publicité interactive en ESPAGNE par type

Sponsoring

Blogging

Widgets

Activation hors ligne

Médias sociaux

Publicité interactive en ESPAGNE par taille d'organisation

Petites et moyennes entreprises

Grandes entreprises

Publicité interactive en ESPAGNE par secteur

BFSI

Commerce de détail et biens de consommation

Perspectives du reste de l'Europe (milliards USD, 2018-2032)

Publicité interactive dans le reste de l'Europe par type

Sponsoring

Blogging

Widgets

Activation hors ligne

Médias sociaux

Publicité interactive dans le reste de l'Europe par taille d'organisation

Petites et moyennes entreprises

Grandes entreprises

Publicité interactive dans le reste de l'Europe par secteur

BFSI

Commerce de détail et biens de consommation

Perspectives de la région Asie-Pacifique (milliards USD, 2018-2032)

Publicité interactive dans la région Asie-Pacifique par type

Sponsoring

Blogging

Widgets

Activation hors ligne

Médias sociaux

Publicité interactive dans la région Asie-Pacifique par taille d'organisation

Petites et moyennes entreprises

Grandes entreprises

Publicité interactive dans la région Asie-Pacifique par secteur

BFSI

Commerce de détail et biens de consommation

Perspectives de la Chine (milliards USD, 2018-2032)

Publicité interactive en Chine par type

Sponsoring

Blogging

Widgets

Activation hors ligne

Médias sociaux

Publicité interactive en Chine par taille d'organisation

Petites et moyennes entreprises

Grandes entreprises

Publicité interactive en Chine par secteur

BFSI

Commerce de détail et biens de consommation

Perspectives du Japon (milliards USD, 2018-2032)

Publicité interactive au Japon par type

Sponsoring

Blogging

Widgets

Activation hors ligne

Médias sociaux

Publicité interactive au Japon par taille d'organisation

Petites et moyennes entreprises

Grandes entreprises

Publicité interactive au Japon par secteur

BFSI

Commerce de détail et biens de consommation

Perspectives de l'Inde (milliards USD, 2018-2032)

Publicité interactive en Inde par type

Sponsoring

Blogging

Widgets

Activation hors ligne

Médias sociaux

Publicité interactive en Inde par taille d'organisation

Petites et moyennes entreprises

Grandes entreprises

Publicité interactive en Inde par secteur

BFSI

Commerce de détail et biens de consommation

Perspectives de l'Australie (milliards USD, 2018-2032)

Publicité interactive en Australie par type

Sponsoring

Blogging

Widgets

Activation hors ligne

Médias sociaux

Publicité interactive en Australie par taille d'organisation

Petites et moyennes entreprises

Grandes entreprises

Publicité interactive en Australie par secteur

BFSI

Commerce de détail et biens de consommation

Perspectives du reste de la région Asie-Pacifique (milliards USD, 2018-2032)

Publicité interactive dans le reste de la région Asie-Pacifique par type

Sponsoring

Blogging

Widgets

Activation hors ligne

Médias sociaux

Publicité interactive dans le reste de la région Asie-Pacifique par taille d'organisation

Petites et moyennes entreprises

Grandes entreprises

Publicité interactive dans le reste de la région Asie-Pacifique par secteur

BFSI

Commerce de détail et biens de consommation

Perspectives du reste du monde (milliards USD, 2018-2032)

Publicité interactive dans le reste du monde par type

Sponsoring

Blogging

Widgets

Activation hors ligne

Médias sociaux

Publicité interactive dans le reste du monde par taille d'organisation

Petites et moyennes entreprises

Grandes entreprises

Publicité interactive dans le reste du monde par secteur

BFSI

Commerce de détail et biens de consommation

Perspectives du Moyen-Orient (milliards USD, 2018-2032)

Publicité interactive au Moyen-Orient par type

Sponsoring

Blogging

Widgets

Activation hors ligne

Médias sociaux

Publicité interactive au Moyen-Orient par taille d'organisation

Petites et moyennes entreprises

Grandes entreprises

Publicité interactive au Moyen-Orient par secteur

BFSI

Commerce de détail et biens de consommation

Perspectives de l'Afrique (milliards USD, 2018-2032)

Publicité interactive en Afrique par type

Sponsoring

Blogging

Widgets

Activation hors ligne

Médias sociaux

Publicité interactive en Afrique par taille d'organisation

Petites et moyennes entreprises

Grandes entreprises

Publicité interactive en Afrique par secteur

BFSI

Commerce de détail et biens de consommation

Perspectives de l'Amérique latine (milliards USD, 2018-2032)

Publicité interactive en Amérique latine par type

Sponsoring

Blogging

Widgets

Activation hors ligne

Médias sociaux

Publicité interactive en Amérique latine par taille d'organisation

Petites et moyennes entreprises

Grandes entreprises

Publicité interactive en Amérique latine par secteur

BFSI

Commerce de détail et biens de consommation

Compare Licence

×
Features License Type
Single User Multiuser License Enterprise User
Price $4,950 $5,950 $7,250
Maximum User Access Limit 1 User Upto 10 Users Unrestricted Access Throughout the Organization
Free Customization
Direct Access to Analyst
Deliverable Format
Platform Access
Discount on Next Purchase 10% 15% 15%
Printable Versions