Request Free Sample ×

Kindly complete the form below to receive a free sample of this Report

* Please use a valid business email

Leading companies partner with us for data-driven Insights

clients tt-cursor
Hero Background

Marché des Snacks au Fromage

ID: MRFR/FnB/5442-HCR
90 Pages
Pradeep Nandi
Last Updated: April 06, 2026

Rapport de recherche sur le marché des collations au fromage Informations par type de produit (cuit, frit et autres), par canal de distribution (basé sur le magasin et non basé sur le magasin), et par région (Amérique du Nord, Europe, Asie-Pacifique et reste du monde) – Prévisions du marché jusqu'en 2035

Partager
Download PDF ×

We do not share your information with anyone. However, we may send you emails based on your report interest from time to time. You may contact us at any time to opt-out.

Cheese Snacks Market Infographic
Purchase Options
  1. 1 SECTION I : RÉSUMÉ EXÉCUTIF ET POINTS CLÉS

    1. 1.1 RÉSUMÉ EXÉCUTIF
      1. 1.1.1 Vue d'ensemble du marché
      2. 1.1.2 Principales conclusions
      3. 1.1.3 Segmentation du marché
      4. 1.1.4 Paysage concurrentiel
      5. 1.1.5 Défis et opportunités
      6. 1.1.6 Perspectives futures 2 SECTION II : DÉLIMITATION, MÉTHODOLOGIE ET STRUCTURE DU MARCHÉ
    2. 2.1 INTRODUCTION AU MARCHÉ
      1. 2.1.1 Définition
      2. 2.1.2 Portée de l'étude
        1. 2.1.2.1 Objectif de recherche
        2. 2.1.2.2 Hypothèse
        3. 2.1.2.3 Limitations
    3. 2.2 MÉTHODOLOGIE DE RECHERCHE
      1. 2.2.1 Vue d'ensemble
      2. 2.2.2 Exploration de données
      3. 2.2.3 Recherche secondaire
      4. 2.2.4 Recherche primaire
        1. 2.2.4.1 Interviews primaires et processus de collecte d'informations
        2. 2.2.4.2 Répartition des répondants principaux
      5. 2.2.5 Modèle de prévision
      6. 2.2.6 Estimation de la taille du marché
        1. 2.2.6.1 Approche ascendante
        2. 2.2.6.2 Approche descendante
      7. 2.2.7 Triangulation des données
      8. 2.2.8 Validation 3 SECTION III : ANALYSE QUALITATIVE
    4. 3.1 DYNAMIQUE DU MARCHÉ
      1. 3.1.1 Vue d'ensemble
      2. 3.1.2 Facteurs moteurs
      3. 3.1.3 Contraintes
      4. 3.1.4 Opportunités
    5. 3.2 ANALYSE DES FACTEURS DU MARCHÉ
      1. 3.2.1 Analyse de la chaîne de valeur
      2. 3.2.2 Analyse des cinq forces de Porter
        1. 3.2.2.1 Pouvoir de négociation des fournisseurs
        2. 3.2.2.2 Pouvoir de négociation des acheteurs
        3. 3.2.2.3 Menace des nouveaux entrants
        4. 3.2.2.4 Menace des substituts
        5. 3.2.2.5 Intensité de la rivalité
      3. 3.2.3 Analyse de l'impact du COVID-19
        1. 3.2.3.1 Analyse de l'impact sur le marché
        2. 3.2.3.2 Impact régional
        3. 3.2.3.3 Analyse des opportunités et des menaces 4 SECTION IV : ANALYSE QUANTITATIVE
    6. 4.1 Alimentation, Boissons & Nutrition, PAR Type (milliards USD)
      1. 4.1.1 Cuit
      2. 4.1.2 Frit
      3. 4.1.3 Autres
    7. 4.2 Alimentation, Boissons & Nutrition, PAR Canal de distribution (milliards USD)
      1. 4.2.1 Basé sur les magasins
      2. 4.2.2 Non basé sur les magasins
    8. 4.3 Alimentation, Boissons & Nutrition, PAR Région (milliards USD)
      1. 4.3.1 Amérique du Nord
        1. 4.3.1.1 États-Unis
        2. 4.3.1.2 Canada
      2. 4.3.2 Europe
        1. 4.3.2.1 Allemagne
        2. 4.3.2.2 Royaume-Uni
        3. 4.3.2.3 France
        4. 4.3.2.4 Russie
        5. 4.3.2.5 Italie
        6. 4.3.2.6 Espagne
        7. 4.3.2.7 Reste de l'Europe
      3. 4.3.3 APAC
        1. 4.3.3.1 Chine
        2. 4.3.3.2 Inde
        3. 4.3.3.3 Japon
        4. 4.3.3.4 Corée du Sud
        5. 4.3.3.5 Malaisie
        6. 4.3.3.6 Thaïlande
        7. 4.3.3.7 Indonésie
        8. 4.3.3.8 Reste de l'APAC
      4. 4.3.4 Amérique du Sud
        1. 4.3.4.1 Brésil
        2. 4.3.4.2 Mexique
        3. 4.3.4.3 Argentine
        4. 4.3.4.4 Reste de l'Amérique du Sud
      5. 4.3.5 MEA
        1. 4.3.5.1 Pays du CCG
        2. 4.3.5.2 Afrique du Sud
        3. 4.3.5.3 Reste de la MEA 5 SECTION V : ANALYSE CONCURRENTIELLE
    9. 5.1 Paysage concurrentiel
      1. 5.1.1 Vue d'ensemble
      2. 5.1.2 Analyse concurrentielle
      3. 5.1.3 Analyse de la part de marché
      4. 5.1.4 Principale stratégie de croissance dans l'Alimentation, Boissons & Nutrition
      5. 5.1.5 Évaluation comparative
      6. 5.1.6 Acteurs principaux en termes de nombre de développements dans l'Alimentation, Boissons & Nutrition
      7. 5.1.7 Développements clés et stratégies de croissance
        1. 5.1.7.1 Lancement de nouveaux produits/Déploiement de services
        2. 5.1.7.2 Fusions & Acquisitions
        3. 5.1.7.3 Coentreprises
      8. 5.1.8 Matrice financière des principaux acteurs
        1. 5.1.8.1 Ventes et revenu d'exploitation
        2. 5.1.8.2 Dépenses de R&D des principaux acteurs. 2023
    10. 5.2 Profils d'entreprise
      1. 5.2.1 Mondelez International (États-Unis)
        1. 5.2.1.1 Vue d'ensemble financière
        2. 5.2.1.2 Produits offerts
        3. 5.2.1.3 Développements clés
        4. 5.2.1.4 Analyse SWOT
        5. 5.2.1.5 Stratégies clés
      2. 5.2.2 PepsiCo (États-Unis)
        1. 5.2.2.1 Vue d'ensemble financière
        2. 5.2.2.2 Produits offerts
        3. 5.2.2.3 Développements clés
        4. 5.2.2.4 Analyse SWOT
        5. 5.2.2.5 Stratégies clés
      3. 5.2.3 Kraft Heinz (États-Unis)
        1. 5.2.3.1 Vue d'ensemble financière
        2. 5.2.3.2 Produits offerts
        3. 5.2.3.3 Développements clés
        4. 5.2.3.4 Analyse SWOT
        5. 5.2.3.5 Stratégies clés
      4. 5.2.4 General Mills (États-Unis)
        1. 5.2.4.1 Vue d'ensemble financière
        2. 5.2.4.2 Produits offerts
        3. 5.2.4.3 Développements clés
        4. 5.2.4.4 Analyse SWOT
        5. 5.2.4.5 Stratégies clés
      5. 5.2.5 Frito-Lay (États-Unis)
        1. 5.2.5.1 Vue d'ensemble financière
        2. 5.2.5.2 Produits offerts
        3. 5.2.5.3 Développements clés
        4. 5.2.5.4 Analyse SWOT
        5. 5.2.5.5 Stratégies clés
      6. 5.2.6 Breyers (États-Unis)
        1. 5.2.6.1 Vue d'ensemble financière
        2. 5.2.6.2 Produits offerts
        3. 5.2.6.3 Développements clés
        4. 5.2.6.4 Analyse SWOT
        5. 5.2.6.5 Stratégies clés
      7. 5.2.7 Tillamook (États-Unis)
        1. 5.2.7.1 Vue d'ensemble financière
        2. 5.2.7.2 Produits offerts
        3. 5.2.7.3 Développements clés
        4. 5.2.7.4 Analyse SWOT
        5. 5.2.7.5 Stratégies clés
      8. 5.2.8 Bel Brands (États-Unis)
        1. 5.2.8.1 Vue d'ensemble financière
        2. 5.2.8.2 Produits offerts
        3. 5.2.8.3 Développements clés
        4. 5.2.8.4 Analyse SWOT
        5. 5.2.8.5 Stratégies clés
      9. 5.2.9 Lactalis (FR)
        1. 5.2.9.1 Vue d'ensemble financière
        2. 5.2.9.2 Produits offerts
        3. 5.2.9.3 Développements clés
        4. 5.2.9.4 Analyse SWOT
        5. 5.2.9.5 Stratégies clés
      10. 5.2.10 Arla Foods (DK)
        1. 5.2.10.1 Vue d'ensemble financière
        2. 5.2.10.2 Produits offerts
        3. 5.2.10.3 Développements clés
        4. 5.2.10.4 Analyse SWOT
        5. 5.2.10.5 Stratégies clés
    11. 5.3 Annexe
      1. 5.3.1 Références
      2. 5.3.2 Rapports connexes 6 LISTE DES FIGURES
    12. 6.1 SYNOPSIS DU MARCHÉ
    13. 6.2 ANALYSE DU MARCHÉ EN AMÉRIQUE DU NORD
    14. 6.3 ANALYSE DU MARCHÉ AMÉRICAIN PAR TYPE
    15. 6.4 ANALYSE DU MARCHÉ AMÉRICAIN PAR CANAL DE DISTRIBUTION
    16. 6.5 ANALYSE DU MARCHÉ CANADIEN PAR TYPE
    17. 6.6 ANALYSE DU MARCHÉ CANADIEN PAR CANAL DE DISTRIBUTION
    18. 6.7 ANALYSE DU MARCHÉ EN EUROPE
    19. 6.8 ANALYSE DU MARCHÉ ALLEMAND PAR TYPE
    20. 6.9 ANALYSE DU MARCHÉ ALLEMAND PAR CANAL DE DISTRIBUTION
    21. 6.10 ANALYSE DU MARCHÉ ROYAUMOIS PAR TYPE
    22. 6.11 ANALYSE DU MARCHÉ ROYAUMOIS PAR CANAL DE DISTRIBUTION
    23. 6.12 ANALYSE DU MARCHÉ FRANÇAIS PAR TYPE
    24. 6.13 ANALYSE DU MARCHÉ FRANÇAIS PAR CANAL DE DISTRIBUTION
    25. 6.14 ANALYSE DU MARCHÉ RUSSE PAR TYPE
    26. 6.15 ANALYSE DU MARCHÉ RUSSE PAR CANAL DE DISTRIBUTION
    27. 6.16 ANALYSE DU MARCHÉ ITALIEN PAR TYPE
    28. 6.17 ANALYSE DU MARCHÉ ITALIEN PAR CANAL DE DISTRIBUTION
    29. 6.18 ANALYSE DU MARCHÉ ESPAGNOL PAR TYPE
    30. 6.19 ANALYSE DU MARCHÉ ESPAGNOL PAR CANAL DE DISTRIBUTION
    31. 6.20 ANALYSE DU MARCHÉ DU RESTE DE L'EUROPE PAR TYPE
    32. 6.21 ANALYSE DU MARCHÉ DU RESTE DE L'EUROPE PAR CANAL DE DISTRIBUTION
    33. 6.22 ANALYSE DU MARCHÉ APAC
    34. 6.23 ANALYSE DU MARCHÉ CHINOIS PAR TYPE
    35. 6.24 ANALYSE DU MARCHÉ CHINOIS PAR CANAL DE DISTRIBUTION
    36. 6.25 ANALYSE DU MARCHÉ INDIEN PAR TYPE
    37. 6.26 ANALYSE DU MARCHÉ INDIEN PAR CANAL DE DISTRIBUTION
    38. 6.27 ANALYSE DU MARCHÉ JAPONAIS PAR TYPE
    39. 6.28 ANALYSE DU MARCHÉ JAPONAIS PAR CANAL DE DISTRIBUTION
    40. 6.29 ANALYSE DU MARCHÉ CORÉEN DU SUD PAR TYPE
    41. 6.30 ANALYSE DU MARCHÉ CORÉEN DU SUD PAR CANAL DE DISTRIBUTION
    42. 6.31 ANALYSE DU MARCHÉ MALAYSIEN PAR TYPE
    43. 6.32 ANALYSE DU MARCHÉ MALAYSIEN PAR CANAL DE DISTRIBUTION
    44. 6.33 ANALYSE DU MARCHÉ THAÏLAIS PAR TYPE
    45. 6.34 ANALYSE DU MARCHÉ THAÏLAIS PAR CANAL DE DISTRIBUTION
    46. 6.35 ANALYSE DU MARCHÉ INDONÉSIEN PAR TYPE
    47. 6.36 ANALYSE DU MARCHÉ INDONÉSIEN PAR CANAL DE DISTRIBUTION
    48. 6.37 ANALYSE DU MARCHÉ DU RESTE DE L'APAC PAR TYPE
    49. 6.38 ANALYSE DU MARCHÉ DU RESTE DE L'APAC PAR CANAL DE DISTRIBUTION
    50. 6.39 ANALYSE DU MARCHÉ EN AMÉRIQUE DU SUD
    51. 6.40 ANALYSE DU MARCHÉ BRÉSILIEN PAR TYPE
    52. 6.41 ANALYSE DU MARCHÉ BRÉSILIEN PAR CANAL DE DISTRIBUTION
    53. 6.42 ANALYSE DU MARCHÉ MEXICAIN PAR TYPE
    54. 6.43 ANALYSE DU MARCHÉ MEXICAIN PAR CANAL DE DISTRIBUTION
    55. 6.44 ANALYSE DU MARCHÉ ARGENTIN PAR TYPE
    56. 6.45 ANALYSE DU MARCHÉ ARGENTIN PAR CANAL DE DISTRIBUTION
    57. 6.46 ANALYSE DU MARCHÉ DU RESTE DE L'AMÉRIQUE DU SUD PAR TYPE
    58. 6.47 ANALYSE DU MARCHÉ DU RESTE DE L'AMÉRIQUE DU SUD PAR CANAL DE DISTRIBUTION
    59. 6.48 ANALYSE DU MARCHÉ MEA
    60. 6.49 ANALYSE DU MARCHÉ DES PAYS DU CCG PAR TYPE
    61. 6.50 ANALYSE DU MARCHÉ DES PAYS DU CCG PAR CANAL DE DISTRIBUTION
    62. 6.51 ANALYSE DU MARCHÉ EN AFRIQUE DU SUD PAR TYPE
    63. 6.52 ANALYSE DU MARCHÉ EN AFRIQUE DU SUD PAR CANAL DE DISTRIBUTION
    64. 6.53 ANALYSE DU MARCHÉ DU RESTE DE LA MEA PAR TYPE
    65. 6.54 ANALYSE DU MARCHÉ DU RESTE DE LA MEA PAR CANAL DE DISTRIBUTION
    66. 6.55 CRITÈRES D'ACHAT CLÉS DES ALIMENTS, BOISSONS & NUTRITION
    67. 6.56 PROCESSUS DE RECHERCHE DE MRFR
    68. 6.57 ANALYSE DRO DES ALIMENTS, BOISSONS & NUTRITION
    69. 6.58 ANALYSE D'IMPACT DES FACTEURS MOTRICES : ALIMENTS, BOISSONS & NUTRITION
    70. 6.59 ANALYSE D'IMPACT DES CONTRAINTES : ALIMENTS, BOISSONS & NUTRITION
    71. 6.60 CHAÎNE D'APPROVISIONNEMENT / DE VALEUR : ALIMENTS, BOISSONS & NUTRITION
    72. 6.61 ALIMENTS, BOISSONS & NUTRITION, PAR TYPE, 2024 (% PART)
    73. 6.62 ALIMENTS, BOISSONS & NUTRITION, PAR TYPE, 2024 À 2035 (milliards USD)
    74. 6.63 ALIMENTS, BOISSONS & NUTRITION, PAR CANAL DE DISTRIBUTION, 2024 (% PART)
    75. 6.64 ALIMENTS, BOISSONS & NUTRITION, PAR CANAL DE DISTRIBUTION, 2024 À 2035 (milliards USD)
    76. 6.65 ÉVALUATION DES PRINCIPAUX CONCURRENTS 7 LISTE DES TABLEAUX
    77. 7.1 LISTE DES HYPOTHÈSES
  2. 7.1.1
    1. 7.2 ESTIMATIONS DE TAILLE DU MARCHÉ EN AMÉRIQUE DU NORD ; PRÉVISION
      1. 7.2.1 PAR TYPE, 2025-2035 (milliards USD)
      2. 7.2.2 PAR CANAL DE DISTRIBUTION, 2025-2035 (milliards USD)
    2. 7.3 ESTIMATIONS DE TAILLE DU MARCHÉ AUX ÉTATS-UNIS ; PRÉVISION
      1. 7.3.1 PAR TYPE, 2025-2035 (milliards USD)
      2. 7.3.2 PAR CANAL DE DISTRIBUTION, 2025-2035 (milliards USD)
    3. 7.4 ESTIMATIONS DE TAILLE DU MARCHÉ AU CANADA ; PRÉVISION
      1. 7.4.1 PAR TYPE, 2025-2035 (milliards USD)
      2. 7.4.2 PAR CANAL DE DISTRIBUTION, 2025-2035 (milliards USD)
    4. 7.5 ESTIMATIONS DE TAILLE DU MARCHÉ EN EUROPE ; PRÉVISION
      1. 7.5.1 PAR TYPE, 2025-2035 (milliards USD)
      2. 7.5.2 PAR CANAL DE DISTRIBUTION, 2025-2035 (milliards USD)
    5. 7.6 ESTIMATIONS DE TAILLE DU MARCHÉ EN ALLEMAGNE ; PRÉVISION
      1. 7.6.1 PAR TYPE, 2025-2035 (milliards USD)
      2. 7.6.2 PAR CANAL DE DISTRIBUTION, 2025-2035 (milliards USD)
    6. 7.7 ESTIMATIONS DE TAILLE DU MARCHÉ AU ROYAUME-UNI ; PRÉVISION
      1. 7.7.1 PAR TYPE, 2025-2035 (milliards USD)
      2. 7.7.2 PAR CANAL DE DISTRIBUTION, 2025-2035 (milliards USD)
    7. 7.8 ESTIMATIONS DE TAILLE DU MARCHÉ EN FRANCE ; PRÉVISION
      1. 7.8.1 PAR TYPE, 2025-2035 (milliards USD)
      2. 7.8.2 PAR CANAL DE DISTRIBUTION, 2025-2035 (milliards USD)
    8. 7.9 ESTIMATIONS DE TAILLE DU MARCHÉ EN RUSSIE ; PRÉVISION
      1. 7.9.1 PAR TYPE, 2025-2035 (milliards USD)
      2. 7.9.2 PAR CANAL DE DISTRIBUTION, 2025-2035 (milliards USD)
    9. 7.10 ESTIMATIONS DE TAILLE DU MARCHÉ EN ITALIE ; PRÉVISION
      1. 7.10.1 PAR TYPE, 2025-2035 (milliards USD)
      2. 7.10.2 PAR CANAL DE DISTRIBUTION, 2025-2035 (milliards USD)
    10. 7.11 ESTIMATIONS DE TAILLE DU MARCHÉ EN ESPAGNE ; PRÉVISION
      1. 7.11.1 PAR TYPE, 2025-2035 (milliards USD)
      2. 7.11.2 PAR CANAL DE DISTRIBUTION, 2025-2035 (milliards USD)
    11. 7.12 ESTIMATIONS DE TAILLE DU MARCHÉ DU RESTE DE L'EUROPE ; PRÉVISION
      1. 7.12.1 PAR TYPE, 2025-2035 (milliards USD)
      2. 7.12.2 PAR CANAL DE DISTRIBUTION, 2025-2035 (milliards USD)
    12. 7.13 ESTIMATIONS DE TAILLE DU MARCHÉ EN APAC ; PRÉVISION
      1. 7.13.1 PAR TYPE, 2025-2035 (milliards USD)
      2. 7.13.2 PAR CANAL DE DISTRIBUTION, 2025-2035 (milliards USD)
    13. 7.14 ESTIMATIONS DE TAILLE DU MARCHÉ EN CHINE ; PRÉVISION
      1. 7.14.1 PAR TYPE, 2025-2035 (milliards USD)
      2. 7.14.2 PAR CANAL DE DISTRIBUTION, 2025-2035 (milliards USD)
    14. 7.15 ESTIMATIONS DE TAILLE DU MARCHÉ EN INDE ; PRÉVISION
      1. 7.15.1 PAR TYPE, 2025-2035 (milliards USD)
      2. 7.15.2 PAR CANAL DE DISTRIBUTION, 2025-2035 (milliards USD)
    15. 7.16 ESTIMATIONS DE TAILLE DU MARCHÉ AU JAPON ; PRÉVISION
      1. 7.16.1 PAR TYPE, 2025-2035 (milliards USD)
      2. 7.16.2 PAR CANAL DE DISTRIBUTION, 2025-2035 (milliards USD)
    16. 7.17 ESTIMATIONS DE TAILLE DU MARCHÉ EN CORÉE DU SUD ; PRÉVISION
      1. 7.17.1 PAR TYPE, 2025-2035 (milliards USD)
      2. 7.17.2 PAR CANAL DE DISTRIBUTION, 2025-2035 (milliards USD)
    17. 7.18 ESTIMATIONS DE TAILLE DU MARCHÉ EN MALAYSIE ; PRÉVISION
      1. 7.18.1 PAR TYPE, 2025-2035 (milliards USD)
      2. 7.18.2 PAR CANAL DE DISTRIBUTION, 2025-2035 (milliards USD)
    18. 7.19 ESTIMATIONS DE TAILLE DU MARCHÉ EN THAÏLANDE ; PRÉVISION
      1. 7.19.1 PAR TYPE, 2025-2035 (milliards USD)
      2. 7.19.2 PAR CANAL DE DISTRIBUTION, 2025-2035 (milliards USD)
    19. 7.20 ESTIMATIONS DE TAILLE DU MARCHÉ EN INDONÉSIE ; PRÉVISION
      1. 7.20.1 PAR TYPE, 2025-2035 (milliards USD)
      2. 7.20.2 PAR CANAL DE DISTRIBUTION, 2025-2035 (milliards USD)
    20. 7.21 ESTIMATIONS DE TAILLE DU MARCHÉ DU RESTE DE L'APAC ; PRÉVISION
      1. 7.21.1 PAR TYPE, 2025-2035 (milliards USD)
      2. 7.21.2 PAR CANAL DE DISTRIBUTION, 2025-2035 (milliards USD)
    21. 7.22 ESTIMATIONS DE TAILLE DU MARCHÉ EN AMÉRIQUE DU SUD ; PRÉVISION
      1. 7.22.1 PAR TYPE, 2025-2035 (milliards USD)
      2. 7.22.2 PAR CANAL DE DISTRIBUTION, 2025-2035 (milliards USD)
    22. 7.23 ESTIMATIONS DE TAILLE DU MARCHÉ AU BRÉSIL ; PRÉVISION
      1. 7.23.1 PAR TYPE, 2025-2035 (milliards USD)
      2. 7.23.2 PAR CANAL DE DISTRIBUTION, 2025-2035 (milliards USD)
    23. 7.24 ESTIMATIONS DE TAILLE DU MARCHÉ AU MEXIQUE ; PRÉVISION
      1. 7.24.1 PAR TYPE, 2025-2035 (milliards USD)
      2. 7.24.2 PAR CANAL DE DISTRIBUTION, 2025-2035 (milliards USD)
    24. 7.25 ESTIMATIONS DE TAILLE DU MARCHÉ EN ARGENTINE ; PRÉVISION
      1. 7.25.1 PAR TYPE, 2025-2035 (milliards USD)
      2. 7.25.2 PAR CANAL DE DISTRIBUTION, 2025-2035 (milliards USD)
    25. 7.26 ESTIMATIONS DE TAILLE DU MARCHÉ DU RESTE DE L'AMÉRIQUE DU SUD ; PRÉVISION
      1. 7.26.1 PAR TYPE, 2025-2035 (milliards USD)
      2. 7.26.2 PAR CANAL DE DISTRIBUTION, 2025-2035 (milliards USD)
    26. 7.27 ESTIMATIONS DE TAILLE DU MARCHÉ EN MEA ; PRÉVISION
      1. 7.27.1 PAR TYPE, 2025-2035 (milliards USD)
      2. 7.27.2 PAR CANAL DE DISTRIBUTION, 2025-2035 (milliards USD)
    27. 7.28 ESTIMATIONS DE TAILLE DU MARCHÉ DES PAYS DU CCG ; PRÉVISION
      1. 7.28.1 PAR TYPE, 2025-2035 (milliards USD)
      2. 7.28.2 PAR CANAL DE DISTRIBUTION, 2025-2035 (milliards USD)
    28. 7.29 ESTIMATIONS DE TAILLE DU MARCHÉ EN AFRIQUE DU SUD ; PRÉVISION
      1. 7.29.1 PAR TYPE, 2025-2035 (milliards USD)
      2. 7.29.2 PAR CANAL DE DISTRIBUTION, 2025-2035 (milliards USD)
    29. 7.30 ESTIMATIONS DE TAILLE DU MARCHÉ DU RESTE DE LA MEA ; PRÉVISION
      1. 7.30.1 PAR TYPE, 2025-2035 (milliards USD)
      2. 7.30.2 PAR CANAL DE DISTRIBUTION, 2025-2035 (milliards USD)
    30. 7.31 LANCEMENT DE PRODUIT/DÉVELOPPEMENT DE PRODUIT/APPROBATION
  3. 7.31.1
    1. 7.32 ACQUISITION/PARTENARIAT
  4. 7.32.1

Segmentation du marché

Perspectives des types de produits de collations au fromage (milliards USD, 2019-2030)
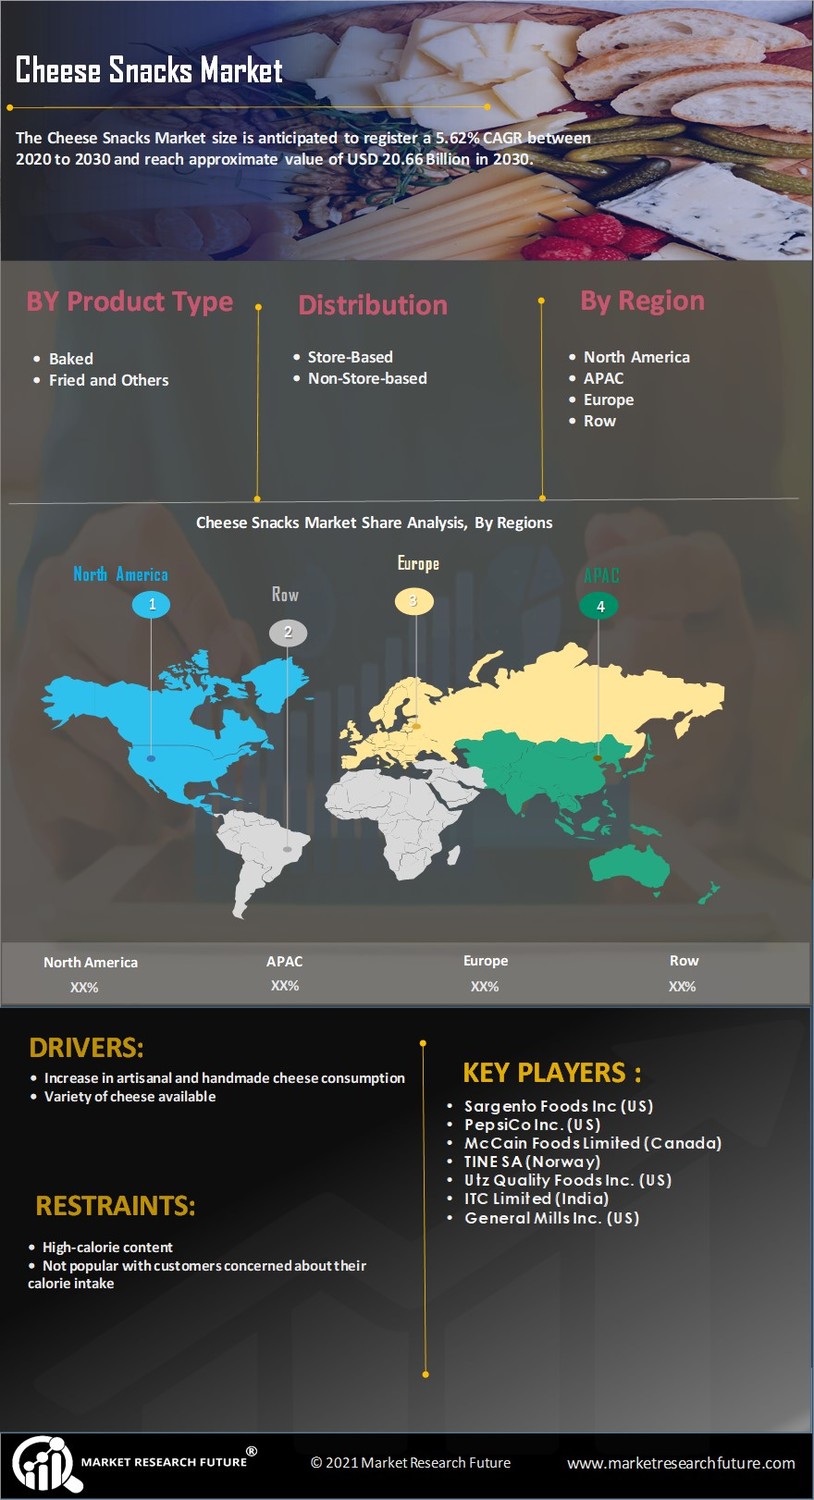
Cuit au four

Frit

Autres

Perspectives des canaux de distribution de collations au fromage (milliards USD, 2019-2030)

Basé en magasin

Non basé en magasin

Perspectives régionales des collations au fromage (milliards USD, 2019-2030)

Perspectives de l'Amérique du Nord (milliards USD, 2019-2030)

Collations au fromage en Amérique du Nord par type de produit

Cuit au four

Frit

Autres

Collations au fromage en Amérique du Nord par canal de distribution

Basé en magasin

Non basé en magasin

Perspectives des États-Unis (milliards USD, 2019-2030)

Collations au fromage aux États-Unis par type de produit

Cuit au four

Frit

Autres

Collations au fromage aux États-Unis par canal de distribution

Basé en magasin

Non basé en magasin

Perspectives du CANADA (milliards USD, 2019-2030)

Collations au fromage au Canada par type de produit

Cuit au four

Frit

Autres

Collations au fromage au Canada par canal de distribution

Basé en magasin

Non basé en magasin

Perspectives de l'Europe (milliards USD, 2019-2030)

Collations au fromage en Europe par type de produit

Cuit au four

Frit

Autres

Collations au fromage en Europe par canal de distribution

Basé en magasin

Non basé en magasin

Perspectives de l'Allemagne (milliards USD, 2019-2030)

Collations au fromage en Allemagne par type de produit

Cuit au four

Frit

Autres

Collations au fromage en Allemagne par canal de distribution

Basé en magasin

Non basé en magasin

Perspectives de la France (milliards USD, 2019-2030)

Collations au fromage en France par type de produit

Cuit au four

Frit

Autres

Collations au fromage en France par canal de distribution

Basé en magasin

Non basé en magasin

Perspectives du Royaume-Uni (milliards USD, 2019-2030)

Collations au fromage au Royaume-Uni par type de produit

Cuit au four

Frit

Autres

Collations au fromage au Royaume-Uni par canal de distribution

Basé en magasin

Non basé en magasin

Perspectives de l'ITALIE (milliards USD, 2019-2030)

Collations au fromage en Italie par type de produit

Cuit au four

Frit

Autres

Collations au fromage en Italie par canal de distribution

Basé en magasin

Non basé en magasin

Perspectives de l'ESPAGNE (milliards USD, 2019-2030)

Collations au fromage en Espagne par type de produit

Cuit au four

Frit

Autres

Collations au fromage en Espagne par canal de distribution

Basé en magasin

Non basé en magasin

Perspectives du reste de l'Europe (milliards USD, 2019-2030)

Collations au fromage dans le reste de l'Europe par type de produit

Cuit au four

Frit

Autres

Collations au fromage dans le reste de l'Europe par canal de distribution

Basé en magasin

Non basé en magasin

Perspectives de la région Asie-Pacifique (milliards USD, 2019-2030)

Collations au fromage dans la région Asie-Pacifique par type de produit

Cuit au four

Frit

Autres

Collations au fromage dans la région Asie-Pacifique par canal de distribution

Basé en magasin

Non basé en magasin

Perspectives de la Chine (milliards USD, 2019-2030)

Collations au fromage en Chine par type de produit

Cuit au four

Frit

Autres

Collations au fromage en Chine par canal de distribution

Basé en magasin

Non basé en magasin

Perspectives du Japon (milliards USD, 2019-2030)

Collations au fromage au Japon par type de produit

Cuit au four

Frit

Autres

Collations au fromage au Japon par canal de distribution

Basé en magasin

Non basé en magasin

Perspectives de l'Inde (milliards USD, 2019-2030)

Collations au fromage en Inde par type de produit

Cuit au four

Frit

Autres

Collations au fromage en Inde par canal de distribution

Basé en magasin

Non basé en magasin

Perspectives de l'Australie (milliards USD, 2019-2030)

Collations au fromage en Australie par type de produit

Cuit au four

Frit

Autres

Collations au fromage en Australie par canal de distribution

Basé en magasin

Non basé en magasin

Perspectives du reste de la région Asie-Pacifique (milliards USD, 2019-2030)

Collations au fromage dans le reste de la région Asie-Pacifique par type de produit

Cuit au four

Frit

Autres

Collations au fromage dans le reste de la région Asie-Pacifique par canal de distribution

Basé en magasin

Non basé en magasin

Perspectives du reste du monde (milliards USD, 2019-2030)

Collations au fromage dans le reste du monde par type de produit

Cuit au four

Frit

Autres

Collations au fromage dans le reste du monde par canal de distribution

Basé en magasin

Non basé en magasin

Perspectives du Moyen-Orient (milliards USD, 2019-2030)

Collations au fromage au Moyen-Orient par type de produit

Cuit au four

Frit

Autres

Collations au fromage au Moyen-Orient par canal de distribution

Basé en magasin

Non basé en magasin

Perspectives de l'Afrique (milliards USD, 2019-2030)

Collations au fromage en Afrique par type de produit

Cuit au four

Frit

Autres

Collations au fromage en Afrique par canal de distribution

Basé en magasin

Non basé en magasin

Perspectives de l'Amérique Latine (milliards USD, 2019-2030)

Collations au fromage en Amérique Latine par type de produit

Cuit au four

Frit

Autres

Collations au fromage en Amérique Latine par canal de distribution

Basé en magasin

Non basé en magasin

Compare Licence

×
Features License Type
Single User Multiuser License Enterprise User
Price $4,950 $5,950 $7,250
Maximum User Access Limit 1 User Upto 10 Users Unrestricted Access Throughout the Organization
Free Customization
Direct Access to Analyst
Deliverable Format
Platform Access
Discount on Next Purchase 10% 15% 15%
Printable Versions