Segmentación del mercado de alimentos, bebidas y nutrición
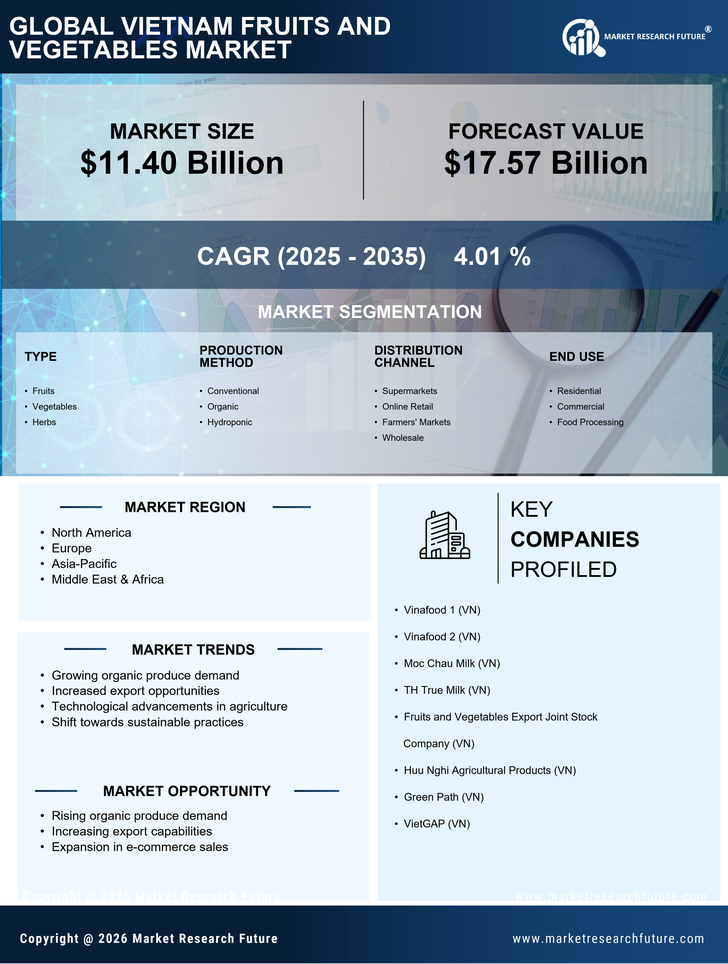
Alimentos, bebidas y nutrición por tipo (USD Miles de millones, 2025-2035)
- frutas
- Verduras
- Hierbas
Alimentos, bebidas y nutrición por método de producción (USD Mil millones, 2025-2035)
- Convencional
- Orgánico
- Hidropónico
Alimentos, bebidas y nutrición por canal de distribución (USD mil millones, 2025-2035)
- supermercados
- Venta al por menor en línea
- Mercados de agricultores
- Al por mayor
Alimentos, bebidas y nutrición por uso final (USD Miles de millones, 2025-2035)
- Residencial
- Comercial
- Procesamiento de alimentos